

Summary
Calcium-activated chloride channels (CaCC) formed by TMEM16A or TMEM16B are broadly expressed in the nervous system, smooth muscles, exocrine glands, and other tissues. With two calcium-binding sites and a pore within each monomer, the dimeric CaCC exhibits voltage dependent calcium sensitivity. Channel activity also depends on the identity of permeant anions. To understand how CaCC regulates neuronal signaling and how CaCC is, in turn, modulated by neuronal activity, we examined the molecular basis of CaCC gating. Here we report voltage modulation of TMEM16A-CaCC involves voltage-dependent occupancy of calcium and anion binding site(s) within the membrane electric field as well as a voltage-dependent conformational change intrinsic to the channel protein. These gating modalities all critically depend on the sixth transmembrane segment.
ETOC BLURB
TMEM16A is an ion channel protein with functions in a multitude of cell types. Peters et al. identified a specific domain that integrates the responses of this channel to three separable physiological stimuli.
Introduction
While cation channel gating and its contribution to the physiology of excitable cells have been studied extensively, gating mechanisms of anion channels are far less well understood. TMEM16A (TransMEMbrane protein of unknown function 16A, also known as Anoctamin-1 or ANO1) is a calcium-activated chloride channel (CaCC) (Caputo et al., 2008; Schroeder et al., 2008; Yang et al., 2008) in many epithelial cell types (Huang et al., 2009), nociceptive neurons (Cho et al., 2012), smooth muscles (Davis et al., 2010; Huang et al., 2012), and tumor cells (Ardeleanu et al., 2009; Duvvuri et al., 2012). A hallmark feature of TMEM16A-CaCCs is the apparent voltage dependence of its Ca2+ sensitivity. To understand how TMEM16A-CaCCs might contribute to cellular physiology, we examined how this channel is controlled by membrane potential, Ca2+ ions, and permeant anions.
TMEM16A-CaCC channels are homodimers of subunits each containing ten membrane spanning segments (Paulino et al., 2017; Dang et al., 2017). Intracellular Ca2+ ions are coordinated by the side chains of six amino acid residues (Yu et al., 2012; Tien et al., 2014; Dang et al., 2017; Paulino et al., 2017), and Ca2+ binding results in the activation of a channel that prefers permeation of Cl− anions over small monovalent cations, and larger I− anions over Cl− anions (Caputo et al., 2008; Schroeder et al., 2008; Yang et al., 2008). Structural information suggests that anions traverse through a passage formed by portions of transmembrane helices 3–8 (Paulino et al., 2017; Dang et al., 2017). Mutations of residues surrounding this passage can modify anion selectivity (Peters et al., 2015; Dang et al., 2017) and anion/cation preference (Yang et al., 2012). The two pores of the dimeric channel likely function independently (Jeng et al., 2016; Lim et al., 2016).
TMEM16A open probability depends on not only intracellular Ca2+ but also membrane voltage and external anions (Perez-Cornejo et al., 2004; Contreras-Vite et al., 2016). While nanomolar intracellular concentrations of Ca2+ produce an outwardly rectifying current, micromolar and higher concentrations of Ca2+ elicit an Ohmic current The transition between rectifying and Ohmic currents can be achieved at lower concentrations of intracellular Ca2+ if extracellular Cl− is replaced with more permeant anions such as I− (Cruz-Rangel et al., 2017). A kinetic model of gating has been proposed to account for contributions from these different stimuli (Contreras-Vite et al., 2016), but the molecular mechanisms for these gating processes are unclear. We propose that CaCC gating stems from the following voltage dependent processes: i) Ca2+ binding occurs at a site within the membrane voltage field, causing an increase in the apparent binding affinity of the channel for Ca2+ at depolarizing voltages; ii) extracellular anions potentiate anion flux by binding to one or more modulatory sites inside the electric field of a multi-ion pore; and/or iii) TMEM16A channels undergo voltage dependent conformational changes leading to a non-linear conductance/voltage relationship.
Here, we performed molecular dynamics (MD) simulations of the fungal homolog nhTMEM16 and incorporated TMEM16A structural information to dissect gating behavior in TMEM16A channel mutants. We found that transmembrane segment 6 (TM6), which is α-helical in both nhTMEM16 (Brunner et al., 2014) and TMEM16A (Paulino et al., 2017; Dang et al., 2017), is flexible in MD simulations of nhTMEM16 (Figures S1A and S1B), and appears capable of adopting multiple stable conformations in TMEM16A. Furthermore, TM6 contributes residues to both the putative pore and the Ca2+ binding site (Brunner et al., 2014; Tien et al., 2014; Paulino et al., 2017; Dang et al., 2017). An alanine mutagenesis scan identified mutations that shifted the EC50 for Ca2+ gating at +60 mV. Subsequent analysis revealed that several of these mutations decoupled the Ca2+, anion, and voltage-dependent gating processes, allowing us to study these processes in isolation. Our fast solution exchange pharmacology and patch clamp analyses established that depolarization, intracellular Ca2+, and external anions all act upon TM6 to permit the flow of anions through the channel. Furthermore, the transfer of a mildly voltage-dependent intrinsic gating element involves at least two conformational changes of or about TM6, which influence and are influenced by the binding of intracellular Ca2+ ions and the identity of the permeating anion.
Results
Internal calcium and external anions modify voltage-dependence of TMEM16A channel activation
Gating of TMEM16A-CaCCs is sensitive to intracellular Ca2+ level and the identity of permeant anions. To characterize these gating processes, we transiently expressed in HEK293 cells TMEM16A from mus musculus with pEGFP fused to its C-terminus and channel properties identical to those wild-type channels (Tien et al., 2014; Peters et al., 2015), henceforth referred to as “wild-type”, and employed whole cell patch clamp to record currents in voltage clamp mode. Exposing cells expressing wild-type TMEM16A to 400 nM Ca2+ allowed the channel to act as an outward rectifier, with the primary flux being inward flowing Cl− ions (Figures 1A–1C). Replacement of Cl− ions with I− ions caused shifts in the reversal potential (Peters et al., 2015) as well as a sensitizing (left) shift in voltage dependence (Figures 1A–1C). Increasing intracellular Ca2+ to 1 mM caused the channel to permit inward currents at hyperpolarizing voltages (i.e., outward flow of Cl−), leading to a nearly voltage-independent conductance-voltage relationship (Figures 1A–1C). The physical bases for how membrane voltage, intracellular Ca2+ ions and extracellular permeant anions interact to contribute to TMEM16A gating remain intriguing open questions (Figure 1D).
Figure 1. TMEM16A channel conductance is modulated by intracellular calcium, membrane voltage and extracellular anions.
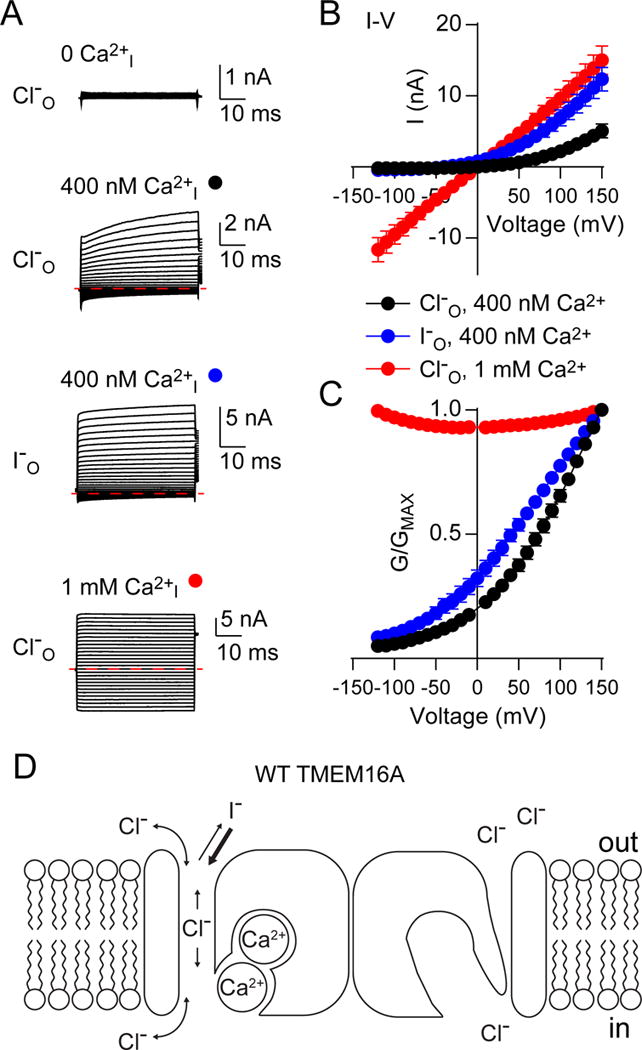
A. Sample traces from whole cell patch clamped HEK293 cells expressing wild-type TMEM16A and stepped from −120 mV to +150 mV from a holding potential of 0 mV, in the presence of external 140 mM NaCl or NaI (anion indicated on the left) and internal 140 mM NaCl with 0 nM, 400 nM or 1 mM free calcium (indicated above). Red dashed lines indicate 0 nA. B. Current-voltage (IV) relationships for traces in A highlight the different factors affecting TMEM16A gating. TMEM16A is outwardly rectifying at moderate internal Ca2+ but loses rectification at high internal Ca2+, n = 5, 5 and 7 for 400 nM Ca2+ with Cl−, 400 nM Ca2+ with I− and 1 mM Ca2+ with Cl− traces, respectively. C. Steady-state whole cell conductances, derived from the data shown in B, are corrected against the reversal potential and normalized to +150 mV. D. A simplified schematic of TMEM16A gating illustrates a conceptual model of calcium, voltage and anion-dependent modulation of channel conductance. Error bars in B and C represent mean ± SEM. See also Figures S1 and S2.
Molecular dynamics simulation of nhTMEM16 and cryo-EM structures of TMEM16A-CaCC channels suggest the 6th transmembrane segment contributes to both anion permeation and calcium binding
To analyze the molecular basis of channel gating, we examined an atomic resolution structure of nhTMEM16 from Nectria haematococca, Protein Data Bank ID: 4WIS (Brunner et al., 2014), and several recently published structures of the TMEM16A channel, PDB ID: 5OYB, 5OYG, 6BGI and 6BGJ (Paulino et al., 2017; Dang et al., 2017), beginning with molecular dynamic simulations from the nhTMEM16 crystal structure (Bethel and Grabe, 2016). Briefly, nhTMEM16 was embedded in a phosphatidylcholine bilayer, and we ran a number of atomistic simulations consisting of 3.2 μs total aggregate time. Reasoning that components of the channel involved in gating would likely be dynamic and simulation may result in new protein conformations indicative of the gating motions, we aligned snapshots of the protein taken every 16 ns and calculated the root mean squared fluctuation (RMSF) of TM6 as well as the other two helices harboring residues involved in Ca2+-binding (TM7 and TM8). Figure S1A shows the TM6 helix from our 200 snapshots overlaid onto the structure of the first snapshot. TM6 has a relatively high degree of flexibility, consistent with a poorly ordered or highly mobile region. For instance, the RMSF of the cytoplasmic end of TM6 is 1.5 Å (Figure S1B). Consistent with the notion that TM6 represents a region of flexibility, two recent studies of TMEM16A structures revealed that the conformation of TM6 depends on the cryo-EM conditions (Paulino et al., 2017; Dang et al., 2017). TM6 of TMEM16A reconstituted in nanodiscs (Dang et al., 2017) is largely α-helical, whereas the C-terminal half of TM6 in TMEM16A solubilized with Lauryl Maltose Neopentyl Glycol is unresolved, indicative of flexibility (Dang et al., 2017).
Alanine point mutants along TM6 produce significant shifts in calcium-dependent activation
Alignment of TM6 of TMEM16A with that of other family members (Figure 2A) demonstrates that it is particularly well conserved in TMEM16B, a highly similar CaCC. A model based on an atomic resolution cryo-EM structure of TMEM16A in nanodiscs was used to map the pore lining surface in dark grey (Figure 2B). Reasoning that TM6 at the interface between the permeation path and the Ca2+ binding site is ideally situated to contribute to channel gating, we performed alanine scanning mutagenesis of TM6 (Figure 2A). Of the 28 mutant constructs tested in HEK293 cells, 25 produced observable currents in inside out patches exposed to Ca2+ from the cytoplasmic side and held at +60 mV. Of the remaining three constructs with negligible currents, two (M638A and P654A) appeared to be poorly trafficked to the membrane, while L643A reached the membrane but was electrically non-functional (Figure S2A, S2B). To characterize channel mutants, we exposed inside out membrane patches from HEK293 cells to a series of solutions containing fixed concentrations of Cl− ions but increasing concentrations of free Ca2+ ions (see sample traces in Figure 2C). We normalized the currents at various Ca2+ concentrations to current amplitude at a saturating concentration of Ca2+ (1 mM for most constructs; 10 mM for E650A) and fitted with sigmoidal concentration-response curves (equation 1 in STAR Methods), to derive the EC50s and Hill coefficients (Figures 2D and 2E). Mutation at a known Ca2+ binding residue, E650 (Tien et al., 2014; Dang et al., 2017), and two asparagine residues, one of which may represent a 6th Ca2+-binding residue (Brunner et al., 2014; Dang et al., 2017), produced significant reductions in Ca2+ sensitivity (red bars with black hashmarks). Numerous other residues N-terminal to the Ca2+ binding residues of TM6 also produced statistically significant reductions in apparent Ca2+ sensitivity (Figure 2D). However, we also noticed that several residues within TM6 increased apparent Ca2+ sensitivity, including some that significantly reduced the Hill coefficient (Figure 2E). Because these mutated residues are not implicated in Ca2+ binding, we hypothesized that they may increase apparent Ca2+ sensitivity by producing conformational changes that facilitate either Ca2+ ion binding or channel activation after Ca2+ binding.
Figure 2. Transmembrane helix 6 lines the anion pore and harbors Ca2+-binding sites, and plays a role in Ca2+-dependence of channel activation.
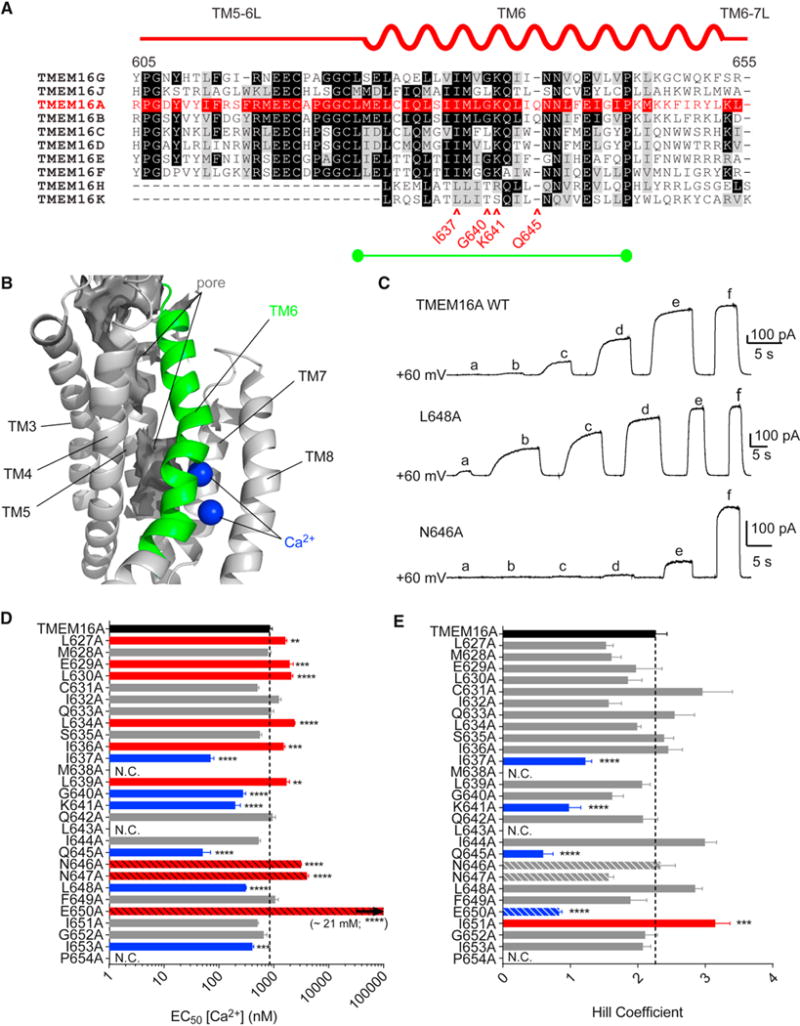
A. A representation of mouse TMEM16A TM6 placed above an unbiased sequence alignment of the TM5-6 linker and TM6 of mouse TMEM16A with the other nine mouse TMEM16 family members. Black shading indicates that ≥70% and grey shading indicates 50–70% of TMEM16 family members have the same amino acid as in TMEM16A, which is denoted in red. The alanine-scanned region, indicated by a green bar, includes residues of particular interest marked by red arrows. B. Cryo-EM structure of TMEM16A wuth TM6 highlighted in green, bound Ca2+ ions shown in blue, and the contours of an aqueous pore shown in dark grey. C. Sample traces of inside-out patches pulled from HEK293 cells expressing the indicated construct and exposed to a series of increasing Ca2+ concentrations at +60 mV. Solutions a-f contained 150 nM, 300 nM, 400 nM, 600 nM, 5.5 μM and 1 mM Ca2+, respectively. D. EC50 values for Ca2+ concentration-response relationships from curves fit to traces as in panel C, with statistically significant right shifts highlighted in red, and significant left shifts highlighted in blue. Bars for residues that may directly coordinate Ca2+ ions are shown with diagonal hatches. “N.C.” for constructs with protein expression but no current (see also Figure S2). n for WT, 19; L627A, 6; M628A, 5; E629A, 6; L630A, 6; C631A, 5; I632A, 8; Q633A, 4; L634A, 10; S635A, 9; I636A, 10; I637A, 8; L639A, 6; G640A, 9; K641A, 8; Q642A, 6; I644A, 8; Q645A, 7; N646A, 4; N647A, 5; L648A, 6; F649A, 7; E650A, 4; I651A, 10; G652A, 10; I653A, 11. E. Hill coefficients for fits as in panel D., with significant increased highlighted in red, and significant decrease highlighted in blue. EC50 values and Hill coefficients were compared using one-way ANOVA followed by a Bonferroni post-hoc test for statistical significance. Data in panels D and E are expressed as mean ± SEM.
Alanine substitution of I637 or Q645 in TM6 enhances calcium sensitivity and enables channel activation in the absence of internal Ca2+
Next, we characterized mutants resulting in significant increases in apparent Ca2+ sensitivity, reasoning that they were likely involved in channel gating rather than directly affecting Ca2+-binding. We tested all such alanine mutant constructs in Ca2+-free internal solutions using whole-cell patch clamp. Remarkably, I637A and Q645A, the two mutations producing the largest sensitizing shifts, resulted in an outward rectifying current voltage relationship within the physiological range in the absence of Ca2+ (Figures 3A–3C). Channels with mutations at G640, K641, L648, and I653 remained incapable of opening in the absence of Ca2+ up to +200 mV (Figure S3A, S3B). We confirmed the bona fide “Ca2+-independent” activation in Q645A by showing that channel activity remained the same with 5 mM BAPTA and 1 mM EDTA added to our normal “Ca2+ free solution” (which contained 5 mM EGTA) and with omission of Mg2+ ions, which do not normally activate TMEM16A (Ni et al., 2014), out of concern that the mutation may have sensitized the channel to Mg2+. In addition, equivalent mutations in the TMEM16B channel also exhibited Ca2+-independent activation, albeit requiring more depolarizing voltages and producing smaller apparent whole cell currents (Figures S3C and S3D). To confirm that these mutations changed TMEM16A gating properties while preserving its channel permeation characteristics, we performed non-stationary fluctuation analysis of Q645A (Figures S4A and S4B; Heinemann and Conti, 1992) and showed that the single channel conductance of Q645A was 3.2 ± 0.4 pS, which is comparable to that of WT at 2.8 ± 0.5 pS (Figure S4C) and consistent with previous reports (Manoury et al., 2010; Lim et al., 2016; Ta et al., 2016). We also exposed this channel to a series of bi-ionic anion replacement solutions with internal solutions containing Cl− and external solutions containing another anion species or 14 mM NaCl supplemented with D-mannitol, and found a selectivity sequence among the anions tested of PI>PCl>PF>PMES>PAspartate>PGluconate, and a PNa+/PCl− of 0.10 (Figures S4D–S4F), consistent with previous findings for WT TMEM16A. Finally, we compared the conductance-voltage relationships of Q645A exposed to NaCl and NMDG-Cl and found no change in the waveform, suggesting that the monovalent cationic species did not influence the conductance-voltage relationship. Taken together, these results suggest that TM6 mutations are capable of shifting Ca2+ sensitivity and allowing the mutant channel to activate in the absence of Ca2+ at depolarizing voltages without affecting ion selectivity or the single channel conductance.
Figure 3. Alanine substitutions for I637 and Q645 in TM6 allow outward-rectifying anion conductance in the absence of internal Ca2+ and are functionally asymmetric following removal of the G640 hinge.
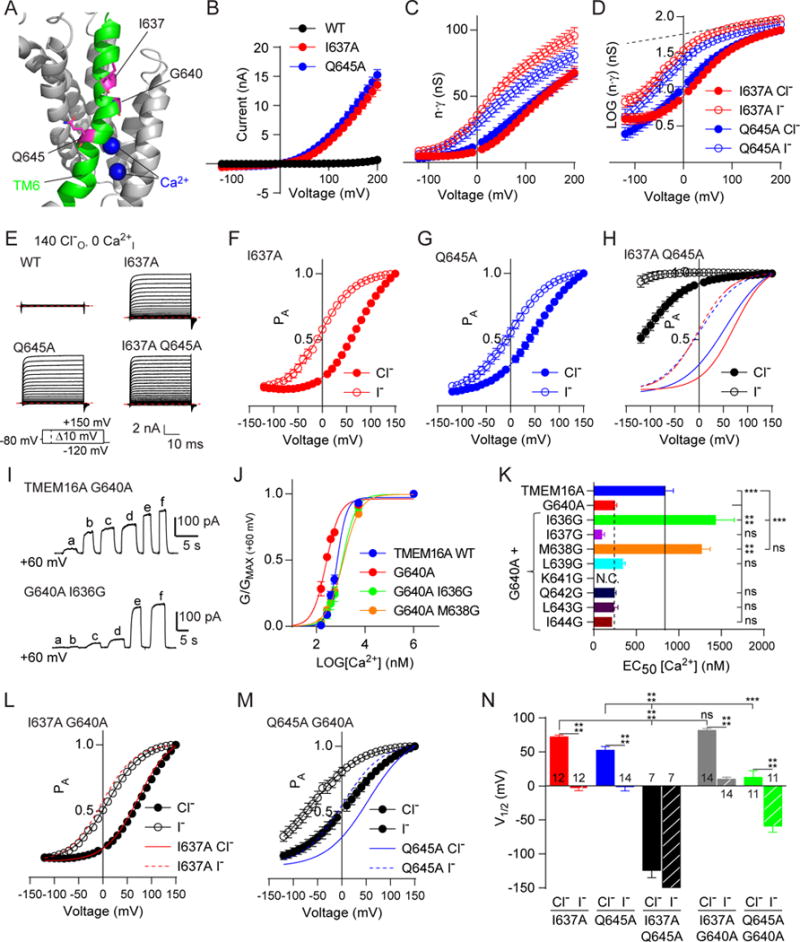
A. Image of TMEM16A highlighting the position (in purple) of I637, G640, and Q645 in TM6 (green), with bound Ca2+ (blue). B. Current-voltage (IV) relationships for WT, I637A, and Q645A TMEM16A with 0 nM internal Ca2+ reveal that the I637A and Q645A mutations remove the requirement for Ca2+ for activation (see also Figure S3) as revealed by whole-cell patch clamp, using 10 mV voltage steps from −120 mV to +150 mV from a holding potential of −80 mV. C. Conductance-voltage (GV) relationships for I637A (red) and Q645A (blue) derived from the IV curves shown in panel B, with filled circles depicting data gathered with chloride and open circles with iodide as the external anion. D. Log10 transformation of the data in C with grey dashed line indicating a non-saturating conductance at the highest positive voltages. G-V traces corrected for external anion-dependence can then be fit with a two-state Boltzmann relationship (see also Figure S5). E. Sample traces from whole cell patch clamp recording of HEK293 cells expressing wild-type TMEM16A or channels bearing either or both Q645A and I637A mutations exposed to a series of voltage commands from a holding potential of −80 mV with external chloride and 0 nM internal Ca2+. Red dashed lines indicate 0 nA. F, G, and H. Graphs depicting normalized GV relationships after subtraction of non-saturating conductance (“Probability-activated” or PA) reveal a conductance with a Boltzmann profile. Solid lines in panel H represent PA with chloride and dashed lines with iodide as the permeant anion. I. Sample traces of inside-out patches exposed to a series of increasing Ca2+ concentrations at +60 mV. Solutions a-f contained 150 nM, 300 nM, 400 nM, 600 nM, 5.5 μM and 1 mM Ca2+, respectively. J. Graph derived from data shown in I revealing the change in conductance with increasing Ca2+. The G640A mutation increases sensitivity to Ca2+, but mutating I636 or M638 to Gly restores the normal Ca2+ sensitivity. K. Bar graph showing that only the I636G and M638G mutations can rescue the G640A mutation. n was WT, 19; G640A, 9; GA I636G, 11; GA I637G, 4; GA M638G, 5; GA L639G, 4; GA A642G, 5; GA L643G, 6; GA I644G, 4. L and M. PA vs voltage relationships comparing the effect of I637A (L) and Q645A (M) mutations in the G640A background, with solid lines depicting the fits to I637A or Q645A mutations alone. N. A comparison of fitted V1/2s for combinations of I637A, Q645A, and G640A, representing information presented in panels F, G, H, L, and M. Data are expressed as mean ± SEM and where error bars are invisible, they are contained within the points. See also Figures S3–S5.
Permeant anions potentiate conductance via an externally situated binding site
Notably, the two mutants with sensitizing shifts in both voltage-dependent and Ca2+-dependent gating remained sensitive to the concentration and identity of external anionic species, similar to an effect seen previously for heterologously expressed TMEM16A and endogenous CaCC in Xenopus oocytes (Perez-Cornejo et al., 2004; Contreras-Vite et al., 2016). Furthermore, plotting I637A and Q645A whole cell conductances for Cl− and I− against voltage revealed that the channel open probability (Po) did not saturate even at strongly depolarizing (e.g., +150 mV) potentials (Figure 3C). When plotted with a semi-Log ordinate, normalized G(V) increased linearly with voltage even at strongly depolarizing potentials (Figure 3D), unlike outwardly rectifying potassium channels (Zagotta et al., 1994) with Po approaching 1 under depolarizing conditions due to full activation of all voltage sensors. Replacing external Cl− with I− caused the G(V) curve to shift leftward while retaining a positive slope (Figure 3D). These results implicate the involvement of anions with a binding site accessible to the external medium in a rate-limiting process for the apparent voltage-dependence of channel conductance.
To parse the effects of external anion binding, we recorded whole cell currents of Q645A with internal Cl− replaced with aspartate ions that cannot easily pass through CaCC channels, to yield near unidirectional anionic fluxes with amplitudes proportional to the kON of anions from the extracellular milieu to an external binding site. As kON is also dependent on the concentration of anions in the bulk external solution, we applied varying concentrations of Cl− or I− and quantified an EC50 for each anion at a series of strongly depolarizing voltages to eliminate the trace influence of internal anions (Figures S5AS5C). Subsequently, these EC50s were Log transformed and fit with equation 2 (in STAR Methods) to establish the depth in the voltage field of this anion sensitive site for channel potentiation (Figure S5D). The linear fits to these points yielded an apparent zδ of 0.058 ± 0.013 for Cl− and 0.057 ± 0.012 for I−. We reasoned that the outermost site of channel interaction with anions likely exists at that depth, consistent with a previous finding suggesting a shallow anion binding site and pore blocking site accessible from the extracellular space (Peters et al., 2015). Moreover, we reasoned that I− binds to the same site with higher affinity than Cl− because both ions had the same voltage dependence (zδ).
Permeant anions and intracellular calcium affect an innate voltage dependent gating process of TMEM16A
We next sought to separate the effects of the modulatory site from other intrinsic components of the overall conductance-voltage relationship. We reasoned that eliminating Ca2+-dependent gating should allow us to probe whether additional voltage sensitivity exists, so we examined I637A and Q645A mutant channel activation in the absence of intracellular Ca2+. By fitting the whole cell G(V) curves between +150 and +180 mV in the presence of external Cl− or I− with equation 2 and using zδ = 0.06 to establish an upper limit for the slope of the semi-Log plot, we could separate values for the apparent anion-dependent effect producing non-saturating conductance at extreme depolarizations from a residual voltage dependence of the channel (Figures 3E–3G). Fitting this voltage dependence with a two-state Boltzmann relationship (equation 3 in STAR Methods) suggests that the mutant channel itself undergoes a discrete voltage-dependent rearrangement, henceforth referred to as “PA” for the voltage dependent probability of the channel being in the activated conformation. TMEM16A I637A has a V1/2 of 72.2 ± 2.7 mV (n = 12) while Q645A has a V1/2 of 52.6 ± 5.3 mV (n = 14) in the presence of Cl−. Replacement of Cl− with I− led to a significant left shift in V1/2 in I637A to −3.6 ± 3.4 mV (n =12) and in Q645A to −1.1 ± 6.2 mV (n = 13) (Figures 3F and 3G). Thus, extracellular anions permeating through the pore influence its intrinsic voltage-dependent gating, independent of Ca2+-occupancy of the mutant channel. We then examined the double mutant I637A Q645A, and found a negative shift in the voltage dependence compared to that of either single mutant (Figures 3H and 3N). This result suggests that these two mutations likely introduce separate, distinguishable changes to gating stemming from movements of or about TM6.
It was notable that alanine substitution for the G640 residue between I637 and Q645 also increased Ca2+ sensitivity (Figure 2D). Glycine residues found along the pore lining helices of ion channels such as KcsA and the Shaker family potassium channels are implicated as hinge bending elements crucial for channel gating (Jiang et al., 2002; Ding et al., 2005). Typically glycine to alanine mutations would reduce hinge bending. Remarkably, G640A facilitated activation of the TMEM16A by Ca2+. This raises the possibility that if G640 acts as a flexible hinge or inflection point, it may favor a closed channel conformation or hamper Ca2+ binding. We tested whether the reintroduction of glycine nearby could restore normal Ca2+-dependence and found that two double mutations of G640A, with I636G or M638G, both decreased Ca2+-sensitivity to near wild-type levels (Figures 3I–3K). Thus, the presence of a glycine at or near position 640 is important for Ca2+-dependent gating at physiologically relevant Ca2+ concentrations. We next asked whether this glycine might also contribute to the equilibrium of voltage-dependent gating of I637A or Q645A. Recording of double mutants I637A G640A or Q645A G640A in Ca2+-free solutions in whole cell patch clamp conditions revealed that G640A imparted an additional left-shift in voltage-dependence to Q645A but not I637A (Figures 3L–3N). This result suggests that the flexible hinge afforded by G640 plays a role in Q645A but not I637A channel gating, further reinforcing the notion that TM6 likely undergoes at least two sequential movements during voltage-dependent gating.
A lysine in TM6 contributes voltage-dependence to TMEM16A activation
The Ca2+ sensitivity was increased by alanine substitution for the K641 basic residue within the pore region (Figures 2D and 4A), which has been implicated in both anion conductance and gating of the channel (Peters et al., 2015). Because the double mutant of K641A with Q645A did not show expression in HEK293 cells, we examined the charge neutralization and charge reversal double mutant constructs Q645A K641Q and Q645A K641E using whole cell patch clamp in Ca2+ free internal solution (Figure 4B), and found significant right-shifts to the voltage-dependent PA (Figures 4C, 4D and 4F). These shifts persisted even when extracellular Cl− was replaced by I−, albeit with smaller magnitudes. Furthermore, Q645A K641E exhibited a left shift in PA in the presence of 1 mM intracellular Ca2+ similar to that in Ca2+-free solutions (Figures 4E and 4F). However, Ca2+ ions were no longer able to push the channel to its “Ohmic” conformation, nor were they able to relieve the dependence of PA on external anionic species as observed in the wild-type channel with high Ca2+. Taken together, these results suggest that K641 at the lower end of TM6 is critical for regulating the dependence of channel gating on voltage, Ca2+ and anions (Figure 4G).
Figure 4. Neutralization and charge reversal of K641 in TM6 shifts the voltage-dependence of TMEM16A and is sensitive to the presence of Ca2+.

A. Image of TMEM16A highlighting the positions of K641 (cyan) in TM6, with bound Ca2+ indicated in blue. B. Sample traces from whole cell patch clamp recording of HEK293 cells expressing TMEM16A with the Q645A mutation (left) or Q645A and K641E mutations (right), stepped from −120 mV to +150 mV in 10 mV steps from a holding potential of −80 mV. Chloride was the permeant anion in each case, with 0 nM internal Ca2+ used in the top row and 1 mM Ca2+ used in the bottom row. Red dashed lines indicate 0 nA. C and D. Graphs showing the PA-V relationship for TMEM16A Q645A K641Q (C) and Q645A K641E (D), with blue lines indicating fits to the Q645A single mutant. K641Q shifts the curve to the right and K641E causes a greater shift. E. PA-V relationship of Q645A K641E mutant with 1 mM Ca2+ resembles that of the Q645A single mutant. Solid and dashed lines indicate the fit to Q645A K641E with 0 mM Ca2+ and external chloride (solid) or iodide (dashed). G. Schematic depicting possible changes in TMEM16A conformation after depolarization or Ca2+ binding. Position of residues and side chains do not reflect actual structure and are meant to be illustrative. Data are expressed as mean ± SEM and where error bars are invisible, they are contained within the points.
Mutation of calcium-binding residues shifts TMEM16A voltage-dependence
TM6 harbors 2 of the 6 amino acids critical for coordinating Ca2+, including 5 acidic residues and an asparagine. Having found that both N646 and N647 produced right-shifts in the EC50 for Ca2+ (Figure 2D), we examined aspartate substitution for either asparagine using inside-out patch clamp electrophysiology to test whether introduction of an additional negative charge to the Ca2+ binding sites causes a sensitizing shift in the EC50 for Ca2+. N646D but not N647D caused a potent increase in Ca2+-sensitivity [EC50: 216 ± 15 nM (n = 9); Figures S6A and S6B], consistent with the observation that N646 participates in Ca2+ binding (Dang et al., 2017) (Figure 5A). As I637A and Q645A are mutations within TM6 capable of facilitating activation of the channel in the absence of Ca2+ ions, they also provided the opportunity to parse the role of Ca2+ from the voltage-dependence of this domain. PA of I637A N646A and I637A E650A double mutants in Ca2+-free solutions was the same as that of I637A single mutant (Figure 5B). Conversely, both N646A and E650A produced strong sensitizing shifts in PA when placed in the Q645A background (Figure 5C). We considered two possible explanations for this phenomenon: either these Ca2+ binding residues represent negative “gating charges,” or the absence of Ca2+ in its binding site results in destabilization of the configuration of the Ca2+ binding sites due to electrostatic or steric effects. As N646 is not charged, we favored the second explanation, and to test it, we made additional double mutants of Q645A with the remaining Ca2+-binding residues. Q645A E698A appeared similar to wild-type, but Q645 E701A, Q645A E730A and Q645A D734A all resulted in strong sensitizing shifts in PA (Figures 5D–5F), supporting the notion that the negative charges on these residues may repel each other in the absence of Ca2+ as a stabilizing ligand. Indeed, E698A is spatially removed from the other 5 residues and is likely to only interact with one of the two Ca2+ ions, while E650, E701 and E730 form a ring (Figure 5A, lower panel) and are likely to interact with both Ca2+ ions.
Figure 5. I637 and Q645 are differently affected by mutations in the Ca2+ binding pocket.
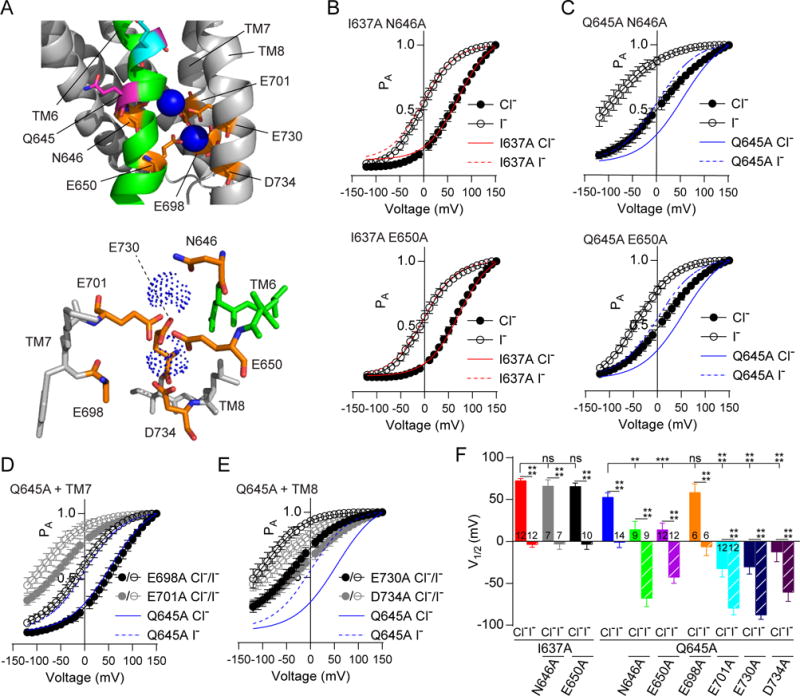
A. A close view of the Ca2+ binding pocket of TMEM16A with TM6 in green, Q645 in purple, I637 in cyan, residues interacting with Ca2+ in orange, and Ca2+ in blue. B and C. PA-V relationships of the I637A (B) and Q645A (C) TMEM16A mutants bearing additional TM6 mutations of the Ca2+ binding residues N646 (top) and E650 (bottom). N646A or E650A does not affect the voltage-dependence of the I637A mutant but causes a left-shift in the Q645A mutant. Red and blue lines depict the fits to I637A (red) or Q645A (blue) single mutants for comparison. D and E. Graphs showing PA-V relationships of the Q645A mutant with mutations of Ca2+ binding residues in TM7 (D) and TM8 (E) reveal that mutations in TM7 and TM8 create left shifts in the Q645A mutant background, with the exception of E698. F. A bar graph comparing the V1/2s of Boltzmann fits to the PA-V curves of (B–E). Data are expressed as mean ± SEM and where error bars are invisible, they are contained within the points. See also Figure S6.
Crosstalk between voltage and calcium-dependent gating in TMEM16A
To investigate the interaction between voltage and Ca2+ in the wild-type channel, we used an internal solution containing 400 nM Ca2+ to activate the channel and estimated the voltage-dependent PA as before, and found that the wild-type TMEM16A had a residual voltage dependence (Figures 6A and 6C). As in Q645A, WT TMEM16A showed differential gating effects for Cl− and I−, as external I− caused a desensitizing shift in PA (Figures 6A and 6C). We then examined how PA varied with Ca2+. Reducing intracellular Ca2+ to 200 nM caused a right-shift whereas increasing intracellular Ca2+ to 1500 nM led to a left-shift in PA (Figures 6B and 6C), suggesting that voltage and Ca2+ likely combine to determine the conformation of TM6.
Figure 6. Depolarization of TMEM16A channels causes a Ca2+-dependent stabilization of open conformation and slowing of deactivation kinetics.
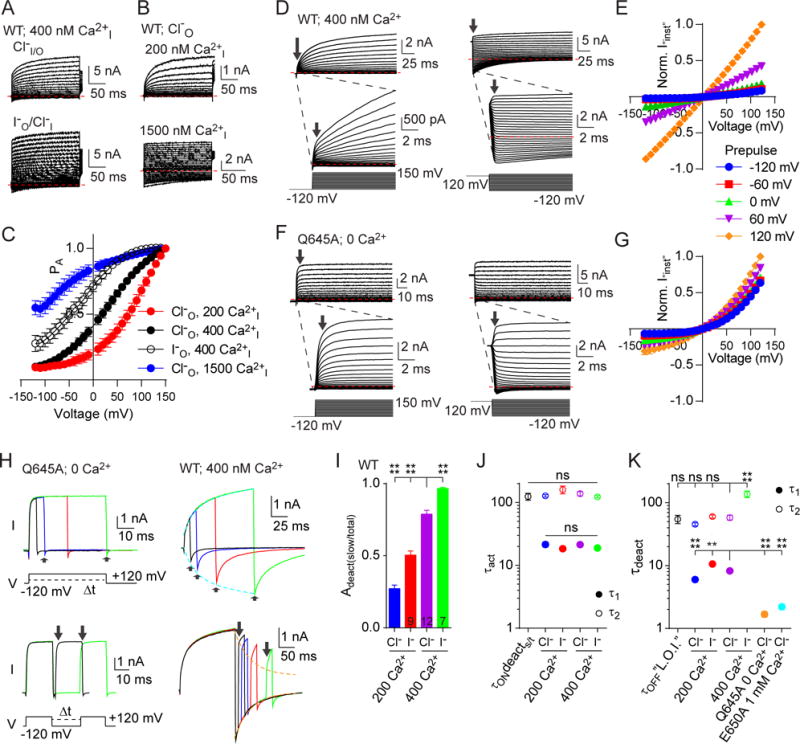
A. Representative traces of whole-cell patch clamp recordings of WT TMEM16A with 400 nM internal Ca2+ with external chloride (top) or iodide (bottom). B. Representative traces of whole-cell patch clamp recordings of WT TMEM16A with external chloride and 200 nM (top) or 1500 nM (bottom) internal Ca2+. In both A and B cells were stepped from −120 mV to +150 mV in 10 mV increments from a holding potential of −80 mV. C. Graph of PA-V for data represented in A and B, showing a progressive left shift in the voltage-dependence upon increasing internal concentration of Ca2+. n was 200 Ca2+ Cl−I, 5; 400 Ca2+ Cl−I, 5; 400 Ca2+ I−I, 8; 1500 Ca2+ Cl−I, 7. D. Wild-type TMEM16A with 400 nM internal Ca2+ voltage-clamped from a pre-pulse potential of −120 mV (left) or +120 mV (right). Inset shows current immediately after voltage steps. E. “Instantaneous” current amplitudes from wild-type at voltages from −120 to +120 after prepulses to the indicated voltages, normalized to amplitude at +120 mV, n = 5. F. Q645A with 0 internal Ca2+ stepped under voltage clamp from a pre-pulse potential of −120 mV (left) or +120 mV (right). Inset shows current immediately after voltage steps. G. “Instantaneous” current amplitudes from Q645A at voltages from −120 mV to +120 mV after prepulses to the indicated voltages, normalized to amplitude at +120 mV, n = 5 (see also Figure S7). H. Deactivation (top) and reactivation (bottom) time courses following activating and deactivating pulses of increasing duration to +120 mV and −120 mV, respectively, for Q645A with 0 Ca2+ (left) and WT with 400 nM internal Ca2+ (right). For WT, time constants of activation (cyan) and deactivation (orange) are overlaid with the onset of slow deactivation (top) and the decay of instantaneous current amplitude (bottom), respectively. I. Normalized amplitudes of the slow component of current deactivation compared to total for wild-type TMEM16A following 300 ms activating pulses to +120 mV, varying the concentration of intracellular Ca2+ and the species of extracellular permeant anion, as shown J. Slow and fast time constants of current activations for wild-type TMEM16A under the indicated conditions. Also shown is the time constant of onset of a slow component/total amplitude of deactivation during activations of increasing duration (τONdeacts/t) as indicated by arrows in panel E (top, right). K. Slow and fast time constants of current deactivations for wild-type TMEM16A under the indicated conditions. Also shown is the time constant of “loss of instantaneous” (L.O.I.) current, representing the recovery of the slowly activating current at +120 mV following deactivations of increasing duration at −120 mV as indicated by arrows in panel H (bottom, right), and the single exponential “fast” τ of deactivation for Q645A with 0 Ca2+ and E650A with 1 mM Ca2+ (see also Figure S7). n for data depicted in panels J and K was τONdeacts/t, 7; 200 Ca2+ Cl−I 200 Ca2+ I−I, 9; 400 Ca2+ Cl−I, 13; 400 Ca2+ I−I, 8; τOFF”L.O.I.”, 8; Q645A, 6; E650A, 6. Red dashed lines in panels A, B, D and F indicate 0 nA. All pooled data are expressed as mean ± SEM. See also Figure S7.
Having found that both voltage and Ca2+ play a role in TM6-dependent gating, we varied holding potentials and pulse durations to probe the time-dependence of gating effects in wild-type TMEM16A to ascertain how these two stimuli interact to produce the complex gating behavior. Notably, the wild-type channel exhibits a markedly biphasic activation upon depolarization, with an apparent “instantaneous” (Iinst) component followed by a second, more slowly activating component (Figure 6D). First, TMEM16A in whole cell clamp exposed to 400 nM intracellular Ca2+ was held at a series of prepulse voltages. We then stepped the membrane potential to a supraphysiological range in 10 mV intervals and compared the size of Iinst immediately following the voltage jumps. Only a small fraction of the current was activated very quickly from −120 mV (Figure 6D, left panel arrows): mean Iinst activated upon pulse to +120 mV was 0.09 ± 0.01 of the size of the steady state current at +120 mV, where the driving force for Cl− is the same size. As this Iinst activates upon depolarization, we propose that it represents a fraction of channels with a single Ca2+ ion bound that are closed but “primed” for activation upon depolarization. Following the step to +120 mV, activation to another open state with a slower time course can then proceed (see Figure 6D, inset). When these same cells were held at +120 mV prior to the voltage steps and then stepped from +120 mV back to −120 mV, the inward Iinst was 0.86 ± 0.02 the magnitude of the steady state current at +120 mV, demonstrating that prolonged activation at +120 mV allows a much larger inward Iinst current to be briefly observed following steps to negative potentials. Instantaneous current amplitudes from different prepulse holding potentials normalized against the baseline activation at +120 mV are shown in Figure 6E.
In contrast, when the same experiment is performed with the outwardly rectifying Q645A mutant in the absence of internal Ca2+, Iinst at +120 mV following a −120 mV prepulse was 0.65 ± 0.04 of the steady state at +120 mV (Figure 6F), while the inward Iinst amplitude at −120 mV following a +120 mV prepulse was 0.29 ± 0.05 of the magnitude at +120 mV. Thus, while Q645A channels can be more quickly activated from a −120 mV holding potential by depolarization, prolonged depolarization does not stabilize a conformation that allows for prolonged inward current (Figure 6G). Reasoning that this likely resulted from the absence of Ca2+ binding, we performed a similar analysis of Iinst using the Ca2+-binding mutant E650A, in the presence of 1 mM internal Ca2+. Under these conditions, E650A demonstrated Iinst of 0.80 ± 0.09 of the +120 mV steady state magnitude when pulsed from −120 mV, but only 0.21 ± 0.03 in the inward direction when pulsed to −120 mV from +120 mV, and indeed, the Iinst magnitude appeared identical at every pulse voltage independent of prepulse level (Figures S7A and S7B). We propose that E650A eliminates 1 of the 2 Ca2+-binding sites, and for the WT channel, initial Ca2+ binding influences TM6 to adopt a conformation that permits binding of the second Ca2+. Moreover, TM6 movement is voltage-dependent, and all three steps (first Ca2+ binding, TM6 movement, and second Ca2+ binding) are required for full activation.
Next, we probed the kinetics of activation and deactivation after prolonged periods of activation (at +120 mV) or deactivation (at −120 mV) (Figure 6H). We fit time constants to these time courses to estimate activation and deactivation rates (using equations 4.1 and 4.2 in STAR Methods), the onset of the slow component of deactivation (Figure 6H, top panels, arrows), and the loss of instantaneous current after activation (Figure 6H, bottom panels, arrows). We found that for Q645A with no internal Ca2+, Iinst remained constant following activation for different durations, and the time course of deactivation exhibits a single, “fast” exponential decay even after prolonged depolarizing pulses. In contrast, wild-type TMEM16A with 400 nM intracellular Ca2+ showed pronounced biphasic activation at +120 mV (Figure 6H, see also Figure 6D), and increasing the duration of this pulse before hyperpolarization to −120 mV increased the relative contribution of a more slowly deactivating component at −120 mV. Quantification of the fast and slow components of the deactivating current following a 300 ms pulse to +120 mV revealed that substituting Cl− with I− further increased the relative contribution of slow deactivation (Figure 6I). Conversely, reducing intracellular Ca2+ from 400 nM to 200 nM decreased the relative contribution of slow deactivation with either Cl− or I− as the external anion (Figure 6I). Thus, the rate of onset of this slow phase is dependent on both intracellular Ca2+ and extracellular anions. The non-Iinst components of current onset during depolarization were fit with double exponential time constants (τa1, fast; τa2; slow) for WT channels with 200 and 400 nM internal Ca2+ and with external Cl− and I−. The amplitude of the slowly deactivating component at −120 mV as a portion of the total initial current at −120 mV (τONdeacts/t) increased with the same time course as τa2 of current activation, which was insensitive to the change in internal Ca2+ or external anionic species (Figure 6J). Instead, the balance between the instantaneous and slow activation rates were affected by anions and Ca2+ (Figure 6I), suggesting that conformational changes in the protein, rather than the ion binding events, are likely rate limiting for full activation of the channel.
We also modeled channel deactivation from +120 mV to −120 mV with double exponentials (τd1, fast; τd2; slow) and compared them to the decay in the amplitude of the instantaneous current of a subsequent pulse to +120 mV following pulses with variable length to −120 mV (Figure 6H, lower panel, arrows; Figure 6K). We found that the time course of the “loss of instantaneous” (“L.O.I.”) current occurred with a τ similar to τd2. Slow deactivation (τd2), unlike for activation, appeared to be slowed by exchange of Cl− for I− (Figure 6K), suggesting hysteresis in the sequence of events leading to activation and anion permeation. We also noticed that the fast τd1 varied with both intracellular Ca2+ and the species of permeant anion; however, the contribution of this τ became negligible with longer activating pulses in wild-type (but not in Q645A with 0 Ca2+ or E650A with 1 mM Ca2+ where both τ of deactivation and its amplitude were unchanged by increasing prepulse duration) suggesting that it may represent deactivation from a conformation with only a single bound Ca2+ ion. Altogether, these results are consistent with a model where consecutive conformational changes in TM6 occur: occupancy of the first Ca2+ binding site leads to the outwardly rectifying conductance with fast kinetics while occupancy of the second Ca2+ binding site leads to the voltage-independent conductance with slow kinetics.
Discussion
Channel potentiation by Cl− or I− ions represents a positive feedback regulation of channel activity by permeant anions. Anion discrimination is especially relevant to TMEM16A function in the thyroid (Twyffels et al., 2014), where it allows for I− influx in the apex of the thyrocyte. Newly discovered roles for TMEM16A and the closely related TMEM16B in neurons also benefit from the complex gating apparatus of these channels. In thalamocortical neurons, which act as integrators of sensory input and relay information to the cortex, TMEM16B mediates spike frequency adaptation to allow neuronal self-inhibition (Ha et al., 2016), and the multi-phasic Ca2+ and voltage-dependent gating is ideally suited to allow it to do so. At low [Ca2+], CaCC channels do not conduct outward currents, so they do not contribute to the resting potential in most neurons. As [Ca2+] rises in the cell following action potential firing or excitatory synaptic inputs, Ca2+ binds to its first binding site “priming” the channel to be activated upon strong depolarization. This priming will not change the action potential threshold of the neuron. With depolarizing spikes, a small population of channels activate quickly to allow an inward flux of Cl− (outward current), and when the spike frequency increases, so does the influx of Ca2+, increasing the number of CaCC channels able to activate on the time scale of neuronal spiking and providing negative feedback against high frequency activation of mature central neurons. The identification of TM6 as a voltage and Ca2+-dependent gating element further improves the outlook for designing and understanding the pharmacological profiles of channel modulators. Several TMEM16A inhibitors have been identified, including ostensible pore blockers (Peters et al., 2015) as well as several with still unknown mechanisms of action (Namkung et al., 2011; Oh et al., 2013; Seo et al., 2016). However, binding sites for these drugs have not been mapped. Identifying a transmembrane segment linking permeation and gating would facilitate future development and improvement of compounds to influence TMEM16A activity for both in vitro studies and in vivo applications.
Based on results from several approaches presented in this study, we propose a model for how the molecular machinery involved produces synergistic channel gating interactions between internal Ca2+, external anions, and intrinsic components of the channel (Figure 7). In the absence of internal Ca2+, the wild-type channel is closed, but can bind Ca2+ ions. As [Ca2+] increases, association of one Ca2+ ion allows anions to enter the outer pore, and “primes” the channel to undergo a fast voltage-dependent conformational change involving TM6 to mediate anion conductance upon depolarization. Replacement of external Cl− with I− likely increases the dwell time and/or interaction of the anion in the outer pore to stabilize this conformation of TM6, thus favoring the subsequent voltage-dependent conformational changes at less depolarizing voltages. Depolarization allows the channel to enter its first open state with fast kinetics, and this state favors binding of a second Ca2+ ion. Association of a second Ca2+ ion results in the stabilization of the fully activated conformation of TM6, resulting in much slower deactivation kinetics and ostensibly Ohmic anion conductance. When I637 or Q645 was replaced with alanine, the conformational change normally associated with the first Ca2+ binding event could take place in the absence of divalent cations, allowing the channel to be opened to its first conductive conformation by depolarization alone (see Figures 3E–3G, 7B); however, these two mutations produce non-equivalent effects on gating and likely point to the existence of separable, sequential conformational changes in TM6 (Figure 7E), which are also strongly dependent on the properties of several other amino acids on TM6. Without Ca2+ binding, channels cannot enter the second open state, which requires bound Ca2+ to be stable, thus explaining the absence of the slower activating current and failure of these mutant channels to adopt an “Ohmic” conductance.
Figure 7. A dynamic interplay of Ca2+ and voltage controls TMEM16A gating.
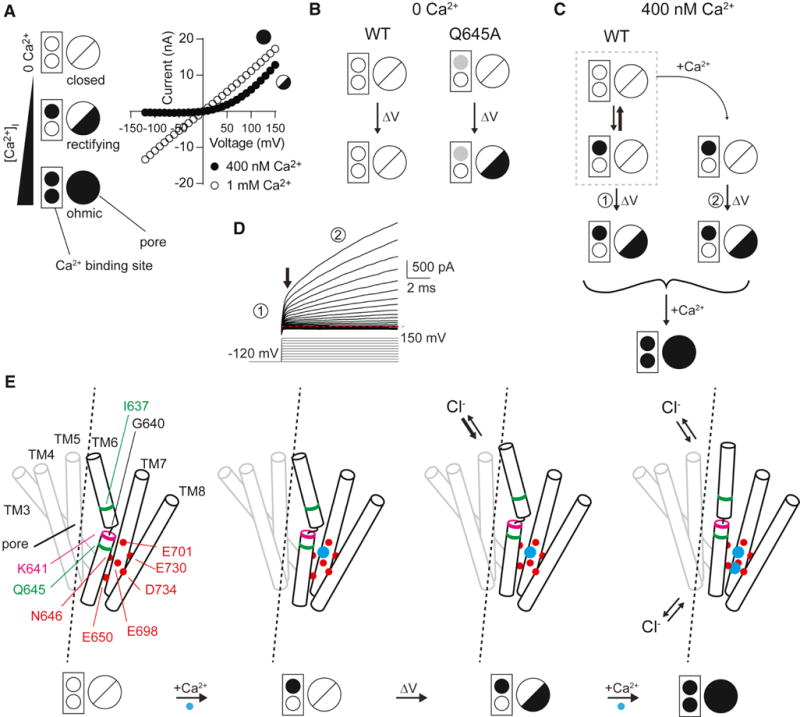
A. Left, a simplified model depicting changes to TMEM16A. Two circles within the box represent the two Ca2+ binding sites, with filled circles indicating occupancy by Ca2+. The larger circle represents the pore, with a line indicating a closed pore, half-filled circle for the outward-rectifying open state, and fully filled circle for the ‘Ohmic’ open state. Right, A sample steady-state I-V distinguishing the two open states for channels with single or double Ca2+ occupancy. B. A basic gating scheme for the WT and Q645A mutant TMEM16A under conditions of 0 Ca2+I. Left, the WT channel does not activate in response to voltage changes (up to +200 mV) without Ca2+ while the Q645A mutant (right), activates in response to membrane voltage potential changes as though with single Ca2+ occupancy, indicated by a gray filled circle. C. The WT channel, under conditions of moderate Ca2+ concentration, exists in equilibrium (gray dotted box) with the majority of channels not bound to Ca2+ and a small number bound to a single Ca2+. After depolarization, the few channels with single Ca2+ occupancy open quickly and allow anion flux. As time passes an increasing number of channels enter the single-Ca2+-bound state whereupon they can be opened by depolarization, which also favors the binding of the second Ca2+ ion, stabilizing the channel and leading to slowly activating current upon depolarization. With elevated Ca2+ levels, the channel can readily bind two Ca2+ ions and enter a non-rectifying ‘Ohmic’ open state. D. A sample trace illustrates different phases of TMEM16A conductance after depolarization under moderate Ca2+ levels. A small, rapid outward current (1) results from opening of channels with single Ca2+ occupancy while the slower increase (2 and 3) reflect the need for channels to first bind Ca2+ before entering an open state. E. A model of TM6 gating in response to Ca2+ and voltage changes. Green residues are those in TM6 critical for the Ca2+ requirement for activation, while magenta indicates K641. Red circles and red residues indicate the Ca2+-binding residues of TM6, 7, and 8. Blue circles are Ca2+ ions.
The idea that TM6 is a dynamic segment sensitive to external stimuli is consistent with previous results examining this region of the protein. TM6 had been predicted to form an external reentrant loop based on topology prediction algorithms (Yang et al., 2008), before studies using cysteine accessibility and cross-linking analysis refined the topology to show that TM6 indeed traversed the membrane (Yu et al., 2012; Tien et al., 2014). While the key residues highlighted in this study are well conserved with the closely related TMEM16B-CaCC, the conservation is poor for family members that are not Cl− channels (Figure 2A). However, the Ca2+-binding residues in TM6-8 are highly conserved, and our MD simulations of nhTMEM16, and the TMEM16A structures (Paulino et al., 2017; Dang et al., 2017) demonstrate a high likelihood that this portion of the structure adopts several stable conformations involving different packing of TM6 with the surrounding helices. Thus, the role of TM6 in transducing Ca2+-binding into protein conformational change is likely conserved. G640, a proposed hinge examined in this study, influences the interaction between Ca2+-binding and conformational changes in TM6 associated with voltage-dependent channel gating.
While we could identify an innate voltage-dependence to the channel by using site-directed mutagenesis to eliminate the requirement of Ca2+ for activation, the underlying source of the voltage-dependence is unclear. The slope of voltage dependence was shallow: for example the G(V) slope (k in equation 3 in STAR Methods) of Q645A was 39 ± 4 mV, corresponding to an apparent transferred gating charge of 0.65 ± 0.06 qe per subunit – much smaller than the 3–4 qe per subunit for voltage-gated ion channels (Zagotta et al., 1994). The charge may be carried by TM6 itself – K641, when mutated to alanine, did shift the “Boltzmann” component of gating both with and without internal Ca2+ – however, the mutant channel did retain underlying sensitivity to voltage, suggesting that other residues contribute to the gating charge. Of the side-chains predicted to coordinate Ca2+, five are acidic and may also be sensitive to voltage (Yu et al., 2012; Tien et al., 2014; Paulino et al., 2017; Dang et al., 2017). Moreover, 5 of the 6 Ca2+ coordinating side chains caused shifts in voltage-sensitivity when mutated in the Q645A background. However, as with K641 mutants, removal of one of these negative charges shifted, but did not abolish, voltage-dependence. Furthermore, the persistent ability of the more permeant I− to modify voltage-dependence suggests that anion presence in the permeation pathway may have a significant role in the conformational changes associated with gating.
In summary, we have determined that the 6th transmembrane segment, which harbors both pore lining residues and Ca2+ binding sites (Dang et al., 2017), represents a critical component of the TMEM16A gating mechanism. As other regions of the protein have also been implicated in regulating channel gating, including the N-terminus, the C-terminus, and several of the intracellular loops (Ferrera et al., 2009; Ferrera et al., 2011; Xiao et al., 2011), future studies will be necessary to elucidate how these regions may interact either directly or allosterically with the machinery described here. Since some members of the TMEM16 family show vastly different channel function and/or scramblase behavior dependent on structural motifs in the same region of the protein (Yang et al., 2012; Yu et al., 2015; Bethel and Grabe, 2016), testing for homologous regions in those proteins may help in developing a theory to explain the functional disparities between family members and to identify commonality in regulatory mechanisms.
STAR Methods text
CONTACT FOR REAGANT AND RESOURCE SHARING
Further information and requests for resources and reagents should be directed to and will be fulfilled by the Lead Contact, Lily Jan (lily.jan@ucsf.edu).
EXPERIMENTAL MODEL AND SUBJECT DETAILS
Cell lines
HEK293 cells (ATCC, RRID:CVCL_0045) were maintained at 37 °C and 5% CO2 in Dulbecco’s Modified Eagle’s Medium supplemented with 10% Fetal Bovine Serum and 1% penicillin/streptomycin, and were passaged upon reaching confluency (every 2–4 days) using 0.05% Trypsin-EDTA. These are a commercially available cell line and are authenticated by the manufacturer. Sex: female.
METHOD DETAILS
Molecular dynamics
Molecular dynamics simulations of nhTMEM16 were performed to predict regions of structural mobility in the protein. Modeller 9.15 (Sali and Blundell, 1993) was used to build in loops missing from the crystal structure (PDB: 4WIS). Using CHARMM-GUI (Lee et al., 2016), nhTMEM16 was embedded in a POPC bilayer. The entire system consisted of 356,426 atoms with 710 lipids. Simulations were run at constant pressure (1 bar) and temperature (303.15 K) using the CHARMM36 forcefield (Klauda et al., 2010). Using the CUDA enabled version of Amber (Case et al., 2005), eight parallel simulations were run for 400 ns each, yielding an aggregate simulation time of 3.2 μs.
Generation of cDNA reagents
TMEM16A (splice variant ‘a’) and TMEM16B clones from mus musculus (NCBI: NP_001229278.1,) in a pEGFP-N1 expression vector were used for all experiments. Single point mutations were introduced using Phusion polymerase for PCR, as instructed by the manufacturer, and mutagenic oligonucleotides were purchased from IDT-DNA Technologies (Iowa). Mutagenic primers consisted of reverse complimentary 33-mers centered upon the codon representing the targeted amino acid, whereupon nonsynonymous base pairs were introduced to the sequence by PCR. Mutant clones were confirmed by Sanger sequencing at Quintara Biosciences (South San Francisco, CA).
Transfection
24 hours before recording, cells were transiently transfected with TMEM16A constructs using Lipofectamine 2000 (Invitrogen), in antibiotic free media, as recommended by the manufacturer. On the morning before recording, cells were re-plated onto poly-L-lysine coated coverslips by dispersion with 0.05% trypsin followed by neutralization and dilution with bath medium. Cells were allowed to settle for at least 1 hour prior to recording.
Immunocytochemistry
To examine surface expression of TMEM16A-GFP mutants, transfected HEK293 cells were immunostained using a cell-surface marker and overlap of this marker with GFP. After a 24 hour transfection period, cells were fixed in 2% paraformaldehyde for 10 minutes on ice. Cells were washed two times in 1× Phosphate Buffered Saline (PBS), 10 minutes each. Cells were incubated in blocking solution with 1% heat inactivated goat serum and 1:150 wheat germ agglutinin (Vector Labs, Burlingame CA) for 1 hour at room temperature. Cells were then washed in 1× PBS three times, 10 minutes each. The coverslips with the cells were then mounted onto Fisher premium frosted microscope slides with DAPI Fluoromount-G (SouthernBiotech). Cells were visualized using a Leica SP8 confocal microscope at 63×. 30 μm thick Z-stacks were acquired.
Patch clamp electrophysiology
Patch pipettes
All electrophysiology experiments were performed using borosilicate glass purchased from Sutter Instrument Company (Novato, CA). Patch pipettes were pulled from 1.5/0.86 (OD/ID) glass and polished to 2–2.5 MΩ resistance (inside-out patch) or 3–5 MΩ (whole cell patch). Rapid solution exchange pipettes were pulled from Theta glass (Sutter) and manually broken to approximately 50 μM in diameter by scoring with a ceramic tile.
Solutions
For patch clamp electrophysiology, coverslips were transferred into a recording bath solution containing 140 mM NaCl, 10 mM Hepes and 5 mM EGTA, pH7.2/NMDG. All recordings were made at room temperature. Internal solutions containing buffered Ca2+ were made at pH 7.2 by combining Ca(OH)2 and EGTA to a ratio predicted by CaBuf software (KU Leuven) and then adding 140 mM NaCl or NMDG-Cl and 10 mM Hepes to the desired volume. Ca2+ concentrations were subsequently measured directly against calcium standards using a commercial Ca2+ buffer kit (Invitrogen) in a Fluo-8 or Fluo-8FF fluorescent assay in a BioTek Synergy H4 plate reader. Solutions containing free Ca2+ greater than 100 μM were made by adding CaCl directly to an EGTA-free version of our 140 mM NaCl solution, to the desired concentration. Solutions for biionic experiments were made by substituting the desired anions or cations for Na+ or Cl− in equimolar concentrations. Solution osmolality was adjusted to 305 ± 5 mOsm by addition of D-mannitol. All laboratory chemicals were purchased from Sigma-Aldrich, unless otherwise noted.
Data collection and equipment
Perfusion exchange was performed using a VM-8 perfusion apparatus with Octaflow software (ALA Scientific). Recordings were made using an Axon Instruments Multiclamp 700 with Digidata 1440, and were collected into pClamp10 software. All patch clamp seals were allowed to reach at least 3 GΩ resistance before patch rupture, but typical seal resistance usually exceeded 10 GΩ. All recordings were made using a 1M KCl agar bridge to prevent baseline fluctuation at the reference electrode.
Rapid solution exchange experiments used an Automate piezo driven exchanger with Theta-glass pipette applicators pulled from 1.5 mm OD Theta glass (Sutter Instrument). Data were collected at 10 kHz sampling rate and low pass filtered online at 2 kHz (biionic recordings), or at 100 kHz and filtered at 10 kHz, then reduced by a factor of 3, resulting in digitization at 33.3 kHz for non-stationary analysis recordings.
QUANTIFICATION AND STATISTICAL ANALYSIS
Patch clamp electrophysiology
Data analysis
All offline data analysis was performed using Graphpad Prism 6, Clampfit 10 and Microsoft Excel. Concentration-dependence curves for Ca2+ or permeant anions (X-) were generated by fitting data to an equation of the form:
| Equation 1 |
where I/IMAX denotes current normalized to the maximum amplitude in the highest [Ca2+] or [X- ] tested, KD denotes the dissociation constant for that ion and nH denotes the Hill coefficient.
Voltage-dependence of EC50 values for gating by extracellular anions were calculated by fitting data to an equation of the form:
| Equation 2 |
Normalized conductances were parsed by dividing the resulting zδ values from the overall G(V) relationship to reveal Boltzmann shaped residual curves, which were fit to voltage-dependent gating data using an equation of the form:
| Equation 3 |
where V1/2 represents the voltage where half of the channels are active, and k represents a slope factor for the sigmoidal curve.
To quantify the time courses of channel activation and deactivation, voltage clamp traces were fit with single or double exponential curves with equations of forms, respectively:
| Equation 4.1 |
or
| Equation 4.2 |
Single channel conductance was estimated using non-stationary fluctuation analysis of current traces by plotting signal variance against amplitude and fitting a polynomial function:
| Equation 5 |
where σ2 denotes signal variance, I denotes macroscopic current, i denotes single-channel current and n the number of channels in the patch. Single channel conductance (γ) was calculated by dividing i by (Vm-ERev) for Cl− ions. Outlying values for signal variance (ie: system noise vs. channel noise) were identified and eliminated by iteratively calculating standard deviation across samples at each time point and eliminating values larger than 4 S.D. from the mean after each calculation until an unchanging value for variance was reached, as has been described (Heinemann and Conti, 1992). Permeability ratios were determined from biionic conditions using a reduced form of the Goldman-Hodgkin-Katz voltage equation:
| Equation 6 |
where z represents the valence of the anion, PX represents relative permeability of ion species “X” and F, R and T have their usual thermodynamic meanings.
Sequence alignments were performed using Clustal Omega and visually rendered in BoxShade via the ExPasy web portal.
Statistical analysis
Statistical analysis employed Student’s T-tests for single comparisons, or one-way ANOVA followed by Bonferroni post-hoc tests for statistical significance for multiple comparisons. All “center” values from fit curves represent the means of those parameters fit to the individual data, and all data where curves could be unambiguously fit in Graphpad were included, except where sigmoidal fits estimated a halfway point that fell outside the minimal or maximal values of the independent variable used to generate the data. To increase statistical power and avoid error due to multiple comparisons, data for individual constructs under given recording conditions were pooled for analysis, and a single ANOVA statistical test with posthoc analysis performed for any comparisons involving those datasets. For individual constructs, comparison of conductance in Cl− vs I− containing solutions were made using Student’s T-test, but no dataset was subjected to T-test more than once. P < 0.01 was used as a threshold for significance, and all values in text, and all data presented in summary graphs, are cited or shown as mean ± S.E.M. n represents the number of individual cells or patches used in recordings, and is displayed either in summary graphs where possible, or in the figure legends where summary graphs are not shown or where display of n in figure would be aesthetically impractical. **, *** and **** represent p < 0.01, p < 0.001 or p < 0.0001 levels of significance, respectively.
Immunocytochemistry
Image files were deconvolved using AutoQuantX3. Deconvolved images were analyzed for colocalization using ImarisColoc. Pearson's correlation coefficients were determined between TMEM16A and WGA, with the membrane of TMEM16A-transfected cells identified as the region of interest. Statistical significance was determined using 1-way ANOVA analysis followed by Bonferroni’s post-hoc test for significance. P < 0.01 was used as a threshold for significance, and all values in text, and data are shown as mean ± S.E.M. n represents the number of individual cells used and is displayed in summary graph. **, *** and **** represent p < 0.01, p < 0.001 or p < 0.0001 levels of significance, respectively.
KEY RESOURCES TABLE
A Key Resources Table is attached separately to this submission.
| REAGENT or RESOURCE | SOURCE | IDENTIFIER |
|---|---|---|
| Antibodies | ||
| Rhodamine-Wheat germ agglutinin | Vector Laboratories | Z0109 |
| Bacterial and Virus Strains | ||
| Eschericia coli: DH5α strain, subcloning efficiency | Original: Invitrogen, maintained in house | Cat#18265017 |
| Biological Samples | ||
| Chemicals, Peptides, and Recombinant Proteins | ||
| Salts, acids, bases, chelators for recording solutions | Sigma-Aldrich | stock |
| D-Mannitol | Sigma-Aldrich | stock |
| Fluo 8-Potassium salt | AAT-Bioquest | Cat#20189 |
| Fluo 8FF-Potassium salt | AAT-Bioquest | Cat#21102 |
| Critical Commercial Assays | ||
| Ca2+ Calibration Buffer Kit #2 | Molecular Probes | Cat#3009 |
| Deposited Data | ||
| Experimental Models: Cell Lines | ||
| Human: HEK293 cells | ATCC | RRID: CVCL_0045 |
| Experimental Models: Organisms/Strains | ||
| Oligonucleotides | ||
| Mutagenic primers for PCR | IDT-DNA Technologies | Custom-made, described in STAR Methods |
| Recombinant DNA | ||
| pEGFP-N1-TMEM16A from Mus musculus (previously generated in our lab) | Tien et al., 2013 | N/A |
| pEGFP-N1-TMEM16B from Mus musculus (previously generated in our lab) | Tien et al., 2013 | N/A |
| Software and Algorithms | ||
| WEBMAXC-chelation prediction software | Chris Patton, Stanford | http://maxchelator.stanford.edu/webmaxc/webmaxcE.htm |
| Clustal Omega sequence alignment software | European Bioinformatics Institute | https://www.ebi.ac.uk/Tools/msa/clustalo/ |
| Boxshade multiple alignment software | K. Hofmann and M. Baron | https://www.ch.embnet.org/software/BOX_form.html |
| The PyMOL Molecular Graphics System, Version 2.0 | Schrödinger, LLC | http://www.pymol.org |
| PClamp10 software suite | Molecular Devices | N/A |
| Graphpad PRISM 6 | Graphpad Software, Inc. | N/A |
| AutoQuantX3 | Bitplane | N/A |
| ImarisColoc | Bitplane | N/A |
| Amber 14 | Case et al., 2005 | http://ambermd.org/ |
| MODELLER 9.15 | Sali and Blundell, 1993 | https://salilab.org/modeller/9.15/release.html |
| CHARMM-GUI | Lee et al., 2016 | http://www.charmm-gui.org/ |
| matplotlib | J. Hunter | https://matplotlib.org/ |
| Visual molecular dynamics | NIH Center for Macromolecular Modeling & Bioinformatics | http://www.ks.uiuc.edu/Research/vmd/ |
| Other | ||
| Borosilicate thick wall glass 1.5 OD/0.86 ID | Sutter Instrument | BF150-86-10 |
| Borosilicate theta glass 1.5 OD | Sutter Instrument | BT-150-10 |
Supplementary Material
Highlights.
-
-
TMEM16A is an ion channel gated by voltage, external anions and internal calcium
-
-
Alanine scanning mutagenesis permits these gating modes to be analyzed individually
-
-
The 6th transmembrane helix has a critical role in linking TMEM16A gating modes
Acknowledgments
We would like to thank Huanghe Yang, Zhiqiang Yan and Wei Zhang for helpful comments on the manuscript. C.J.P. is supported by NIH grant K99DA041500. N.P.B and M.G. are supported by NIH Grants R01GM117593, R01GM089740, and T32EB009389. L.Y.J. is supported by NIH grant R01NS069229. Simulations were carried out with the support of Grant MCB-80011 from the Extreme Science and Engineering Discovery Environment. Y.N.J. and L.Y.J. are Howard Hughes Medical Institute investigators.
Footnotes
Publisher's Disclaimer: This is a PDF file of an unedited manuscript that has been accepted for publication. As a service to our customers we are providing this early version of the manuscript. The manuscript will undergo copyediting, typesetting, and review of the resulting proof before it is published in its final citable form. Please note that during the production process errors may be discovered which could affect the content, and all legal disclaimers that apply to the journal pertain.
Author Contributions
Conceptualization, C.J.P., J.T. and L.Y.J.; Methodology, C.J.P., N.P.B., M.G.; Investigation, C.J.P., J.M.G., J.T., L.Q., N.P.B., T.C., L.W.; Formal Analysis, C.J.P., J.M.G., L.Q., N.P.B.; Writing-Original Draft, C.J.P., L.Y.J.; Writing-Review & Editing, C.J.P., J.M.G., Y.N.J., L.Y.J.; Visualization, C.J.P., J.M.G., N.P.B.; Funding Acquisition, L.Y.J.; Resources, Y.N.J., M.G., L.Y.J.; Supervision, M.G., L.Y.J.
Declaration of Interests
The authors report no competing interests.
References
- Ardeleanu C, Arsene D, Hinescu M, Andrei F, Gutu D, Luca L, Popescu LM. Pancreatic expression of DOG1: a novel gastrointestinal stromal tumor (GIST) biomarker. Appl Immunohistochem Mol Morphol. 2009;17:413–418. doi: 10.1097/PAI.0b013e31819e4dc5. [DOI] [PubMed] [Google Scholar]
- Bethel NP, Grabe M. Atomistic insight into lipid translocation by a TMEM16 scramblase. Proc Natl Acad Sci U S A. 2016;113:14049–14054. doi: 10.1073/pnas.1607574113. [DOI] [PMC free article] [PubMed] [Google Scholar]
- Brunner JD, Lim NK, Schenck S, Duerst A, Dutzler R. X-ray structure of a calcium-activated TMEM16 lipid scramblase. Nature. 2014;516:207–212. doi: 10.1038/nature13984. [DOI] [PubMed] [Google Scholar]
- Caputo A, Caci E, Ferrera L, Pedemonte N, Barsanti C, Sondo E, Pfeffer U, Ravazzolo R, Zegarra-Moran O, Galietta L. TMEM16A, a membrane protein associated with calcium-dependent chloride channel activity. Science. 2008;322:590–594. doi: 10.1126/science.1163518. [DOI] [PubMed] [Google Scholar]
- Case DA, Cheatham TE, 3rd, Darden T, Gohlke H, Luo R, Merz KM, Jr, Onufriev A, Simmerling C, Wang B, Woods RJ. The Amber biomolecular simulation programs. J Comput Chem. 2005;26:1668–1688. doi: 10.1002/jcc.20290. [DOI] [PMC free article] [PubMed] [Google Scholar]
- Cho H, Yang YD, Lee J, Lee B, Kim T, Jang Y, Back SK, Na HS, Harfe BD, Wang F, et al. The calcium-activated chloride channel anoctamin 1 acts as a heat sensor in nociceptive neurons. Nat Neurosci. 2012;15:1015–1021. doi: 10.1038/nn.3111. [DOI] [PubMed] [Google Scholar]
- Contreras-Vite JA, Cruz-Rangel S, De Jesus-Perez JJ, Figueroa IA, Rodriguez-Menchaca AA, Perez-Cornejo P, Hartzell HC, Arreola J. Revealing the activation pathway for TMEM16A chloride channels from macroscopic currents and kinetic models. Pflugers Arch. 2016;468:1241–1257. doi: 10.1007/s00424-016-1830-9. [DOI] [PMC free article] [PubMed] [Google Scholar]
- Cruz-Rangel S, De Jesus-Perez JJ, Arechiga-Figueroa IA, Rodriguez-Menchaca AA, Perez-Cornejo P, Hartzell HC, Arreola J. Extracellular protons enable activation of the calcium-dependent chloride channel TMEM16A. J Physiol. 2017;595:1515–1531. doi: 10.1113/JP273111. [DOI] [PMC free article] [PubMed] [Google Scholar]
- Dang S, Feng S, Tien J, Peters CJ, Bulkley D, Lolicato M, Zhao J, Qi L, Chen T, Jan YN, Minor DL, Jr, Cheng Y, Jan LY. Electron cryo-microscopy structures of the TMEM16A calcium-activated chloride channel. Nature. 2017;552:426–429. doi: 10.1038/nature25024. [DOI] [PMC free article] [PubMed] [Google Scholar]
- Davis AJ, Forrest AS, Jepps TA, Valencik ML, Wiwchar M, Singer CA, Sones WR, Greenwood IA, Leblanc N. Expression profile and protein translation of TMEM16A in murine smooth muscle. Am J Physiol Cell Physiol. 2010;299:C948–959. doi: 10.1152/ajpcell.00018.2010. [DOI] [PMC free article] [PubMed] [Google Scholar]
- Ding S, Ingleby L, Ahern CA, Horn R. Investigating the putative glycine hinge in Shaker potassium channel. J Gen Physiol. 2005;126:213–226. doi: 10.1085/jgp.200509287. [DOI] [PMC free article] [PubMed] [Google Scholar]
- Duvvuri U, Shiwarski DJ, Xiao D, Bertrand C, Huang X, Edinger RS, Rock JR, Harfe BD, Henson BJ, Kunzelmann K, et al. TMEM16A induces MAPK and contributes directly to tumorigenesis and cancer progression. Cancer Res. 2012;72:3270–3281. doi: 10.1158/0008-5472.CAN-12-0475-T. [DOI] [PMC free article] [PubMed] [Google Scholar]
- Ferrera L, Caputo A, Ubby I, Bussani E, Zegarra-Moran O, Ravazzolo R, Pagani F, Galietta L. Regulation of TMEM16A chloride channel properties by alternative splicing. J Biol Chem. 2009;284:33360–33368. doi: 10.1074/jbc.M109.046607. [DOI] [PMC free article] [PubMed] [Google Scholar]
- Ferrera L, Scudieri P, Sondo E, Caputo A, Caci E, Zegarra-Moran O, Ravazzolo R, Galietta LJ. A minimal isoform of the TMEM16A protein associated with chloride channel activity. Biochim Biophys Acta. 2011;1808:2214–2223. doi: 10.1016/j.bbamem.2011.05.017. [DOI] [PMC free article] [PubMed] [Google Scholar]
- Ha GE, Lee J, Kwak H, Song K, Kwon J, Jung SY, Hong J, Chang GE, Hwang EM, Shin HS, et al. The Ca2+-activated chloride channel anoctamin-2 mediates spike-frequency adaptation and regulates sensory transmission in thalamocortical neurons. Nat Commun. 2016;7:13791. doi: 10.1038/ncomms13791. [DOI] [PMC free article] [PubMed] [Google Scholar]
- Heinemann SH, Conti F. Nonstationary noise analysis and application to patch clamp recordings. Methods Enzymol. 1992;207:131–148. doi: 10.1016/0076-6879(92)07009-d. [DOI] [PubMed] [Google Scholar]
- Huang F, Rock J, Harfe B, Cheng T, Huang X, Jan Y, Jan L. Studies on expression and function of the TMEM16A calcium-activated chloride channel. Proc Natl Acad Sci U S A. 2009;106:21413–21418. doi: 10.1073/pnas.0911935106. [DOI] [PMC free article] [PubMed] [Google Scholar]
- Huang F, Zhang H, Wu M, Yang H, Kudo M, Peters CJ, Woodruff PG, Solberg OD, Donne ML, Huang X, et al. Calcium-activated chloride channel TMEM16A modulates mucin secretion and airway smooth muscle contraction. Proc Natl Acad Sci U S A. 2012;109:16354–16359. doi: 10.1073/pnas.1214596109. [DOI] [PMC free article] [PubMed] [Google Scholar]
- Jeng G, Aggarwal M, Yu WP, Chen TY. Independent activation of distinct pores in dimeric TMEM16A channels. J Gen Physiol. 2016;148:393–404. doi: 10.1085/jgp.201611651. [DOI] [PMC free article] [PubMed] [Google Scholar]
- Jiang Y, Lee A, Chen J, Cadene M, Chait BT, MacKinnon R. The open pore conformation of potassium channels. Nature. 2002;417:523–526. doi: 10.1038/417523a. [DOI] [PubMed] [Google Scholar]
- Klauda JB, Venable RM, Freites JA, O'Connor JW, Tobias DJ, Mondragon-Ramirez C, Vorobyov I, MacKerell AD, Jr, Pastor RW. Update of the CHARMM all-atom additive force field for lipids: validation on six lipid types. J Phys Chem B. 2010;114:7830–7843. doi: 10.1021/jp101759q. [DOI] [PMC free article] [PubMed] [Google Scholar]
- Lee J, Cheng X, Swails JM, Yeom MS, Eastman PK, Lemkul JA, Wei S, Buckner J, Jeong JC, Qi Y, et al. CHARMM-GUI Input Generator for NAMD, GROMACS, AMBER, OpenMM, and CHARMM/OpenMM Simulations Using the CHARMM36 Additive Force Field. J Chem Theory Comput. 2016;12:405–413. doi: 10.1021/acs.jctc.5b00935. [DOI] [PMC free article] [PubMed] [Google Scholar]
- Lim NK, Lam AK, Dutzler R. Independent activation of ion conduction pores in the double-barreled calcium-activated chloride channel TMEM16A. J Gen Physiol. 2016;148:375–392. doi: 10.1085/jgp.201611650. [DOI] [PMC free article] [PubMed] [Google Scholar]
- Manoury B, Tamuleviciute A, Tammaro P. TMEM16A/anoctamin 1 protein mediates calcium-activated chloride currents in pulmonary arterial smooth muscle cells. J Physiol. 2010;588:2305–2314. doi: 10.1113/jphysiol.2010.189506. [DOI] [PMC free article] [PubMed] [Google Scholar]
- Namkung W, Phuan PW, Verkman AS. TMEM16A inhibitors reveal TMEM16A as a minor component of calcium-activated chloride channel conductance in airway and intestinal epithelial cells. J Biol Chem. 2011;286:2365–2374. doi: 10.1074/jbc.M110.175109. [DOI] [PMC free article] [PubMed] [Google Scholar]
- Ni YL, Kuan AS, Chen TY. Activation and Inhibition of TMEM16A Calcium-Activated Chloride Channels. PLoS One. 2014;9:e86734. doi: 10.1371/journal.pone.0086734. [DOI] [PMC free article] [PubMed] [Google Scholar]
- Oh SJ, Hwang SJ, Jung J, Yu K, Kim J, Choi JY, Hartzell HC, Roh EJ, Lee CJ. MONNA, a potent and selective blocker for transmembrane protein with unknown function 16/anoctamin-1. Mol Pharmacol. 2013;84:726–735. doi: 10.1124/mol.113.087502. [DOI] [PMC free article] [PubMed] [Google Scholar]
- Paulino C, Kalienkova V, Lam KM, Neldner Y, Dutzler R. Activation mechanism of the calcium-activated chloride channel TMEM16A revealed by cryo-EM. Nature. 2017;552:421–425. doi: 10.1038/nature24652. [DOI] [PubMed] [Google Scholar]
- Pei J, Kim BH, Grishin NV. PROMALS3D: a tool for multiple protein sequence and structure alignments. Nucleic Acids Res. 2008;36:2295–2300. doi: 10.1093/nar/gkn072. [DOI] [PMC free article] [PubMed] [Google Scholar]
- Perez-Cornejo P, De Santiago JA, Arreola J. Permeant anions control gating of calcium-dependent chloride channels. J Membr Biol. 2004;198:125–133. doi: 10.1007/s00232-004-0659-x. [DOI] [PubMed] [Google Scholar]
- Peters CJ, Yu H, Tien J, Jan YN, Li M, Jan LY. Four basic residues critical for the ion selectivity and pore blocker sensitivity of TMEM16A calcium-activated chloride channels. Proc Natl Acad Sci U S A. 2015;112:3547–3552. doi: 10.1073/pnas.1502291112. [DOI] [PMC free article] [PubMed] [Google Scholar]
- Sali A, Blundell TL. Comparative protein modelling by satisfaction of spatial restraints. J Mol Biol. 1993;234:779–815. doi: 10.1006/jmbi.1993.1626. [DOI] [PubMed] [Google Scholar]
- Schroeder BC, Cheng T, Jan YN, Jan LY. Expression cloning of TMEM16A as a calcium-activated chloride channel subunit. Cell. 2008;134:1019–1029. doi: 10.1016/j.cell.2008.09.003. [DOI] [PMC free article] [PubMed] [Google Scholar]
- Seo Y, Lee HK, Park J, Jeon DK, Jo S, Jo M, Namkung W. Ani9, A Novel Potent Small-Molecule ANO1 Inhibitor with Negligible Effect on ANO2. PLoS One. 2016;11:e0155771. doi: 10.1371/journal.pone.0155771. [DOI] [PMC free article] [PubMed] [Google Scholar]
- Shen MY, Sali A. Statistical potential for assessment and prediction of protein structures. Protein Sci. 2006;15:2507–2524. doi: 10.1110/ps.062416606. [DOI] [PMC free article] [PubMed] [Google Scholar]
- Ta CM, Adomaviciene A, Rorsman NJ, Garnett H, Tammaro P. Mechanism of allosteric activation of TMEM16A/ANO1 channels by a commonly used chloride channel blocker. Br J Pharmacol. 2016;173:511–528. doi: 10.1111/bph.13381. [DOI] [PMC free article] [PubMed] [Google Scholar]
- Tien J, Lee HY, Minor DJ, Jan YN, Jan LY. Identification of a dimerization domain in the TMEM16A calcium-activated chloride channel (CaCC) Proc Natl Acad Sci U S A. 2013;110:6352–6357. doi: 10.1073/pnas.1303672110. [DOI] [PMC free article] [PubMed] [Google Scholar]
- Tien J, Peters CJ, Wong XM, Cheng T, Jan YN, Jan LY, Yang H. A comprehensive search for calcium binding sites critical for TMEM16A calcium-activated chloride channel activity. Elife. 2014;3:e02772. doi: 10.7554/eLife.02772. [DOI] [PMC free article] [PubMed] [Google Scholar]
- Twyffels L, Strickaert A, Virreira M, Massart C, Van Sande J, Wauquier C, Beauwens R, Dumont JE, Galietta LJ, Boom A, et al. Anoctamin-1/TMEM16A is the major apical iodide channel of the thyrocyte. Am J Physiol Cell Physiol. 2014;307:C1102–1112. doi: 10.1152/ajpcell.00126.2014. [DOI] [PubMed] [Google Scholar]
- Xiao Q, Yu K, Perez-Cornejo P, Cui Y, Arreola J, Hartzell HC. Voltage- and calcium-dependent gating of TMEM16A/Ano1 chloride channels are physically coupled by the first intracellular loop. Proc Natl Acad Sci U S A. 2011;108:8891–8896. doi: 10.1073/pnas.1102147108. [DOI] [PMC free article] [PubMed] [Google Scholar]
- Yang H, Kim A, David T, Palmer D, Jin T, Tien J, Huang F, Cheng T, Coughlin SR, Jan YN, et al. TMEM16F forms a Ca2+-activated cation channel required for lipid scrambling in platelets during blood coagulation. Cell. 2012;151:111–122. doi: 10.1016/j.cell.2012.07.036. [DOI] [PMC free article] [PubMed] [Google Scholar]
- Yang YD, Cho H, Koo JY, Tak MH, Cho Y, Shim WS, Park SP, Lee J, Lee B, Kim BM, et al. TMEM16A confers receptor-activated calcium-dependent chloride conductance. Nature. 2008;455:1210–1215. doi: 10.1038/nature07313. [DOI] [PubMed] [Google Scholar]
- Yu K, Duran C, Qu Z, Cui YY, Hartzell HC. Explaining calcium-dependent gating of anoctamin-1 chloride channels requires a revised topology. Circ Res. 2012;110:990–999. doi: 10.1161/CIRCRESAHA.112.264440. [DOI] [PMC free article] [PubMed] [Google Scholar]
- Yu K, Whitlock JM, Lee K, Ortlund EA, Cui YY, Hartzell HC. Identification of a lipid scrambling domain in ANO6/TMEM16F. Elife. 2015;4:e06901. doi: 10.7554/eLife.06901. [DOI] [PMC free article] [PubMed] [Google Scholar]
- Zagotta WN, Hoshi T, Dittman J, Aldrich RW. Shaker potassium channel gating. II: Transitions in the activation pathway J Gen Physiol. 1994;103:279–319. doi: 10.1085/jgp.103.2.279. [DOI] [PMC free article] [PubMed] [Google Scholar]
Associated Data
This section collects any data citations, data availability statements, or supplementary materials included in this article.