

SUMMARY
N6-methyladenosine (m6A), the most prevalent internal modification in eukaryotic messenger RNAs (mRNAs), plays critical roles in many bioprocesses. However, its functions in normal and malignant hematopoiesis remain elusive. Here we report METTL14, a key component of the m6A methyltransferase complex, is highly expressed in normal hematopoietic stem/progenitor cells (HSPCs) and acute myeloid leukemia (AML) cells carrying t(11q23), t(15;17), or t(8;21), and is down-regulated during myeloid differentiation. Silencing of METTL14 promotes terminal myeloid differentiation of normal HSPCs and AML cells, and inhibits AML cell survival/proliferation. METTL14 is required for development/maintenance of AML and self-renewal of leukemia stem/initiation cells (LSCs/LICs). Mechanistically, METTL14 exerts its oncogenic role by regulating its mRNA targets (e.g., MYB and MYC) through m6A modification, while itself is negatively regulated by SPI1. Collectively, our results reveal the SPI1⊣METTL14-MYB/MYC signaling axis in myelopoiesis and leukemogenesis, and highlight the critical roles of METTL14 and m6A modification in normal and malignant hematopoiesis.
ETOC BLURB
The role of N6-methyladenosine (m6A) modification in normal and malignant hematopoiesis remains elusive. Weng et al. report the essential role of METTL14, a key component of the m6A methyltransferase complex, in self-renewal and differentiation of hematopoietic/leukemic stem cells and reveal the SPI1⊣METTL14-MYB/MYC signaling axis in myelopoiesis and leukemogenesis.
INTRODUCTION
Hematopoiesis is a tightly regulated process during which mature blood cells are produced from a small pool of multipotent hematopoietic stem cells (HSCs). In particular, the differentiation of HSCs into myeloid progenitors and eventually mature myeloid cells, a process known as myelopoiesis, involves the actions of master transcription factors (TFs) that specify and re-enforce each cell fate decision. For instance, PU.1 (SPI1, the product of the oncogene SPI1), a transcriptional master regulator of myeloid cells, plays an essential role in generating early myeloid progenitors (i.e., common myeloid progenitors, CMPs), while the basic-region leucine zipper transcription factor C/EBPα is required for the production of granulocyte/macrophage progenitors (GMPs) from CMPs (Dakic et al., 2005; Rosenbauer and Tenen, 2007). Dysregulation of myelopoiesis results in the development of diseases such as acute myeloid leukemia (AML), a clonal hematopoietic disorder where a stem cell-like self-renewal capacity is gained and the differentiation capacity is blocked (Testa, 2011). Accumulating evidence has demonstrated the roles of oncogenic proteins in inducing myeloid differentiation block in the development of AML, as exemplified by oncogenic fusion proteins such as MLL-fusions (t(11q23)), AML1-ETO (t(8;21)), PML-RARα (t(15;17)), and CBFβ-MYH11 (inv16) (Look, 1997; Rosenbauer and Tenen, 2007). Other well-known oncogenic TFs, such as MYB and MYC, have also been shown to contribute to AML development by inhibiting differentiation and promoting self-renewal of AML cells (Wall et al., 2008; Zhao et al., 2014). Such findings have led to the exploration and development of differentiation-inducing agents (e.g., all-trans retinoic acid (ATRA)) targeting the oncogenic proteins to cure AML.
Recent studies have shown that chemical modifications on RNA, similar to those in its DNA and histone counterparts, contribute to gene expression control. Among over 150 modified RNA nucleotide variants identified, N6-methyladenosine (m6A) modification is the most prevalent chemical mark in eukaryotic mRNAs, which is reversible (Jia et al., 2011) and affects more than 7,000 mRNAs in individual transcriptomes of mammalian cells (Dominissini et al., 2012; Meyer et al., 2012). This modification was found on adenosines embedded in the consensus sequence G[G>A]m6AC[U>A>C] across the mRNA transcripts, especially near the stop codons (Fu et al., 2014). Accumulating evidence has shown that m6A modifications in mRNAs or non-coding RNAs influence RNA fate and functions and are critical for most bioprocesses including tissue development, circadian rhythm, DNA damage response, sex determination, and tumorigenesis (Deng et al., 2017).
The m6A modification is deposited to RNAs by the m6A methyltransferase (writer) complex, a protein complex formed by the methyltransferase-like 3 (METTL3)/methyltransferase-like 14 (METTL14) heterodimeric catalytic core and a regulatory subunit, Wilms’ tumour 1-associating protein (WTAP) (Bokar et al., 1997; Liu et al., 2014; Ping et al., 2014; Wang et al., 2014). While METTL3 possesses the active methyltransferase domain that catalyzes the conversion of adenosine (A) to m6A, METTL14 functions as an essential component to support METTL3 in recognizing RNA substrates, and thus the METTL3–METTL14 heterodimer is required for the methylation activity (Sledz and Jinek, 2016; Wang et al., 2016a; Wang et al., 2016b). Research on the role of m6A modifications and the m6A machinery in cancers, including leukemia, is still in its infancy.
Here we report that METTL14 plays a critical role in normal hematopoiesis and AML pathogenesis by fine-tuning the expression of its critical targets such as MYB and MYC through m6A-based post-transcriptional regulation.
RESULTS
METTL14 is highly expressed in HSPCs and down-regulated during normal myelopoiesis
We first examined the expression patterns of known m6A writers (i.e., Mettl3, Mettl14, and Wtap) and erasers (i.e., Fto and Alkbh5) in different populations of mouse bone marrow (BM) cells. A significant lower levels of Mettl14 and Fto mRNAs were observed in the c-Kit− proportion compared to the corresponding c-Kit+ stem/progenitor counterpart in BM cells of wild-type C57BL/6 (CD45.2) mice, whereas no significant change was found for Mettl3, Wtap or Alkbh5 (Figure 1A). Notably, the global m6A level on mRNAs was also decreased in c-Kit− cells relative to c-Kit+ cells (Figure 1B). Thus, the decreased m6A level in more matured hematopoietic cells (Figure 1B) is likely due to the downregulation of Mettl14 (Figures 1A and S1A). Further examination of Mettl14 in HSC and progenitor cells revealed that Mettl14 is expressed at a high level in HSC and Lin− Sca-1+ c-Kit+ (LSK) cells, and is markedly down-regulated in hematopoietic progenitor cells (HPCs, Lin− Sca-1− c-Kit+) and CMPs, but not in megakaryocyte-erythroid progenitors (MEPs); its expression is further down-regulated in GMP and myeloid cells (Mac-1+/Gr-1+) (Figure 1C). Similar results were observed in BM of wild-type B6.SJL (CD45.1) mice (Figure S1B), suggesting that the downregulation of Mettl14 in committed or differentiated myeloid-lineage cells is common. Furthermore, we induced differentiation of mouse HSPCs in vitro using the OP9-coculture system (Holmes and Zuniga-Pflucker, 2009). After 5 days of coculture, most of the HSPCs differentiated toward myeloid lineage (Figure 1D) but not B or T lineage (Figure S1C), and Mettl14 expression was dramatically decreased at both RNA and protein levels (Figure 1E). These data together indicate that the expression of Mettl14 as well as the m6A level is down-regulated during myeloid differentiation.
Figure 1. Impact of METTL14 on normal myeloid differentiation.

(A,B) Expression of individual m6A modifiers (A) and global m6A levels in mRNA (B) in c-Kit+ and c-Kit− BM cells from wildtype C57BL/6 mice (n=3), as detected by qPCR and LC-MS/MS, respectively.
(C) Relative expression of Mettl14 in different sub-populations of BM cells from wildtype C57BL/6 mice as detected by qPCR. Expression of Mettl14 in HPCs was set as 1.
(D) C57BL/6 Lin− HSPCs were co-cultured with OP9 cells in vitro for 5 days and subjected to flow cytometric analysis.
(E) OP9 co-cultured cells were subjected to qPCR (left) and western blot (right) analysis for the expression of Mettl14.
(F) Schematic diagram showing the procedure of inducing human CD34+ HSPCs toward monocyte/macrophage differentiation. Note that the day when M-CSF was first added to induce differentiation was set as day 0.
(G) qPCR showing changes of METTL14, CD11b, CSF1R, and GATA1 during differentiation in the control (shNS) and METTL14-depleted (shM14-#2) groups.
(H) Western blot showing expression changes of METTL14 during differentiation. Signal of METTL14 was quantified and normalized to that of GAPDH.
(I) In vitro induced human CD34+ cells were stained at the indicated time points and subjected to flow cytometric analysis (left). Wright-Giemsa staining of cells collected at day 11 was shown on right.
(J) In vivo competition assays.
Mean±SD values are shown for Figures 1A, B, C, E (left panel), G, and J. *, p < 0.05; **, p <0.01; ***, p < 0.001; N.S., non-significant; t-test. See also Figure S1.
We next conducted loss-of-function studies in human CD34+ HSPCs to investigate the role of METTL14 in HSPC differentiation. CD34+ HSPCs were transduced with pLKO.1-based lentiviral shRNA targeting human METTL14 (shM14) or pLKO.1-scrambled shRNA (shNS) and induced towards monocyte/macrophage differentiation (Figure 1F). Knockdown of METTL14 in normal CD34+ cells showed only slight effect on cell growth and apoptosis, though with a more noticeable effect on their colony-forming ability (Figures S1D–F). As expected, endogenous expression of METTL14 was gradually down-regulated during normal myelopoiesis in the control group and further decreased when METTL14 was knocked down (Figures 1G, 1H and S1G, S1H). An acceleration in monocytic differentiation was observed upon METTL14 silencing (Figures 1I and S1I). In addition, expression of CD11b and CSF1R, genes encoding markers for monocyte and macrophage differentiation, were upregulated during normal monocytic differentiation which was further enhanced upon METTL14 depletion (Figures 1G and S1G). Opposite changes were observed for GATA1 (Figures 1G and S1G), which was reported to inhibit monocyte differentiation (Tanaka et al., 2000).
By utilizing Mettl14fl/fl-CREERT conditional knockout (Mettl14-cKO) mice in which Mettl14 could be depleted upon 4-OHT or tamoxifen (TAM) treatment in vitro or in vivo (Figures S1J–M), we found a moderate increase in white blood cell (WBC) count and myeloid cells over 16 weeks after TAM treatment, although not always statistically significant (Figure S1N). Further, to evaluate the impact of Mettl14 on the functional capacity of HSCs in vivo, we conducted competitive repopulation assays (Figure S1O). As shown in Figure 1J, TAM-induced deletion of Mettl14 in recipient mice resulted in a mild but significant decline in the ratio of CD45.2+ (Mettl14-cKO) cells vs. CD45.1+CD45.2+ (competitor) cells in peripheral blood (PB), suggesting a partial inhibition of HSC self-renewal activity in vivo upon Mettl14 depletion.
Collectively, METTL14 expression is down-regulated during myelopoiesis and its knockdown further substantially promotes differentiation of HSPCs towards myeloid cells, implying that METTL14 plays a role in inhibiting normal myelopoiesis.
METTL14 is aberrantly expressed in AML cells and inhibited by differentiation agents
Analysis of the Cancer Genome Atlas (TCGA) data revealed that AML has a higher level of METTL14 expression than the vast majority of other cancer types (Figure S2A). We showed that METTL14 was expressed at a significantly higher level in BM mononuclear cells (MNCs) of primary AML patients carrying common chromosomal translocations (e.g., t(8;21), t(15;17) and t(11q23)), except for inv(16), than in the healthy donors (Figure 2A). Consistently, METTL14 is also expressed at a higher level in human leukemia cell lines than in normal MNCs, or CD34+ or CD34− MNCs, of healthy donors (Figure 2B).
Figure 2. METTL14 expression is upregulated in AML and negatively regulated by SPI1.

(A) Expression levels of METTL14 in primary AML patients with various chromosomal translocations relative to that in BM mononuclear cells (MNCs) from healthy donors (NC) as detected by qPCR.
(B) qPCR showing expression of METTL14 in leukemia cell lines as compared to MNCs or different fractions (CD34+ and CD34−) of MNCs from healthy donors.
(C) Lin− BM of wildtype mice were transduced with MSCVneo empty vector or AML fusion genes and seeded for CFA assays. Cells were harvested after two rounds of plating and subjected to qPCR analysis for expression of Mettl14 and Mettl3.
(D) Change of METTL14 expression (upper) and global m6A level (lower) in NB4 cells after treatment with 500 nM ATRA for 72 hours or 0.5 ng/mL PMA for 48 hours as compared to DMSO-treated cells as detected by qPCR and LC-MS/MS, respectively.
(E,F) MM6 cells (E) and CD34+ HSPCs (F) were transduced with shRNAs targeting SPI1 or SPI1 overexpression vector and subjected to western blot analysis (upper) and qPCR analysis (lower).
(G) ChIP-qPCR assays showing direct binding of SPI1 on METTL14 promoter. Five potential binding sites upstream of the transcription start site (TSS, indicated as 0) and one downstream of TSS were predicted by JASPAR. The regions containing these sites for qPCR were shown. NC, negative control site.
(H,I) Expression of SPI1 in BM MNCs from healthy donors (NC) or primary AML patients with various chromosomal translocations as detected by qPCR (H), and the Pearson correlation of SPI1 with METTL14 in expression across these samples (I).
Mean±SD values are shown (except for Figures 2E (upper panel), F (upper panel), and I). *, p < 0.05; **, p <0.01; ***, p < 0.001; t-test. See also Figure S2.
Consistently, we found a higher expression of METTL14, as well as METTL3, in mouse BM progenitor cells immortalized by oncogenic fusion genes including MLL-fusions (MLL-AF9, MLL-AF10, and MLL-ENL), PML-RARa (a t(15;17) fusion gene), and AML1-ETO9a (a truncated but more potent oncogenic isoform of AML1-ETO, a t(8;21) fusion gene) (Figures 2C and S2B). In addition, in the murine leukemic cell line MLL-ENL-ERtm that carries tamoxifen-inducible MLL-ENL (Zeisig et al., 2004), Mettl14 expression was gradually and dramatically decreased over time after withdrawal of 4-Hydroxy-tamoxifen (4-OHT) (Figure S2C). Such data suggest that METTL14 expression is affected by these AML-associated fusion proteins directly or indirectly.
Notably, when human AML cells were treated with differentiation-inducing agents, such as ATRA or phorbol-12-myristate-13-acetate (PMA), a decrease in METTL14 level as well as global m6A level was observed (Figure 2D), similar to the pattern in normal myelopoiesis (Figure 1). Thus, the downregulation of METTL14 is a common event in the myeloid differentiation of both normal HSPCs and AML cells.
METTL14 expression is negatively regulated by SPI1
To identify TFs that directly regulate METTL14 expression, we analyzed the ENCODE ChIP-seq data in ChIPBase (Yang et al., 2013) and found that hematopoietic TFs including CEBPB, GABPA, ELF1, CEBPA, and SPI1 have binding sites within 5 Kb upstream of the transcription start site (TSS) of METTL14. Among them, GABPA and ELF1 showed a significant positive correlation, whereas SPI1 showed a significant negative correlation, with METTL14 in expression across AML patient samples (n=166) from TCGA (Ley et al., 2013) as well as normal BM samples in GSE24006 dataset (n=31) or blood tissues (n=444) from the Genotype-Tissue Expression Project (GTEx) (Figure S2D). Knockdown of SPI1 resulted in consistent upregulation of METTL14 in both MONOMAC-6 (MM6) and NB4 AML cells, which carry t(9;11) and t(15;17), respectively, whereas no consistent patterns were observed in these two cell lines when GABPA or ELF1 was knocked down (Figures S2E and S2F). By utilizing two individual shRNAs against SPI1, we showed that knockdown of SPI1 resulted in an increase of METTL14 at both mRNA and protein levels in human AML cells and normal CD34+ HSPCs (Figures 2E and 2F). Conversely, overexpression of SPI1 decreased METTL14 expression in these cells (Figures 2E and 2F). Thus, SPI1 is likely a negative regulator of METTL14 in AML cells. In contrast, no binding sites for SPI1 were found within 5 Kb upstream of TSS of METTL3.
Six potential binding sites of SPI1 were predicted within 5 Kb upstream or in the vicinity of the TSS of METTL14 by JASPAR. Chromatin immunoprecipitation (ChIP)-qPCR assays demonstrated that SPI1 has a significant enrichment on 5 of the 6 sites over normal IgG control (Figure 2G), indicating a direct binding. Luciferase reporter assays showed a significant decrease of reporter expression upon insertion of site 3 sequence into the promoter region as compared to the empty vector or vector with mutant site 3 sequence where the putative SPI1 binding motif was completely destroyed (Figure S2G). This reduction of luciferase expression was abrogated when SPI1 was silenced (Figure S2G), supporting a SPI1-dependent negative regulation on gene expression. In addition, SPI1 exhibited a significant lower expression in primary AML samples with t(8;21), t(15;17), and t(11q23) translocations than in healthy donors (Figure 2H), and showed a negative correlation with METTL14 in expression in these samples (Figure 2I). Moreover, Spi1 was down-regulated in mouse BM progenitor cells transduced with AML-associated fusion genes (Figure S2H). During myeloid differentiation of normal HSPCs and AML cells, SPI1 is gradually and significantly up-regulated (Figures S2I and S2J), in a manner opposite to METTL14 (Figures 1G and 2D). Together, these data suggest that SPI1 is a direct negative regulator of METTL14 expression in both normal and malignant hematopoietic cells.
METTL14 is required for AML development/maintenance and LSC/LIC self-renewal
Colony-forming/replating assays (CFA) were then conducted to evaluate the potential role of Mettl14 in cell transformation mediated by AML-associated fusion genes. Conditional ablation of Mettl14 by 4-OHT treatment dramatically impaired cell transforming ability of all the oncogenic fusion genes tested (Figure 3A). Similar to the genetic knockout, silencing of Mettl14 by shRNAs (Figure S3A) also significantly disrupted MA9-induced cell immortalization in vitro (Figure S3B). Conversely, ectopic expression of wild-type (METTL14-WT), but not mutated METTL14 (METTL14-R298P; R298 is critical for target recognition of the methyltransferase complex (Wang et al., 2016a; Wang et al., 2016b)), substantially increased global m6A level and promoted cell immortalization mediated by MA9 (Figures 3B and 3C), suggesting the effect of METTL14 on cell transformation relies on its role as a RNA methylation modifier.
Figure 3. METTL14 plays a critical role in AML development and maintenance.

(A) Lin− BM cells from Mettl14fl/fl-CREERT mice were transduced with MSCVneo-MLL-AF9 (MA9), -MLL-AF10 (MA10), or -AML1-ETO9a (AE9a) retroviruses and seeded onto methylcellulose medium for CFA assays. 4-OHT at a final concentration of 1 µM was added to the methylcellulose medium at the first round of plating. N.D., non-detectable.
(B) Lin− BM cells from wildtype CD45.1 mice were transduced with MSCVneo-MLL-AF9 (MA9) plus MSCV-PIG (PIG), MSCV-PIG-METTL14-WT (M14-WT), or MSCV-PIG-METTL14-R298P (M14-R298P) retroviruses, and seeded for CFA assays.
(C) Cells collected from the 2nd round of plating in Figure 3B were subjected to mRNA extraction following by LC-MS/MS for detection of global m6A changes.
(D) Kaplan–Meier curves showing the effect of METTL14 knockout on MLL-AF9-induced primary leukemogenesis. BMT recipient mice were treated with vehicle (CT) or tamoxifen (TAM) for five consecutive days as indicated with arrows.
(E) Wright–Giemsa staining of peripheral blood (PB) and BM, and hematoxylin and eosin (H&E) staining of spleen (SP) and liver (LV) of the primary fl/fl BMT recipient mice at the end point. Bar= 20 µm (for PB and BM) or 200 µm (for SP and LV).
(F) LC-MS/MS detection of global m6A changes in mRNA of BM cells (a mixture of fully or partially Mettl14 depleted AML cells and normal BM cells) isolated from fl/fl recipient mice in Figure 3D.
(G) Percentage of LSK cells in the BM of primary leukemic fl/fl BMT mice treated with vehicle (CT) or tamoxifen (TAM) as determined by flow cytometry.
(H) CFA assays of BM cells harvested from primary leukemic fl/fl BMT mice (2 mice/group). Representative images of the colonies after the first round of plating were displayed on top, while the numbers of colonies were shown at the bottom.
(I) Limiting dilution assays using BM leukemia cells from primary fl/fl BMT mice. The estimated LSC/LIC frequency was shown on the plot. Dose, number of donor cells; tested, total number of mice used as BMT recipients in the assay; response, mice developed leukemia within 4 weeks post BMT.
(J) BM cells from MA9, AE9a, and PML-RARa leukemia mice were transduced with Mettl14 shRNAs and subjected to CFA assays.
(K) Kaplan–Meier curves showing the effect of Mettl14 knockdown on the maintenance/progression of MA9-induced AML in secondary BMT recipient mice.
(L,M) Effect of Mettl14 knockout on the progression of MA9-induced AML in secondary BMT recipient mice. Recipient mice were divided randomly into two groups and treated with vehicle (CT) or tamoxifen (TAM) at the indicated time points (see arrows). Kaplan–Meier curves were shown in (L). Wright-Giemsa stained PB and BM, and H&E stained spleen and liver of the secondary BMT recipient mice at the end point were shown in (M). Bar= 20 µm (for PB and BM) or 200 µm (for SP and LV).
Mean±SD values are shown for Figures 3A, B, C, F, G, H (lower panel), and J. *, p < 0.05; **, p <0.01; ***, p < 0.001; N.S., non-significant; t-test (for Figures 3B, 3G, 3H, and 3J) or log-rank test (for Figures 3D, 3I, and 3L). See also Figure S3.
To assess the role of Mettl14 in leukemogenesis in vivo, we transplanted lethally irradiated recipient mice with MA9-transduced Lin− BM HSPCs from Mettl14fl/fl-CREERT (fl/fl) mice or wildtype (WT) mice (Figure S3C). In agreement with the in vitro data, induced deletion of Mettl14 in vivo by tamoxifen (TAM) significantly delayed leukemia onset and prolonged the survival of primary BMT receipient mice (fl/fl, Figure 3D). In contrast, TAM treatment of receipients transplanted with MA9-transduced wild-type cells showed no effect on survival (WT, Figure 3D). In addition, Mettl14 depletion led to decreased immature blast cell population in both PB and BM, as well as a reduction of leukemia cell infiltration and disruption of organ architecture in spleen and liver (Figure 3E). A reduction in both WBC count and spleen weight index was observed in the fl/fl-TAM mice compared to the control group was observed (Figure S3D). As expected, BM cells from the TAM-treated fl/fl Mett114 mice (TAM) exhibited lower levels of global m6A than those from vehicle-treated mice (CT) (Figure 3F).
While most of the BM cells in both TAM- and vehicle (CT)-treated fl/fl groups showed a strong signal of the myeloid marker Mac-1, the c-Kit+ and the LSK populations were markedly decreased in the Mettl14-depleted group (Figures 3G and S3E–F). CFA assays of BM leukemic cells from the primary fl/fl BMT recipient mice showed smaller and reduced colonies in the TAM-treated group than in the control group (Figure 3H), demonstrating impaired proliferation potential of leukemia cells when Mettl14 was depleted. To directly evaluate the effect of Mettl14 depletion on the frequency of leukemia stem/initiating cells (LSCs/LICs), we conducted limiting dilution assays. As expected, the estimated LSC/LIC frequency of the Mettl14 knockout group (TAM) is significantly lower (p <0.01) than that of the control group (1/3,218 vs. 1/433) (Figure 3I).
To determine whether Mettl14 is also required for leukemia maintenance, we performed CFA assays with leukemic BM cells collected from primary AML mice. As expected, Mettl14 knockdown significantly inhibited colony-forming/replating capacity of various AML cells (Figure 3J). Secondary BMT assay with colony cells from the first round of plating further demonstrated that knockdown of Mettl14 significantly inhibited progression of MA9-induced AML in secondary recipients (Figure 3K). Similarly, TAM-induced Mettl14 depletion in secondary recipients transplanted with BM cells from Mettl14fl/fl-CREERT+MA9 primary leukemic mice (as illustrated in Figure S3C) led to a dramatically prolonged survival (Figure 3L) and largely normal morphologies in PB, BM, spleen and liver tissues (Figure 3M), as well as a significant reduction in WBC and spleen weight index (Figure S3G).
METTL14 depletion inhibits human AML cell survival/growth and promotes myeloid differentiation
We next studied the function of METTL14 in human AML cells. METTL14 depletion by shRNAs resulted in a substantial inhibition of cell grow/proliferation and a significant induction of apoptosis in both MM6 and NB4 AML cells (Figures 4A and S4A). Conversely, ectopic expression of METTL14-WT, but not METTL14-R298P mutant, promoted growth of human AML cells (Figure 4B). Moreover, knockdown of METTL14 greatly promoted terminal myeloid differentiation of AML cells (Figures 4C–D). Similarly, knockdown of METTL14 led to cell growth inhibition and induction of apoptosis and differentiation in primary leukemic blasts (CD34+) from three AML patients (Figures 4E–F and S4B–C). Our in vivo studies showed that knockdown of METTL14 significantly inhibited progression of human AML cells and substantially prolonged survival in xeno-transplantation recipient mice (Figures 4G–H), associated with remarkably reduced tumor burden (Figure 4I).
Figure 4. METTL14 blocks myeloid differentiation of human AML cells.

(A,B) Effect of METTL14 knockdown (A) or overexpression (B) on AML cell growth/proliferation was analyzed. The knockdown efficiency of shRNAs were confirmed by western blot and shown on the left (A).
(C,D) Flow cytometric analysis of CD11b+ and/or CD14+ cell populations (C) or Wright-Giemsa staining of cytospin slides (D). Arrows indicate differentiated cells. Bar= 20 µm.
(E,F) Effects of METTL14 knockdown on cell proliferation (E) and differentiation (F) of leukemia blasts (CD34+) from 3 primary AML patients.
(G–I) Effects of METTL14 knockdown on progression of human AML cells in NSGS (Wunderlich et al., 2010) mice. MM6 cells were transduced with shMT14-#2 or scramble shRNA. After selected with puromycin for two passages, cells were injected into NSGS mice (0.3×10⁶ cells/mouse) via tail vein. Kaplan–Meier curves were shown in (G), engraftment of MM6 cells in BM and PB of NSGS mice was shown in (H), while representative images of liver tissues were shown in (I).
(J) MM6 and NB4 cells with or without METTL14 knockdown were treated with DMSO or ATRA (100 nM) for 72 hours and subjected to flow cytometric analysis. The percentages of each cell population were summarized on right.
(K) AML cells were transduced with empty vector or METTL14 overexpression vectors and treated with ATRA (20 nmol/L for 24 hours for NB4, 200 nmol/L for 48 hours for U937) before subjected to flow cytometric analysis. Percentages of cells with CD11b staining in each group were shown.
*, p < 0.05; **, p <0.01; ***, p < 0.001; t-test (for Figures 4A, 4B, 4C, 4E, 4F, and 4K; Mean±SD values are shown) or log-rank test (for Figure 4G). See also Figure S4.
Since knockdown of METTL14 promotes terminal differentiation of AML cells, we also tested whether depleting METTL14 expression can further sensitize AML cells to differentiation-inducing agents. As expected, depletion of METTL14 greatly increased CD11b+ population of human AML cells in the presence of ATRA (Figure 4J) or PMA (Figure S4D), as compared to the control (shNS) group. Conversely, overexpression of METTL14 significantly inhibits ATRA-induced myeloid differentiation, as compared to overexpression of METTL14-R298P or empty vector (Figure 4K).
Identification of METTL14 targets by high-throughput RNA-seq and m6A-seq
We then conducted RNA-seq and m6A-seq assays in MM6 and NB4 cells to identify METTL14 targets. RNA-seq revealed that 560 genes were significantly down-regulated while 377 genes were significantly up-regulated (p<0.05; fold change ≥1.2) upon METTL14 knockdown in both cell lines (Figure 5A). Gene set enrichment analysis (GSEA) revealed an enrichment of genes down-regulated in hematopoietic/leukemic stem cells as well as MYB-downregulated targets in knockdown cells relative to control cells (Figure S5A). In agreement, RT-qPCR confirmed the downregulation and upregulation of a set of reported positive and negative targets of MYB, respectively, in MM6 cells upon METTL14 knockdown (Figure S5B).
Figure 5. Transcriptome-wide identification of METTL14 targets.

(A) Venn diagram showing numbers of genes with significant changes in expression (p<0.05; fold change ≥1.2) upon METTL14 knockdown.
(B) Expression changes of mRNA transcripts with decreased m6A abundance (m6A-hypo) upon METTL14 knockdown in METTL14 silenced (shM14-#1 and shM14-#2) cells relative to control cells. Note that the fold changes (FC) were log2 transformed.
(C) The m6A abundances on MYB and MYC mRNA transcripts in METTL14-knockdown and control MM6 and NB4 cells as detected by m6A-seq. Solid triangles indicate regions for qPCR in (D) and (E).
(D) Reduction of m6A modification in specific regions of MYB and MYC transcripts upon METTL14 knockdown as tested by gene-specific m6A-qPCR assay in MM6 cells.
(E) CLIP-qPCR showing the association of MYB and MYC transcripts with METTL14 in MM6 cells.
(F) qPCR (upper) and western blot (lower) showing decrease of MYB and MYC expression after knockdown of METTL14 in AML cell lines.
(G) qPCR (left) and western blot (right) showing increase of MYB and MYC expression in U937 cells with ectopic expression of wildtype (M14-WT) but not mutated (M14-R298P) METTL14.
(H,I) Gene-specific m6A-qPCR (H) and qPCR/western blot (I) showing decrease of m6A modification in specific region of Myb or Myc transcripts and expression changes of Myb or Myc mRNA/protein, respectively, in c-Kit+ BM of Mettl14fl/fl-CREERT mice treated with TAM (KO) as compared to those treated with oil (CT).
(J) Expression changes of Myb and Myc mRNA in c-Kit+ BM of leukemic fl/fl BMT mice from Figure 3D.
(K) Dual luciferase reporter assays showing the effect of METTL14 on MYB/MYC reporters with either wild-type or mutated m6A sites.
Mean±SD values are shown for Figures 5D–K. *, p < 0.05; **, p <0.01; ***, p < 0.001; t-test. See also Figure S5.
More than 16,675 and 18,831 m6A peaks were identified from m6A-seq libraries generated from MM6 and NB4 cells, respectively, which correspond with 8,246 and 9,632 transcripts. Consistent with previous studies (Chen et al., 2015; Dominissini et al., 2012), the most common m6A motif GGAC is significantly (p <1e−134 for MM6, p <1e-186 for NB4) enriched in the m6A peaks (Figure S5C) and the m6A peaks are especially enriched in the vicinity of the stop codon (Figures S5D and S5E).
Considering the role of METTL14 in the m6A writer complex, only m6A peaks with decreased abundance (termed as m6A-hypo peaks) upon METTL14 knockdown were considered as authentic m6A peaks. As shown in Figure S5F, 1,368 and 934 genes in METTL14 knockdown (i.e., shM14-#1 and shM14-#2) MM6 cells and 2,220 and 2,875 genes in METTL14 knockdown NB4 cells carry one or more m6A-hypo peaks (diff p <0.01), which were thereafter termed m6A-hypo genes. Among these genes, 676 were shared between MM6 and NB4 cells. Notably, the vast majority of m6A-hypo genes (88.0%–92.8% for MM6, 69.9%–78.1% for NB4) are associated with down-regulated mRNA levels in METTL14 knockdown cells (Figures 5B and S5F).
As our m6A mapping method has relatively lower resolution than the recently developed miCLIP (Linder et al., 2015) and may not resolve m6A from m6Am, a unique sub-form of m6A that is found only on the first nucleotide following the 7-methylguanosine cap of certain mRNAs, we analyzed the percentage of m6A-hypo peaks in the 5' end (150 nt from TSS) of 5' UTR. Only a small portion (5.13% ~ 7.48%) of the (m6A-)hypo peaks are located within this region (Figure S5G). Nevertheless, METTL3–METTL14 complex does not mediate the cap m6Am methylation (Mauer et al., 2017). Thus, even the small portion of m6A-hypo peak changes in the 5' end may not be related to 5' cap m6Am. Overall, it is internal m6A, not 5' cap m6Am, accounts for the mRNA methylation changes upon METTL14 knockdown.
MYB and MYC are direct targets of METTL14
Interestingly, the MYB signaling is a major pathway affected by METTL14 knockdown (Figures S5A and S5B). In particular, the m6A abundances of MYB and MYC were markedly decreased upon METTL14 knockdown as shown by m6A-seq and gene-specific m6A-qPCR (Figures 5C–D), suggesting they are potential targets of METTL14. In addition, crosslinking-immunoprecipitation (CLIP) assays demonstrated the direct binding of METTL14 to MYB and MYC transcripts (Figure 5E). Moreover, METTL14 knockdown in AML cells led to a significant decrease of MYB and MYC (Figure 5F), while overexpression of wild-type, but not mutated, METTL14, resulted in a significant upregulation of MYB and MYC (Figure 5G).
Similar to the data obtained from human cell lines, TAM-induced deletion of Mettl14 in Mettl14-cKO mice led to a reduction of m6A modification on Myb and Myc transcripts in c-Kit+ HSPCs (Figure 5H) and resulted in a decreased expression of both genes (Figure 5I). In c-Kit+ BM cells of primary BMT recipients, Myb and Myc were also found to be down-regulated in the Mettl14-depleted mice compared to the control mice (Figure 5J). These data strongly support MYB and MYC as bona fide targets of METTL14.
To confirm that the regulation of MYB and MYC by METTL14 indeed relies on the methylation on their mRNA transcripts, we created reporter constructs with wildtype (WT) MYB/MYC 3' coding sequence or corresponding mutant (mut) sequence (Figure S5H). Dual luciferase assays showed that wild-type, but not mutated, METTL14, significantly promoted luciferase activity in reporters carrying WT MYB or MYC fragment (Figure 5K); such an increase was completely abrogated when the m6A consensuses were mutated (Figure 5K), suggesting an m6A-dependent regulation.
METTL14 regulates mRNA stability and translation of MYB and MYC
It has been shown that m6A marks on mRNA transcripts affect mRNA stability and translation (Li et al., 2017; Wang et al., 2015a). To investigate whether METTL14 regulates MYB and MYC expression through modulating their mRNA stability, we treated control or METTL14 knockdown MM6 cells with the transcription inhibitor actinomycin D (Act D) and detected the half-lives of MYB and MYC transcripts. Indeed, knockdown of METTL14 resulted in a noticeable decrease in the half-lives of MYB (4.65 h to 3.1–3.2 h) and MYC (0.64 h to 0.51–0.52 h) transcripts (Figure 6A). Meanwhile, CLIP of eukaryotic translation initiation factor 3 subunit A (EIF3A) in MM6 cells demonstrated less binding of EIF3A to MYB and MYC transcripts when METTL14 was knocked down (Figure 6B).Furthermore, ribosome profiling showed that knockdown of METTL14 resulted in a decrease of MYB and MYC mRNA in the translating pool (Figure 6C, fractions 11–18), suggesting that METTL14 also has an impact on the translation of its target genes.
Figure 6. METTL14 regulates mRNA stability and translation of MYB and MYC.

(A) The mRNA half-life (t1/2) of MYB or MYC transcripts in MM6 cells with (shM14-#1 or shM14-#2) or without (shNS) METTL14 depletion.
(B) CLIP-qPCR showing decreased association of EIF3A with MYB and MYC transcripts in MM6 cells with (shM14-#1 or shM14-#2) or without (shNS) METTL14 depletion.
(C) Ribosome profiling assays. Fractionations of MM6 cell lysates were shown on top. RNAs in different fractions of ribosome were extracted and subjected to qPCR analysis and shown at the bottom.
Mean±SD values are shown for Figures 6A–C. *, p < 0.05; **, p <0.01; ***, p < 0.001; t-test. See also Figure S6.
The effect of m6A modification on mRNA transcripts is mediated by specific m6A binding proteins known as m6A readers. YT521-B homology domain family (YTHDF) proteins are the first characterized readers of m6A, which regulate mRNA stability and translation (Shi et al., 2017; Wang et al., 2015a). During differentiation of normal HSPCs and drug-induced differentiation of AML cells, no consistent pattern was observed for each individual YTHDF genes (Figures S6A–C). In addition, when we silenced individual YTHDF genes in MM6 cells (Figure S6D), no obvious reduction of MYB and MYC, either at the mRNA level or protein level (Figures S6E–F), was observed. Thus, the regulation of METTL14 on mRNA stability and translation of its target genes is unlikely to be mediated by YTHDF proteins.
MYB and MYC are functionally essential targets of METTL14 in AML
When we transfected human AML cells with siRNA pools targeting MYB or MYC, a significant inhibition on cell growth/proliferation (Figures 7A and S7A) and an induction of apoptosis (Figure S7B) and terminal myeloid differentiation (Figure 7B) were observed, similar to METTL14 knockdown. Furthermore, ectopic expression of MYB and MYC in leukemic BM cells collected from the Mettl14fl/fl-MA9 primary BMT mice (i.e., the fl/fl-CT group in Figure 3D) partially restored the self-renewal ability of the cells in the presence of 4-OHT (i.e., under Mettl14 depletion) (Figure 7C). In human MM6 AML cells, ectopic expression of MYB and MYC greatly prevented myeloid differentiation mediated by METTL14 knockdown (Figures 7D–F). Taken together, our results demonstrated that MYB and MYC are functionally important targets of METTL14 and are essential for METTL14-mediated block of myeloid differentiation and promotion of AML cell survival/proliferation.
Figure 7. MYB and MYC are critical targets of METTL14 that mediates myeloid differentiation block and AML cell proliferation.

(A, B) Effect of MYB or MYC silencing on cell growth (A) and differentiation (B) of AML cell lines.
(C) BM leukemic cells from the fl/fl-CT primary BMT mice were transduced with pmiRA1 empty vector or MYB or MYC expression vector and seeded for colony-forming assay with or without 4-OHT (1 µM). Colony numbers were counted and compared.
(D) MM6 cells were transduced with shNS or shM14-#2, and with or without MYB or MYC encoding lentivirus as indicated. Western blots showing knockdown of METTL14 as well as ectopic expression of MYB or MYC in the corresponding groups.
(E) MYB or MYC overexpression rescues terminal myeloid differentiation of MM6 cells induced by METTL14 knockdown. Representative images of flow cytometric analysis of CD11b and CD14 staining were shown on left and the mean percentages of each population were shown on right.
(F) Wright-Giemsa staining of MM6 cells showing reduced differentiation in cells with MYB (shM14+MYB) or MYC (shM14+MYC) overexpression as compared to those with empty vector (shM14+vector) when METTL14 was knocked down. Bar= 20 µm.
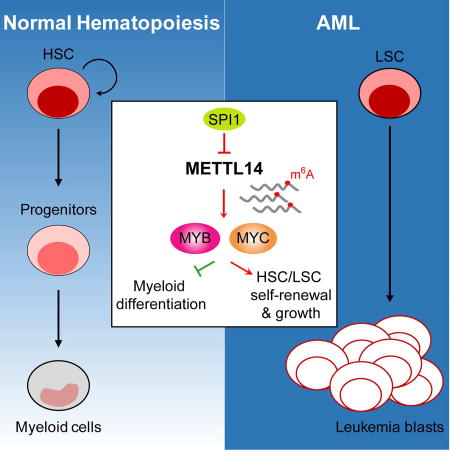
(G) Proposed model depicting regulation and role of METTL14 in normal and malignant hematopoiesis.
Mean±SD values are shown for Figures 7A and 7C. **, p <0.01; ***, p < 0.001; t-test. See also Figure S7.
DISCUSSION
Here we show that METTL14 plays a critical role in both normal myelopoiesis and pathogenesis of AML, by positively regulating expression of MYB and MYC through m6A-based post-transcriptional regulation, while its own transcription is negatively regulated by SPI1. MYB and MYC both are master regulators of self-renewal and differentiation of norml HSPCs and AML cells (Ramsay and Gonda, 2008; Wall et al., 2008) and are essential for AML initiation and maintenance (Delgado and Leon, 2010; Ramsay and Gonda, 2008). In contrast, SPI1, a master TF that is up-regulated during myelopoiesis, is a potent inducer of granulocytic/monocytic differentiation (Dakic et al., 2005; Rosenbauer and Tenen, 2007). SPI1 is often expressed at a low level in AML (Cook et al., 2004), and even a moderate reduction of SPI1 expression (~35%) is sufficient to induce myeloid-biased preleukemic stem cells and subsequent leukemogenesis in a DNA mismatch repair-deficient background (Will et al., 2015). Thus, our studies place METTL14 and its associated m6A-modification in the center of the master TFs network that governs normal myelopoiesis and leukemogenesis (see the proposed model in Figure 7G). Briefly, in normal HSPCs, METTL14, as well as MYB and MYC (two targets of METTL14), is highly expressed, while SPI1 expression is kept low; during myeloid differentiation, SPI1 is up-regulated and thus METTL14 (as well as MYB and MYC) expression is repressed. In AML cells, SPI1 expression is suppressed and METTL14 (as well as MYB and MYC) expression is up-regulated, which in turn leads to enhanced self-renewal/proliferation of LSCs/LICs and blockage of myeloid differentiation; such a blockage can be abrogated by differentiation-inducing agents (e.g., ATRA and PMA), through reversing the expression patterns of the above genes (Figure 7G).
It is worth noting that the majority of genes with reduced abundance of m6A peaks (m6A-hypo) after METTL14 knockdown show a reduced expression at the overall mRNA level. For instance, MYB and MYC exhibit a marked decrease in m6A signal upon METTL14 knockdown, and their expression levels are also decreased. RNA stability analysis revealed a shortening of half-lives for both transcripts upon METTL14 knockdown, suggesting that METTL14-mediated m6A deposition in AML cells likely promotes the stabilization of the vast majority of target mRNA transcripts. This is in agreement with our recent report of FTO (a demethylase firstly identified for m6A (Jia et al., 2011) and recently found also for m6Am (Mauer et al., 2017)) (Li et al., 2017), and suggests that an alternative reading process opposite to YTHDF2/YTHDF3-mediated mRNA decay is likely responsible for the enhanced stability of many m6A-modified targets of METTL14 and FTO in AML cells. In addition, we show that METTL14 also affects translation of its target genes, which could be mediated through pathways that directly recruits eIF3 by m6A at 5’ UTR (Meyer et al., 2015). It will be very interesting to elucidate the underlying mechanisms in the future.
In our previous study (Li et al., 2017), we reported that FTO plays a critical oncogenic role in cell transformation and leukemogenesis as an m6A eraser. In the present study, we show that METTL14 is highly expressed in normal HSPCs and AML cells and exerts its oncogenic role as an essential component of m6A methyltransferase complex (MTC). A recent report showed that METTL3 also plays an oncogenic role in AML (Vu et al., 2017). RNA-binding motif protein 15 (RBM15), which has recently be found to bind the m6A MTC and facilitate RNA methylation (Patil et al., 2016), was also linked to pediatric AML (Wiseman et al., 2012). These data suggest that perturbations of the RNA methylation modifiers may have intrinsic links with leukemogenesis. As the METTL3/METTL14/WTAP MTC accounts for most of the m6A deposition in the transcriptome whereas FTO affects only a small portion, a perturbation of the m6A MTC affects many more transcripts than does FTO perturbation, leading to more dramatic effects. While high levels of FTO promotes proliferation, METTL14 appears to dramatically affect differentiation and impact more critical genes such as MYC and MYB and thereby is likely more essential for the initiation of AML. Interestingly, while METTL14 promotes stability of MYC mRNA through affecting m6A abundance mainly on the 3'-terminal exon, we very recently show that FTO also promotes stability of MYC mRNA through inhibition of YTHDF2-mediated RNA decay attributed to decreased m6A abundance on the 5'-terminal and internal exons of MYC mRNA (Su et al., 2017), indicating that m6A modifictaions on different regions of the same mRNA transcript (e.g., MYC) may lead to distinct fates likely due to recognition by different readers. METTL14 has only limited effects on m6A modifcation on the 5'-terminal and internal exons of MYC, likely due to a compensated effect of FTO whose expression is indirectly and positively regulated by METTL14 (Su et al., unpublished data). Importantly, our data suggests that, just like in DNA methylation, in which mutations of either DNMT3A or TET proteins can contribute to AML development (Delhommeau et al., 2009; Ley et al., 2010), the imbalance of RNA m6A methylation through aberrant expressions of either writer or eraser could tilt the balance of gene expression, contributing to leukemia development and/or proliferation.
Blockage of myeloid differentiation is a hallmark of AML (Rosenbauer and Tenen, 2007). Given the success of ATRA/arsenic trioxide (ATO)-based differentiation therapy that has transformed t(15;17) AML (or acute promyelocytic leukemia; APL) from a highly fatal disease to a highly curable one (Huang et al., 1988), disrupting the block to allow AML cell differentiate is a promising strategy for AML therapy. Since METTL14 mediates myeloid differentiation and is highly expressed in various AML subtypes, application of small-molecule inhibitors targeting METTL14 together with ATRA/ATO may represent effective novel therapeutic strategies to treat METTL14-high AMLs, especially the non-APL ones. Notably, depletion of METTL14 expression displayed a less inhibitory effect in normal HSPC than that in leukemia cells, which provides a potential therapeutic window.
In sum, our studies demonstrate the critical role of METTL14 in normal myelopoiesis and AML pathogenesis, as featured by blocking myeloid differentiation and promoting self-renewal of normal HSPCs and LSCs/LICs, and uncover a previously unrecognized signaling axis involving SPI1⊣METTL14-MYB/MYC in normal and malignant myelopoiesis. Moreover, our work suggests that targeting METTL14, especially in combination with standard differentiation-inducing agents, might be an effective therapeutic strategy to treat METTL14-high AMLs.
STAR METHODS
EXPERIMENTAL MODEL AND SUBJECT DETAILS
Mice and Animal Housing
The Mettl14fl/flCREERT inducible knockout mouse model with the background of C57BL/6 was created and provided by Dr. Chuan He (University of Chicago). C57BL/6NHsd (CD45.2) and B6.SJL-PtprcaPepcb/BoyCrCrl (CD45.1) mice were purchased from Harlan Laboratories, Inc (Indianapolis, IN, USA) and the Charles River Laboratories (Wilmington, MA), respectively. The OD/LtSz-scid IL2RG-SGM3 (NSGS) immunodeficient mice were purchased from the Jackson Laboratory (Bar Harbor, ME). Both male and female mice at the age of 5–9 weeks were used for the experiments. All laboratory mice were maintained under standard husbandry and housing conditions in the University of Cincinnati Vontz Center animal core facility. All experiments on mice in our research protocol were approved by Institutional Animal Care and Use Committee (IACUC) of University of Cincinnati.
Leukemic patient samples and normal hematopoietic cell samples
The leukemic samples were obtained at the time of diagnosis or relapse and with informed consent at Cincinnati Children’s Hospital Medical Center (CCHMC) and City of Hope (COH), and were approved by the institutional review board of the institutes/hospitals. The leukemic samples were stored in liquid nitrogen until used. Leukemia blasts and mononuclear cells (MNCs) were purified using NycoPrep 1.077A (Axis-Shield, Oslo, Norway) or Ficoll-Paque PLUS (GE Healthcare Life Sciences). Normal MNC, CD34+ hematopoietic stem/progenitor cells (HSPCs), and CD34− cells were purified from cord blood of healthy donors from CCHMC using Ficoll-Paque PLUS and CD34+ beads (Miltenyi Biotec). The sample size of leukemic samples was not pre-determined. Samples were allocated to different groups according to their cytogenetic characteristics.
Isolation and induced differentiation of CD34+ HSPCs
MNCs were isolated from cord blood of healthy donors from Cincinnati Children’s Hospital Medical Center (CCHMC, Cincinnati, USA) using Ficoll-Paque PLUS (GE Healthcare Life Sciences), and were used for purification of human CD34+ HSPCs by using human CD34 MicroBead Kit (Miltenyi Biotec, Auburn, CA). The CD34+ cells were cultured in StemSpan™ SFEM medium (StemCell Technologies, Vancouver, Canada) supplemented with 1% Lipid Mixture 1 (L0288, Sigma-Aldrich, St. Louis, MO), 2 mmol/L L-glutamine, 1% penicillin-streptomycin, 100 ng/mL SCF, and 2 ng/mL IL-3. To induce monocyte/macrophage differentiation, the cytokine cocktail of 50 ng/mL M-SCF, 1 ng/mL IL-6 and 100 ng/mL Flt-3L was freshly added to the culture media. All these cytokines were of human origin and purchased from PeproTech (Rocky Hill, NJ).
Cell culture
U937, HEK-293T, and OP9 cells (CRL-2749) were all purchased from American Type Culture Collection (ATCC) and were not authenticated by ourselves. MonoMac-6 (MM6) cells were authenticated by Short Tandem Repeat (STR) analysis within the past 6 months. NB4 and U937 cells were maintained in regular RPMI-1640 medium (Invitrogen, Carlsbad, CA) containing 10% FBS, 1% HEPES and 1% penicillin-streptomycin. For MonoMac-6 (MM6) cells, 2 mM L-Glutamine, 1×Non-Essential Amino Acid, 1 mM sodium pyruvate, and 9 µg/ml insulin (Invitrogen) were added to the regular RPMI-1640. HEK-293T cells were grown in DMEM medium supplemented with 10% FBS and 1% penicillin-streptomycin. OP9 cells were cultured in Alpha-MEM media (ATCC) containing 2.2 g/L sodium bicarbonate and 20% FBS. Primary CD34+ blasts cells from AML patients were either cultured in SFEM cells as described above or in IMDM medium supplemented with 20% FBS and 10 ng/mL of SCF, TPO, Flt-3L, IL-3, and IL-6.
METHODS DETAILS
Cell transfection
ON-TARGETplus siRNAs (GE Dharmacon, Chicago, IL) were transfected into MonoMac-6 and NB4 cells at a final concentration of 50 nmol/L with SG Cell Line 4D-Nucleofector® X Kit following program DV-100 using the 4D-Nucleofector™ System (Lonza, Cologne, Germany). HEK-293T cells were transfected using Lipofectamine™ 2000 (Invitrogen). Cells were collected 24 or 48 hours after transfection.
OP9 coculture assay
Coculture of mouse HSPCs with OP9 cells were performed according to a published protocol (Holmes and Zuniga-Pflucker, 2009) with some modifications. Briefly, OP9 cells were seeded into 6-well plates and allowed to grow to a confluence of 80%–90%. Lin− HSPCs were purified from BM of wildtype mice and 0.1×10⁶ cells were seeded in 2 mL OP9 medium onto the OP9 cells with the addition of 10 ng/mL mouse IL-3, 10 ng/mL human IL-6, 10 ng/mL mouse IL-7, 10 ng/mL mouse Flt-3L, and 50 ng/mL mouse stem cell factor (SCF). At day 5, cells were disaggregated without the use of trypsin and filtered through a 40 µm cell strainer, and collected for analysis by qPCR or flow cytometry. All cytokines were from PeproTech (Rocky Hill, NJ) except for mouse IL-7 which was purchase from eBioscience (San Diego, CA).
Isolation of HSC and lineage cells from mice bone marrow
Bone marrow (BM) cells were collected from tibia and femur from 5- to 7-week-old mice and resuspended in ammonium chloride solution (StemCell Technologies) to remove red blood cells. After counting, cells were spun down and resuspended in cold MACS buffer, and subjected to isolation of lineage cells by harvesting the adherent or non-adherent fraction by selection with specific microbeads (Miltenyi Biotec) following the manufacturer’s instructions. Briefly, c-Kit+ and c-Kit− cells were separated by using CD117 MicroBeads mouse (130-091-224), Lin− and Lin+ cells were separated with the Lineage Cell Depletion Kit (130-090-858), whereas CD11b+, Gr1+, B220+, and CD4+/CD8+ cells were purified by staining cells with CD11b-Biotin (clone M1/70.15.11.5, 130-098-582), Gr-1-Biotin (clone RB6-8C5, 130-101-894), CD45R (B220)-Biotin (clone RA3-6B2, 130-101-928), CD4-Biotin (clone GK1.5, 130-101-962)/CD8a-Biotin (clone 53-6.7, 130-101-956) antibodies, respectively, follow by incubating with Anti-Biotin MicroBeads UltraPure (130-105-637) and then applying to MACS seperation columns (Miltenyi Biotec).
For HSC and progenitor cells shown in Figure 1C, cells were stained with specific cell surface markers (HSC: Lin−Sca-1+c-Kit+ CD48−CD150+; LSK: Lin−Sca-1+c-Kit+; HPC: Lin−Sca-1−c-Kit+; CMP: Lin−Sca-1−c-Kit+CD16/32−CD34+; GMP: Lin−Sca-1−c-Kit+CD16/32+CD34+; MEP: Lin−Sca-1−c-Kit+CD16/32−CD34−; Myeloid: Mac-1+Gr-1+) and sorted in a MoFlo cell sorter (Beckman Coulter, Fullerton, CA) as described previously (Hou et al., 2015).
Plasmid construction
The wild type METTL14-CDS was PCR-amplified from MM6 cDNA using the following primers: forward 5’-CCCATACGATGTTCCAGATTACGCTGATAGCCGCTTGCAGGAG-3’ and reverse 5’-CCTAACCGGTTCGAGGTGGAAAGCCACCTCTGTG-3’. The PCR product was purified and used as the template for a second PCR to add an HA tag in the N-terminal using forward (5’-CCTAGCTAGCCCACCATGTACCCATACGATGTTCCAGATTACGC-3’) and reverse (5’-CCTAACCGGTTCGAGGTGGAAAGCCACCTCTGTG-3’) primers, and then cloned into modified pLJM1-EGFP (#19319, Addgene) lentiviral vector. Site-specific mutation was generated by using Q5 Site-Directed Mutagenesis Kit (New England Biolabs, Beverly, MA) according to manufacturer’s instructions. Briefly, PCR was performed using wild-type plasmid as template and the primers with expected mutation sites. A Kinase-Ligase-DpnI enzyme mix was added to the amplified material for rapid circularization and template removal, followed by transformation into competent E. Coli. For subcloning to pCDH vector (CD513B-1, SBI, Mountain View, CA), forward (5’-gaagcTCTAGAACCACCATGTACCCATACGATGTTC-3’) and reverse (5’-ctaagattGCGGCCGCTTATCGAGGTGGAAAGCCACCTC-3’) primers were used. For subcloning into MACV-PIG retroviral vector (#21654, Addgene), forward primer (5’-caccgctcgagACCACCATGTACCCATACGA-3’) and reverse primer (5’-aaccgagttaacTTATCGAGGTGGAAAGCCAC-3’) were used.
The wild type SPI1-CDS was PCR-amplified from MM6 cDNA using the following primers: forward 5’-CCCATACGATGTTCCAGATTACGCTTTACAGGCGTGCAAAATGGAAGGG-3’ and reverse 5’-AATAGGATCCTCAGTGGGGCGGGTGGCG-3’. The PCR product was purified and used as the template for a second PCR to add an HA tag in the N-terminal using forward (5’-CCTAGCTAGCCCACCATGTACCCATACGATGTTCCAGATTACGC-3’) and reverse (5’-AATAGGATCCTCAGTGGGGCGGGTGGCG-3’) primers, and then cloned into pCDH lentiviral vector using NheI and BamHI enzyme sites.
The MYB CDS was PCR-amplified from MM6 cDNA using the following primers: forward 5’-CCCATACGATGTTCCAGATTACGCTGCCCGAAGACCCCGGCA-3’ and reverse 5’-ctaagattGCGGCCGCTCACATGACCAGCGTCCGGG-3’. After a second PCR (forward: 5’-gaagcTCTAGACCACCATGTACCCATACGATGTTCCAGATTACGCTG and reverse: ctaagattGCGGCCGCTCACATGACCAGCGTCCGGG) to add an HA tag upstream of the CDS, the MYB-encoding cDNA was cloned into the pMIRA1 lentiviral vector (SBI).
The MYC CDS was amplified from the pCDNA3-HA-HA-humanCMYC plasmid (#74164, aDDGENE) using forward primer 5’-gaagcTCTAGACCACCATGTACCCTTACGACGTGC-3’ and reverse primer 5’-ctaagattGCGGCCGCTTACGCACAAGAGTTCCGTAGC-3’, and then cloned into pMIRA1 vector.
The TRC shRNAs targeting human METTL14 (shM14-#1: TRCN0000015935; shM14-#2: TRCN0000015936), mouse Mettl14 (Mettl14-sh#1: TRCN0000084993; Mettl14-sh#2: TRCN0000084995), human YTHDF1 (TRCN0000062770), as well as the non-targeing control shRNA, were purchased from GE Dharmacon. DNA oligos encoding shRNAs targeting human YTHDF2 (mature antisense: ATATTCTGAACCAAAGCCT) and YTHDF3 (mature antisense: TAATTCCTCAGACAAATGC) were synthesized from Integrated DNA Technologies and cloned into the pLKO.1 vector (Addgene).
Cell proliferation/growth and apoptosis assays
The cell proliferation/growth was assessed by MTT (G4000, Promega, Madison, WI) following the manufacturer's instructions. Briefly, cells were seeded on 96-well plate in triplicates at the density of 5000–10000 cells/100 µL. Dye solution was added at indicated time points and incubated at 37°C for 3–4 hours before adding of solubilization/stop to stop the reaction. The absorbance at 570nm (with reference at 630nm) was read on the next day.
For apoptosis assays, FITC Annexin V apoptosis Detection Kit 1 (BD Biosciences, San Diego, CA) was used following the manufacturer’s manuals. Briefly, cells were washed twice with cold PBS, stained with FITC-Annexin V and propidium iodide (PI) on ice for 5 min, and subjected to flow cytometric analysis on a BD LSRFortessa analyzer (BD Biosciences).
Cell differentiation assay
After counting with trypan blue exclusion, 20000–50000 cells were loaded and cytospins were prepared at 1000 rpm for 5 min. Slides were let dry and stained with StainRITE® Wright-Giemsa Stain Solution (Polysciences, Warrington, PA) and mounted with Poly-mount (Polysciences).
For flow cytometric analysis, MM6, NB4 or U937 cells with different treatments were harvested and washed with chilled PBS, followed by staining with PE-labeled anti-CD11b (101208, BioLegend) and APC-labeled anti-CD14 (17-0149-41, eBioscience) antibodies for 25 minutes. Cells were then fixed and analyzed on a BD LSRFortessa or FACSAria III analyzer (BD Biosciences).
Chromatin immunoprecipitation (ChIP) assays
ChIP assays were performed using the EpiTect ChIP OneDay Kit (Qiagen, Valencia, CA) according to the manufacturer’s instructions with some modifications. Briefly, MM6 cells were crosslinked with 1% formaldehyde at 37°C for 10 min before stop buffer was added to terminate the reaction. After cell lysis, cross-linked chromatin was sheared using Bioruptor Pico (Diagenode, Denville, NJ) with 30s on/30s off for 30 cycles. Pre-cleared DNA was then used for immunoprecipitation with 4 µL of PU.1 antibody (2258, Cell Signaling Technologies, Beverly, MA) or rabbit control IgG (Thermo Fisher Scientific, Waltham, MA) at 4°C overnight. For the input control, 1% of the sonicated pre-cleared DNA was saved and purified at the same time with the precipitated immune complex. Quantitative RT-PCR (qPCR) analysis was then performed using primers listed in Table S1.
Virus preparation and infection
These assays were conducted as described previously (Jiang et al., 2012; Li et al., 2012) with some modifications. Briefly, retroviruses or lentiviruses were produced in 293T cells by co-transfection of individual expression construct with the pCL-Eco packaging vector (IMGENEX, San Diego, CA) or the pMD2.G:pMDLg/pRRE:pRSV-Rev packaging mix (individually purchased from Addgene), respectively. The virus particles were harvested at 48 and 72 hours after transfection and added to cells with or without concentrating, and two rounds of “spinoculation” were performed to allow the infection of viruses.
In vitro colony-forming and replating (CFA) assay
Bone marrow (BM) cells were collected from 5- to 7-week-old wild-type or Mettl14fl/flCreERT mice, and BM progenitor (i.e., lineage negative, Lin−) cells were enriched with the Mouse Lineage Cell Depletion Kit (Miltenyi Biotec). BM progenitor cells were then co-transduced with different combinations of retroviruses or lentiviruses as indicated through two rounds of “spinoculation”. Cells were then plated into ColonyGEL methylcellulose medium (ReachBio, Seattle, WA) supplied with 10 ng/ml of murine recombinant IL-3, IL-6, GM-CSF and 30 ng/ml of murine recombinant SCF, along with 1.0 mg/ml of G418 (Gibco BRL, Gaithersburg, MD) and/or 2.5 µg/ml of puromycin (Sigma-Aldrich). Cultures were incubated at 37°C in a humidified atmosphere of 5% CO2 for 6 to 7 days. Serial replating was then performed by collecting colony cells and replated them in methylcellulose medium every 7 days. Colony numbers were counted and compared for each passage.
For CFA assays using human primary cells, CD34+ HSPCs transduced with lentivirus were seeded into MethoCult™ H4434 Classic medium (StemCell Technologies) with the addition of 2.5 µg/ml puromycin. Cultures were incubated at 37°C in a humidified atmosphere of 5% CO2 for 10 days before counting.
Mouse bone marrow transplantation (BMT)
These assays were conducted as described previously (Jiang et al., 2012; Li et al., 2012; Li et al., 2017) with some modifications. Briefly, colony cells were collected from the colony-forming assays and transplanted via tail vein injection into lethally (900 cGy, 96 cGy/min, γ-rays) irradiated 7- to 9-week-old B6.SJL (CD45.1) or C57BL/6 (CD45.2) recipient mice. For each recipient mouse, 0.1–0.2× 10⁶ donor cells from CFA assays and a radioprotective dose of whole bone marrow cells (1× 10⁶) freshly harvested from a B6.SJL (CD45.1) or C57BL/6 (CD45.2) mouse were transplanted. For secondary BMT (Figures 3J and 3K) using BM cells from primary BMT mice, BM cells from primary Mettl14fl/fl-CT leukemic mice (2 mice) were stained with PE-CD45.2, sorted on a BD FACSAria III cell sorter (BD Biosciences), and mixed 1:1 before transplanted (a total 0.1× 10⁶ donor cells/recipient mouse) into sublethally (480 cGy, 96 cGy/min, γ-rays) irradiated 6- to 8-week-old B6.SJL (CD45.1) recipient mice. Leukemic mice were euthanized by CO2 inhalation when they showed signs of systemic illness. BM cells were isolated from both tibia and femur, and 50,000 cells were resuspended in 200 µl of cold MACS Buffer (1×PBS supplemented with 2 mmol/L EDTA and 0.5% BSA) and loaded for cytospin preparation. BM cytospin and blood smear slides were stained with Wright-Giemsa (Polysciences). Portions of the spleen and liver from leukemic mice were collected at the time of sacrifice, fixed in formalin and embedded in paraffin. The tissue samples were then sectioned and stained with haematoxylin and eosin (H&E) by the Pathology Research Core in Cincinnati Children's Hospital Medical Center.
Induced deletion of Mettl14 in vitro and in vivo
For in vitro deletion of Mettl14, (Z)-4-Hydroxytamoxifen (H7904, Sigma-Aldrich) was dissolved in ethanol at a stock concentration of 1 mmol/L and freshly added to liquid medium or methylcellulose medium for BM cells from Mettl14fl/flCREERT mice at a final concentration of 1 µmol/L. Cells were cultured for 3 days in liquid medium or 7 days in methylcellulose medium before harvested.
For in vivo deletion of Mettl14, tamoxifen (T5648, Sigma-Aldrich) was dissolved in corn oil (C8267, Sigma-Aldrich) at a concentration of 20 mg/mL, aliquoted and stored at −20°C. Two hours before injection, thaw the required aliquots by shaking at room temperature. Mice were injected with tamoxifen or corn oil intraperitoneally at a dose of 75 mg/kg body weight for 6 days as indicated unless otherwise specified.
Competitive Repopulation Assay
BM cells (1×10⁶, CD45.2+) from 7~8 weeks Mettl14fl/flCREERT mice plus equal number of competitor BM cells (1×10⁶, CD45.1+CD45.2+) from 7~8 weeks B6.SJL × C57BL/6 F1 mice were transplanted into lethally irradiated (900cGy) B6.SJL mice (CD45.1) by tail vein injection. Four weeks after transplantation (set as week 0 after TAM treatment), PB was collected by tail vein bleeding of the recipient mice and subjected to flow cytometric analysis with PE-CD45.1 and APC-CD45.2 antibodies. The recipient mice were treated with tamoxifen intraperitoneally at a dose of 75 mg/kg body weight every day for 5 days and the CD45.2+/CD45.1+CD45.2+ chimeras in their PB was monitored by FACS analysis every 4 or 6 weeks for 22 weeks after the last TAM injection.
Limiting dilution assays
BM leukemic cells collected from primary Mettl14fl/fl leukemic mice (2 mice/group) that developed full-blown leukemia were stained with PE-CD45.2, sorted on a BD FACSAria III cell sorter (BD Biosciences), and injected into lethally irradiated wild-type C57BL/6 mice through tail vein with three different doses of donor cells for each group. The number of recipient mice developed full-blown leukemia within four weeks post-transplantation was counted for each group with each dose of donor cells. ELDA software (Hu and Smyth, 2009) was used to estimate the frequency of leukemia stem/initiating cells (LSCs/LICs).
Flow cytometric analysis
Flow cytometry analysis of mouse BM cells was conducted as described previously (Jiang et al., 2012; Li et al., 2012) with some modifications. Cells from BM of transplanted mice were harvested for analysis of immunophenotypes. After blocking nonspecific binding with affinity-purified anti–mouse CD16/32 (eBioscience), cells were stained at 4°C with various antibodies diluted in Flow Cytometry Staining Buffer (eBioscience) for 30 minutes and resuspended in IC Fixation Buffer (eBioscience) before loaded for flow cytometry analysis in BD FACSAria III. Antibodies used include anti-mouse CD11b-eflour 450 (Mac-1; 48-0112-82), anti-mouse CD117-APC (17-1171-83; c-kit), anti-mouse CD45.2-PE (12-0454-82), anti-mouse Sca-1-PE (12-5981-83), and Mouse Hematopoietic Lineage eFluor® 450 Cocktail (88-7772-72) from eBioscience.
For analyzing OP9-cocultured cells, cells were blocked with affinity-purified anti–mouse CD16/32, and then stained with anti-mouse antibodies from eBioscience including CD90.2 (Thy-1.2)-APC (17-0902-81), CD19-eflour 450 (48-0193-80), CD11b-PE (12-0112-83), Gr1-eflour 450 (48-5931-82), CD4-PE (12-0041-81), CD8b-APC (17-0083-81).
For evaluating engraftment of human AML cells in NSGS mice, PB and BM were collected, lyzed in ammonium chloride solution, and stained with mouse anti-human CD45-PE (555483, BD Biosciences) and mouse anti-human CD33-FITC (555626, BD Biosciences).
RNA extraction and quantitative RT-PCR analysis
Total RNA was isolated using the miRNeasy mini kit (Qiagen) according to the manufacturer’s instructions and quantified by UV spectrophotometry. Briefly, cells were lyzed with Qiazol reagent at room temperature for more than 5 min and chloroform was added. After centrifuge for 15 min at 12,000 ×g at 4°C, the aqueous phase was collected and mixed with ethanol before loaded into RNeasy Mini columns. After washing sequentially with RWT and RPE buffer, RNA was dissolved in membrane with RNase-free water and recovered by centrifuge. For analysis of mRNA expression, 200–500 ng of RNA was reverse-transcribed into cDNA in a total reaction volume of 10 µL with the QuantiTect Reverse Transcription Kit (Qiagen). Quantitative real-time PCR analysis was then performed with 0.5 µL diluted cDNA (with 2.5-fold dilution) using Maxima SYBR green qPCR master mix (Thermo Fisher Scientific) on the QuantStudio 7 Flex PCR system (Thermo Fisher Scientific). GAPDH or ACTB was used as endogenous control. Each sample was run in triplicate. The primers used for qPCR analysis were listed in Table S1.
LC-MS/MS for determination of m6A/A ratio
Double selected polyadenylated (poly(A)) mRNA was digested by nuclease P1 (1U, Wako Pure Chemical, Osaka, Japan) in 25 µl of buffer containing 20 mM of NH4OAc (pH = 5.3) at 42°C for 2 h, followed by the addition of NH4HCO3 (1 M, 3 µl, freshly made) and alkaline phosphatase (1 U, Sigma) and an additional incubation at 37°C for 2 h. The samples were diluted to 50 µl and filtered (0.22 µm pore size, 4 mm diameter, Millipore), and 5 µl of the solution was injected into LC-MS/MS. Nucleosides were separated by reverse phase ultra-performance liquid chromatography on a C18 column with on-line mass spectrometry detection using an Agilent 6410 QQQ triple-quadrupole LC mass spectrometer in positive electrospray ionization mode. The nucleosides were quantified by using retention time and the nucleoside to base ion mass transitions of 284 to 152 (G), 282.1 to 150.1 (m6A), 268 to 136 (A), 245 to 113.1 (U), and 244 to 112 (C). Quantification was performed in comparison with the standard curve obtained from pure nucleoside standards running with the same batch of samples. The m6A level was calculated as the ratio of m6A to A (Jia et al., 2011).
RNA-seq and m6A-seq assays and data analysis
For RNA-seq, total RNA was isolated from METTL14 knockdown (shM14-#2) or control (shNS) MM6 and NB4 AML cells using Trizol reagent (Thermo Fisher). Poly(A) mRNA was subsequently purified from 100 ng total RNA using NEBNext Poly(A) mRNA Magnetic Isolation Module. NEBNext Ultra Directional RNA Library Prep Kit (New England BioLabs, Ipswich, MA) was used for library preparation. Each group was sequenced in duplicate by Illumine Hiseq 1000 with single end 50-bp read length. Sequence reads were aligned to the human genome version hg19 by using standard Illumina sequence analysis pipeline. The average gene expression values of two independent studies were used for following analysis.
For m6A-seq, total RNA was isolated from MM6 and NB4 cells with (i.e., shM14-#1 and shM14-#2) or without (i.e., shNS) METTL14 knockdown using TRIzol reagent. mRNA was further purified using the Dynabeads mRNA DIRECT kit (Thermo Fisher). RNA fragmentation was performed by sonication at 10 ng/µl in 100 µl RNase-free water using Bioruptor Pico (Diagenode) with 30s on/30s off for 30 cycles. m6A-IP and library preparation were performed per the reported protocol (Dominissini et al., 2012) with some modifications. Briefly, 1 µg sonicated mRNA was mixed with 2.5 mg m6A antibody (Synaptic Systems, 202003) in 1× IP buffer and incubated with head-to-tail mixing at 4 °C for 2 h. The mixture was supplemented with 25 µL Protein A magnetic beads (Thermo Fisher) pre-washed two times with 1× IP buffer and incubated with head-to-tail mixing at 4 °C for another 2 h. The beads were then separated and washed with 1× IP buffer three times before eluted with m6A elution buffer for two times. The eluates were combined and purified with RNA Clean and Concentrator (Zymo, Orange, CA). The purified mRNA fragments were then used to construct libraries with TruSeq Stranded mRNA Library Prep Kit (Illumina, San Diego, CA). Sequencing was carried out on Illumina HiSeq 2000 with single-end 50-bp read length. Reads were aligned to human genome version 38 (GRCh38) with Tophat. The longest isoform was retained if a gene has more than one isoforms. Differential m6A modified peaks between IP and input samples were identified using exomePeak (p < 0.01).
Cross-Linking and RNA immunoprecipitation (CLIP)
RNA immunoprecipitation was performed as previously described (Rinn et al., 2007) with some modifications. Briefly, following ultraviolet crosslinking, MM6 cells were harvested and nuclear extracts were isolated and sonicated. One microgram of METTL14 (HPA038002, Sigma-Aldrich) antibody, eIF3A (#3411, CST) antibody, or rabbit control IgG (Thermo Fisher Scientific) was conjugated to Protein A/G Magnetic Beads (Thermo Fisher Scientific) by incubation at 4 °C for 4 hours, followed by 3× wash and incubation with pre-cleared nuclear extraction in RIP buffer (150 mM KCl, 25 mM Tris (pH 7.4), 5 mM EDTA, 0.5 mM DTT, 0.5% NP40, 1× protease inhibitor) at 4 °C overnight. After washing with RIP buffer for three times, beads were resuspended in 80 µL PBS, followed by DNA digestion at 37 °C for 15 min and incubation with 50 µg of Proteinase K (Thermo Fisher) at 37 °C for 15 min. Input and co-immunoprecipitated RNAs were recovered by TRIzol (Invitrogen) extraction and used for qPCR analyses using primers listed in Table S1.
Gene-specific m6A qPCR
To examine m6A modifications on individual genes, the Magna MeRIP m6A Kit (Millipore, Billerica, MA) was used according to the manufacturer’s instructions. Briefly, 200 µg of total RNA was sheared to approximately 100 nt in length by metal-ion induced fragmentation and purified, then incubated with m6A antibody (#MABE1006, included in the kit)- or mouse IgG-conjugated Protein A/G Magnetic Beads beads in 500 µL 1× IP buffer supplemented with RNase inhibitors at 4 °C overnight. Methylated RNAs were immunoprecipitated with beads, eluted by competition with free m6A, and recovered with the RNeasy kit (Qiagen). One tenth of fragmented RNA was saved as input control, and further analyzed by qPCR along with the MeRIPed RNAs using primers listed in Table S1. The related enrichment of m6A in each sample was calculated by normalizing the value of amplification cycle (Cq) of the m6A-IP protion to the Cq of the corresponding input portion.
RNA stability assays
MonoMac-6 cells with or without METTL14 konckdown were treated with actinomycin D at a final concentration of 5 µg/mL for 0.5, 1, or 3 hours and collected. Total RNA was extracted by miRNeasy Kit (Qiagen) and analyzed by RT-PCR. The turnover rate and half-life of mRNA was estimated according to previously published paper (Chen et al., 2008). Since actinomycin D treatment results in transcription stalling, the change of mRNA concentration at a given time (dC/dt) is proportional to the constant of mRNA decay (Kdecay) and mRNA concentration (C) as shown in the following equation:
Thus the mRNA degradation rate Kdecay was estimated by:
When 50% of mRNA is decayed (i.e., C/C0=1/2), the equation below can be used to calculate the mRNA half-life (t1/2):
from where:
Ribosome profiling
We followed the reported protocols (Gandin et al., 2014; Wang et al., 2015b) with the following modifications. MM6 cells were transduced with shNS, shM14-#1, and shM14-#2 lentivirus and selected with puromycin (1 µg/mL). Before collection, cycloheximide (CHX) was added to the culture media at 50 µg/mL for 7 min. Fifty million cells from each group were harvested, rinsed in cold PBS with 50 µg/mL CHX and quickly frozen in dry ice before lysis. The lysis buffer was formulated as 20 mM HEPES (pH7.6), 100 mM KCl, 5 mM MgCl2, 100 µg/ml CHX, 1% Triton-X-100, with freshly added 1:100 protease inhibitor (Roche) and 40 U/ml SUPERasin (Ambion). The sample was then fractionated into 30 fractions (0.5 mL per fraction), and analyzed by Gradient Station (BioCamp) equipped with ECONOUV monitor (BioRad, Hercules, CA) and Gilson FC203B fraction collector (Mandel Scientific, Guelph, Canada). RNA was purified from fractions 5-18 and subjected to qPCR analysis. Expression of MYB and MYC in each fraction was normalized to GAPDH as well as Input.
Western blot
Cells were counted, washed twice with ice-cold PBS and lysed using 1× SDS buffer (100 µL for 1×10⁶ cells). After sonication, equal volumes of lysates were loaded and separated by 10% SDS-PAGE and transferred to polyvinylidene fluoride membranes. Membranes were blocked with 5% non-fat milk (Bio-Rad), incubated sequentially with primary and secondary antibodies and detected by immunoblotting with the Pierce ECL Western Blotting Substrate (Thermo Fisher Scientific) or Amersham ECL Prime Western Blotting Detection Reagent (GE Healthcare). Antibodies used for Western blotting were as follows: METTL14 (HPA038002, Sigma-Aldrich), MYB (12319, Cell Signaling Technology), MYC (13987, Cell Signaling Technology), HA (11867423001, Roche, Basel, Switzerland), GAPDH (sc-47724, Santa Cruz Biotechnology, Dallas, TX), β-Actin (3700, Cell Signaling Technology). GAPDH or β-Actin was used as a loading control.
Dual-Luciferase reporter assays
For promoter reporter assays, DNA oligos correspond to wild-type binding site 3 of SPI1 within METTL14 promoter (site3-WT-Forward: CGAGGACTTCCGAAATTTCTTA; site3-WT-Reverse: GATCTAAGAAATTTCGGAAGTCCTCGGTAC) and the corresponding mutated oligos (site3-mut-Forward: CGAGGACAAGGGAAAATTCTTA; site3-mut-Reverse: GATCTAAGAATTTTCCCTTGTCCTCGGTAC) were synthesized by Integrated DNA Technologies (Coralville, IA), annealed into double stranded oligos, and ligated into pGl3-promoter vector (Promega) between KpnI and BglII enzyme sites. For dual-luciferase reporter assays, 120 ng pGl3-promoter vector (i.e., pGl3-promoter, site3-WT, or site3-mut), 20 ng pRL-TK renilla luciferase reporter vector, and 50 nmol/L siRNA (i.e., si-NC, or si-SPI1) were co-transfected into HEK-293T cells in 96-well plates. The luciferase activities were assessed 40 hours post transfection by Dual-Luciferase Reporter Assay System (Promega) and the relative Fluc/Rluc activity was calculated by normalizing the activity of firefly luciferase to that of renilla luciferase. Each group was repeated in triplicate.
The c-terminal DNA fragments of MYB and MYC containing the wild type m6A motifs as well as mutant motifs (m6A was replaced by T, see Figure S5G) were synthesized by Integrated DNA Technologies and subcloned into the XhoI site of the pMIR-REPORT firefly luciferase reporter vector (Ambion, Austin, TX). For dual-luciferase reporter assays, 80 ng wild-type or mutant firefly luciferase reporters (i.e., MYB-WT, MYB-mut, MYC-WT, or MYC-mut), 100 ng METTL14 expression vectors (i.e., M14-WT-pcDNA3, M14-R298P-pcDNA3, or pcDNA3), and 20ng pRL-TK renilla luciferase reporter vector were co-transfected into HEK-293T cells in 48-well plates. The luciferase activities were assessed 24-48 hours post transfection and analyzed as above.
QUANTIFICATION AND STATISTICAL ANALYSIS
Data were analyzed and presented as mean±SD. Two-tailed Student’s t-test was used to compare means between groups as indicated; p < 0.05 was considered significant. For Figures 3D, 3K, 3L and 4G, Kaplan-Meier survival curves were generated using GraphPad Prism 5 and the p values were calculated using the log rank test. For western blots, representative figures from two biological replicates were shown.
DATA AND SOFTWARE AVAILABILITY
The RNA-Seq and m6A-Seq data obtained in this study have been uploaded to NCBI GEO datasets under accession numbers GSE97443 and GSE97408, respectively.
Supplementary Material
HIGHLIGHTS.
-
➢
METTL14 is highly expressed in normal HSPCs and various AMLs
-
➢
METTL14 depletion promotes myeloid differentiation of HSPCs and AML cells
-
➢
METTL14 is critical for AML development/maintenance and self-renewal of LSCs/LICs
-
➢
The SPI1⊣METTL14-MYB/MYC axis controls METTL14 expression and mediates its function
Acknowledgments
We thank Genomics, Epigenomics and Sequencing Core at University of Cincinnati and the Genomic Facility at the University of Chicago for next-generation sequencing. This work was supported in part by the National Institutes of Health (NIH) R01 Grants CA214965 (J.C.), CA211614 (J.C.), CA178454 (J.C.), CA182528 (J.C.), R50 CA211404 (M.W.), RM1 HG008935 (C.H), grant 91440110 (J.Y.) from National Nature Science Foundation of China, and Academic and Research Committee of Cincinnati Children’s Hospital Medical Center. J.C. is a Leukemia & Lymphoma Society (LLS) Scholar. C.H. is an investigator of the Howard Hughes Medical Institute (HHMI) and a scientific founder of the Accent Therapeutics, Inc.. B.S.Z. is an HHMI International Student Research Fellow.
Footnotes
Publisher's Disclaimer: This is a PDF file of an unedited manuscript that has been accepted for publication. As a service to our customers we are providing this early version of the manuscript. The manuscript will undergo copyediting, typesetting, and review of the resulting proof before it is published in its final citable form. Please note that during the production process errors may be discovered which could affect the content, and all legal disclaimers that apply to the journal pertain.
AUTHOR CONTRIBUTIONS
H.W., H.H. and J.C. conceived and designed the project. H.W., H.H., C.H. and J.C. designed and supervised experiments conducted in the laboratories. H.W., H.H., H.W., X.Q., B.Z., L.D., H.S., J.S., C.S., C.H., Y.S., Y.W., M.W., L.D., R.S., K.F., C.L., M.S., Z.L., X.J., J.Y., C.H., and J.C. performed experiments and/or data analyses; B.Z., J.M., M.W., J.Y., Z.Q., M.W., C.H., and J.C. contributed reagents/analytic tools and/or grant support; H.W. H.H, C.H., and J.C. wrote the paper. All authors discussed the results and commented on the manuscript.
References
- Bokar JA, Shambaugh ME, Polayes D, Matera AG, Rottman FM. Purification and cDNA cloning of the AdoMet-binding subunit of the human mRNA (N6-adenosine)-methyltransferase. Rna. 1997;3:1233–1247. [PMC free article] [PubMed] [Google Scholar]
- Chen CYA, Ezzeddine N, Shyu AB. Messenger Rna Half-Life Measurements in Mammalian Cells. Method Enzymol. 2008;448:335–357. doi: 10.1016/S0076-6879(08)02617-7. [DOI] [PMC free article] [PubMed] [Google Scholar]
- Chen T, Hao YJ, Zhang Y, Li MM, Wang M, Han W, Wu Y, Lv Y, Hao J, Wang L, et al. m(6)A RNA methylation is regulated by microRNAs and promotes reprogramming to pluripotency. Cell Stem Cell. 2015;16:289–301. doi: 10.1016/j.stem.2015.01.016. [DOI] [PubMed] [Google Scholar]
- Cook WD, McCaw BJ, Herring C, John DL, Foote SJ, Nutt SL, Adams JM. PU.1 is a suppressor of myeloid leukemia, inactivated in mice by gene deletion and mutation of its DNA binding domain. Blood. 2004;104:3437–3444. doi: 10.1182/blood-2004-06-2234. [DOI] [PubMed] [Google Scholar]
- Dakic A, Metcalf D, Di Rago L, Mifsud S, Wu L, Nutt SL. PU.1 regulates the commitment of adult hematopoietic progenitors and restricts granulopoiesis. J Exp Med. 2005;201:1487–1502. doi: 10.1084/jem.20050075. [DOI] [PMC free article] [PubMed] [Google Scholar]
- Delgado MD, Leon J. Myc roles in hematopoiesis and leukemia. Genes Cancer. 2010;1:605–616. doi: 10.1177/1947601910377495. [DOI] [PMC free article] [PubMed] [Google Scholar]
- Delhommeau F, Dupont S, Della Valle V, James C, Trannoy S, Masse A, Kosmider O, Le Couedic JP, Robert F, Alberdi A, et al. Mutation in TET2 in myeloid cancers. N Engl J Med. 2009;360:2289–2301. doi: 10.1056/NEJMoa0810069. [DOI] [PubMed] [Google Scholar]
- Deng X, Su R, Feng X, Wei M, Chen J. Role of N6-methyladenosine modification in cancer. Curr Opin Genet Dev. 2017;48:1–7. doi: 10.1016/j.gde.2017.10.005. [DOI] [PMC free article] [PubMed] [Google Scholar]
- Dominissini D, Moshitch-Moshkovitz S, Schwartz S, Salmon-Divon M, Ungar L, Osenberg S, Cesarkas K, Jacob-Hirsch J, Amariglio N, Kupiec M, et al. Topology of the human and mouse m6A RNA methylomes revealed by m6A-seq. Nature. 2012;485:201–206. doi: 10.1038/nature11112. [DOI] [PubMed] [Google Scholar]
- Fu Y, Dominissini D, Rechavi G, He C. Gene expression regulation mediated through reversible m(6)A RNA methylation. Nat Rev Genet. 2014;15:293–306. doi: 10.1038/nrg3724. [DOI] [PubMed] [Google Scholar]
- Gandin V, Sikstrom K, Alain T, Morita M, McLaughlan S, Larsson O, Topisirovic I. Polysome fractionation and analysis of mammalian translatomes on a genome-wide scale. J Vis Exp. 2014 doi: 10.3791/51455. [DOI] [PMC free article] [PubMed] [Google Scholar]
- Holmes R, Zuniga-Pflucker JC. The OP9-DL1 system: generation of T-lymphocytes from embryonic or hematopoietic stem cells in vitro. Cold Spring Harbor protocols. 2009;2009 doi: 10.1101/pdb.prot5156. pdb prot5156. [DOI] [PubMed] [Google Scholar]
- Hou Y, Li W, Sheng Y, Li L, Huang Y, Zhang Z, Zhu T, Peace D, Quigley JG, Wu W, et al. The transcription factor Foxm1 is essential for the quiescence and maintenance of hematopoietic stem cells. Nature immunology. 2015;16:810–818. doi: 10.1038/ni.3204. [DOI] [PMC free article] [PubMed] [Google Scholar]
- Hu Y, Smyth GK. ELDA: extreme limiting dilution analysis for comparing depleted and enriched populations in stem cell and other assays. J Immunol Methods. 2009;347:70–78. doi: 10.1016/j.jim.2009.06.008. [DOI] [PubMed] [Google Scholar]
- Huang ME, Ye YC, Chen SR, Chai JR, Lu JX, Zhoa L, Gu LJ, Wang ZY. Use of all-trans retinoic acid in the treatment of acute promyelocytic leukemia. Blood. 1988;72:567–572. [PubMed] [Google Scholar]
- Jia G, Fu Y, Zhao X, Dai Q, Zheng G, Yang Y, Yi C, Lindahl T, Pan T, Yang YG, et al. N6-methyladenosine in nuclear RNA is a major substrate of the obesity-associated FTO. Nat Chem Biol. 2011;7:885–887. doi: 10.1038/nchembio.687. [DOI] [PMC free article] [PubMed] [Google Scholar]
- Jiang X, Huang H, Li Z, Li Y, Wang X, Gurbuxani S, Chen P, He C, You D, Zhang S, et al. Blockade of miR-150 maturation by MLL-fusion/MYC/LIN-28 is required for MLL-associated leukemia. Cancer Cell. 2012;22:524–535. doi: 10.1016/j.ccr.2012.08.028. [DOI] [PMC free article] [PubMed] [Google Scholar]
- Ley TJ, Ding L, Walter MJ, McLellan MD, Lamprecht T, Larson DE, Kandoth C, Payton JE, Baty J, Welch J, et al. DNMT3A mutations in acute myeloid leukemia. N Engl J Med. 2010;363:2424–2433. doi: 10.1056/NEJMoa1005143. [DOI] [PMC free article] [PubMed] [Google Scholar]
- Ley TJ, Miller C, Ding L, Raphael BJ, Mungall AJ, Robertson A, Hoadley K, Triche TJ, Laird PW, Baty JD, et al. Genomic and epigenomic landscapes of adult de novo acute myeloid leukemia. N Engl J Med. 2013;368:2059–2074. doi: 10.1056/NEJMoa1301689. [DOI] [PMC free article] [PubMed] [Google Scholar]
- Li Z, Huang H, Li Y, Jiang X, Chen P, Arnovitz S, Radmacher MD, Maharry K, Elkahloun A, Yang X, et al. Up-regulation of a HOXA-PBX3 homeobox-gene signature following down-regulation of miR-181 is associated with adverse prognosis in patients with cytogenetically abnormal AML. Blood. 2012;119:2314–2324. doi: 10.1182/blood-2011-10-386235. [DOI] [PMC free article] [PubMed] [Google Scholar]
- Li Z, Weng H, Su R, Weng X, Zuo Z, Li C, Huang H, Nachtergaele S, Dong L, Hu C, et al. FTO Plays an Oncogenic Role in Acute Myeloid Leukemia as a N6-Methyladenosine RNA Demethylase. Cancer Cell. 2017;31:127–141. doi: 10.1016/j.ccell.2016.11.017. [DOI] [PMC free article] [PubMed] [Google Scholar]
- Linder B, Grozhik AV, Olarerin-George AO, Meydan C, Mason CE, Jaffrey SR. Single-nucleotide-resolution mapping of m6A and m6Am throughout the transcriptome. Nature methods. 2015;12:767–772. doi: 10.1038/nmeth.3453. [DOI] [PMC free article] [PubMed] [Google Scholar]
- Liu J, Yue Y, Han D, Wang X, Fu Y, Zhang L, Jia G, Yu M, Lu Z, Deng X, et al. A METTL3-METTL14 complex mediates mammalian nuclear RNA N6-adenosine methylation. Nat Chem Biol. 2014;10:93–95. doi: 10.1038/nchembio.1432. [DOI] [PMC free article] [PubMed] [Google Scholar]
- Look AT. Oncogenic transcription factors in the human acute leukemias. Science. 1997;278:1059–1064. doi: 10.1126/science.278.5340.1059. [DOI] [PubMed] [Google Scholar]
- Mathelier A, Fornes O, Arenillas DJ, Chen CY, Denay G, Lee J, Shi W, Shyr C, Tan G, Worsley-Hunt R, et al. JASPAR 2016: a major expansion and update of the open-access database of transcription factor binding profiles. Nucleic Acids Res. 2016;44:D110–115. doi: 10.1093/nar/gkv1176. [DOI] [PMC free article] [PubMed] [Google Scholar]
- Mauer J, Luo X, Blanjoie A, Jiao X, Grozhik AV, Patil DP, Linder B, Pickering BF, Vasseur JJ, Chen Q, et al. Reversible methylation of m6Am in the 5' cap controls mRNA stability. Nature. 2017;541:371–375. doi: 10.1038/nature21022. [DOI] [PMC free article] [PubMed] [Google Scholar]
- Meng J, Lu Z, Liu H, Zhang L, Zhang S, Chen Y, Rao MK, Huang Y. A protocol for RNA methylation differential analysis with MeRIP-Seq data and exomePeak R/Bioconductor package. Methods. 2014;69:274–281. doi: 10.1016/j.ymeth.2014.06.008. [DOI] [PMC free article] [PubMed] [Google Scholar]
- Meyer KD, Patil DP, Zhou J, Zinoviev A, Skabkin MA, Elemento O, Pestova TV, Qian SB, Jaffrey SR. 5' UTR m(6)A Promotes Cap-Independent Translation. Cell. 2015;163:999–1010. doi: 10.1016/j.cell.2015.10.012. [DOI] [PMC free article] [PubMed] [Google Scholar]
- Meyer KD, Saletore Y, Zumbo P, Elemento O, Mason CE, Jaffrey SR. Comprehensive analysis of mRNA methylation reveals enrichment in 3' UTRs and near stop codons. Cell. 2012;149:1635–1646. doi: 10.1016/j.cell.2012.05.003. [DOI] [PMC free article] [PubMed] [Google Scholar]
- Patil DP, Chen CK, Pickering BF, Chow A, Jackson C, Guttman M, Jaffrey SR. m(6)A RNA methylation promotes XIST-mediated transcriptional repression. Nature. 2016;537:369–373. doi: 10.1038/nature19342. [DOI] [PMC free article] [PubMed] [Google Scholar]
- Ping XL, Sun BF, Wang L, Xiao W, Yang X, Wang WJ, Adhikari S, Shi Y, Lv Y, Chen YS, et al. Mammalian WTAP is a regulatory subunit of the RNA N6-methyladenosine methyltransferase. Cell Res. 2014;24:177–189. doi: 10.1038/cr.2014.3. [DOI] [PMC free article] [PubMed] [Google Scholar]
- Ramsay RG, Gonda TJ. MYB function in normal and cancer cells. Nat Rev Cancer. 2008;8:523–534. doi: 10.1038/nrc2439. [DOI] [PubMed] [Google Scholar]
- Rinn JL, Kertesz M, Wang JK, Squazzo SL, Xu X, Brugmann SA, Goodnough LH, Helms JA, Farnham PJ, Segal E, et al. Functional demarcation of active and silent chromatin domains in human HOX loci by Noncoding RNAs. Cell. 2007;129:1311–1323. doi: 10.1016/j.cell.2007.05.022. [DOI] [PMC free article] [PubMed] [Google Scholar]
- Rosenbauer F, Tenen DG. Transcription factors in myeloid development: balancing differentiation with transformation. Nat Rev Immunol. 2007;7:105–117. doi: 10.1038/nri2024. [DOI] [PubMed] [Google Scholar]
- Shi H, Wang X, Lu Z, Zhao BS, Ma H, Hsu PJ, Liu C, He C. YTHDF3 facilitates translation and decay of N6-methyladenosine-modified RNA. Cell research. 2017;27:315–328. doi: 10.1038/cr.2017.15. [DOI] [PMC free article] [PubMed] [Google Scholar]
- Sledz P, Jinek M. Structural insights into the molecular mechanism of the m(6)A writer complex. Elife. 2016;5 doi: 10.7554/eLife.18434. [DOI] [PMC free article] [PubMed] [Google Scholar]
- Su R, Dong L, Li C, Nachtergaele S, Wunderlich M, Qing Y, Deng X, Wang Y, Weng X, Hu C, et al. R-2HG exhibits anti-tumor activity by targeting FTO/m6A/MYC/CEBPA signaling. Cell. 2017 doi: 10.1016/j.cell.2017.11.031. In press. [DOI] [PMC free article] [PubMed] [Google Scholar]
- Subramanian A, Tamayo P, Mootha VK, Mukherjee S, Ebert BL, Gillette MA, Paulovich A, Pomeroy SL, Golub TR, Lander ES, et al. Gene set enrichment analysis: a knowledge-based approach for interpreting genome-wide expression profiles. Proceedings of the National Academy of Sciences of the United States of America. 2005;102:15545–15550. doi: 10.1073/pnas.0506580102. [DOI] [PMC free article] [PubMed] [Google Scholar]
- Tanaka H, Matsumura I, Nakajima K, Daino H, Sonoyama J, Yoshida H, Oritani K, Machii T, Yamamoto M, Hirano T, et al. GATA-1 blocks IL-6-induced macrophage differentiation and apoptosis through the sustained expression of cyclin D1 and bcl-2 in a murine myeloid cell line M1. Blood. 2000;95:1264–1273. [PubMed] [Google Scholar]
- Testa U. Leukemia stem cells. Ann Hematol. 2011;90:245–271. doi: 10.1007/s00277-010-1118-7. [DOI] [PubMed] [Google Scholar]
- Vu LP, Pickering BF, Cheng Y, Zaccara S, Nguyen D, Minuesa G, Chou T, Chow A, Saletore Y, MacKay M, et al. The N6-methyladenosine (m6A)-forming enzyme METTL3 controls myeloid differentiation of normal hematopoietic and leukemia cells. Nat Med. 2017 doi: 10.1038/nm.4416. [DOI] [PMC free article] [PubMed] [Google Scholar]
- Wall M, Poortinga G, Hannan KM, Pearson RB, Hannan RD, McArthur GA. Translational control of c-MYC by rapamycin promotes terminal myeloid differentiation. Blood. 2008;112:2305–2317. doi: 10.1182/blood-2007-09-111856. [DOI] [PubMed] [Google Scholar]
- Wang P, Doxtader KA, Nam Y. Structural Basis for Cooperative Function of Mettl3 and Mettl14 Methyltransferases. Mol Cell. 2016a;63:306–317. doi: 10.1016/j.molcel.2016.05.041. [DOI] [PMC free article] [PubMed] [Google Scholar]
- Wang X, Feng J, Xue Y, Guan Z, Zhang D, Liu Z, Gong Z, Wang Q, Huang J, Tang C, et al. Structural basis of N(6)-adenosine methylation by the METTL3–METTL14 complex. Nature. 2016b;534:575–578. doi: 10.1038/nature18298. [DOI] [PubMed] [Google Scholar]
- Wang X, Zhao BS, Roundtree IA, Lu Z, Han D, Ma H, Weng X, Chen K, Shi H, He C. N(6)-methyladenosine Modulates Messenger RNA Translation Efficiency. Cell. 2015a;161:1388–1399. doi: 10.1016/j.cell.2015.05.014. [DOI] [PMC free article] [PubMed] [Google Scholar]
- Wang X, Zhao BS, Roundtree IA, Lu ZK, Han DL, Ma HH, Weng XC, Chen K, Shi HL, He C. N-6-methyladenosine Modulates Messenger RNA Translation Efficiency. Cell. 2015b;161:1388–1399. doi: 10.1016/j.cell.2015.05.014. [DOI] [PMC free article] [PubMed] [Google Scholar]
- Wang Y, Li Y, Toth JI, Petroski MD, Zhang Z, Zhao JC. N6-methyladenosine modification destabilizes developmental regulators in embryonic stem cells. Nat Cell Biol. 2014;16:191–198. doi: 10.1038/ncb2902. [DOI] [PMC free article] [PubMed] [Google Scholar]
- Will B, Vogler TO, Narayanagari S, Bartholdy B, Todorova TI, da Silva Ferreira M, Chen J, Yu Y, Mayer J, Barreyro L, et al. Minimal PU.1 reduction induces a preleukemic state and promotes development of acute myeloid leukemia. Nat Med. 2015;21:1172–1181. doi: 10.1038/nm.3936. [DOI] [PMC free article] [PubMed] [Google Scholar]
- Wiseman DH, Bonney DK, Wynn RF. Hemophagocytosis by leukemic megakaryoblasts in acute myeloid leukemia (megakaryoblastic) with t(1;22)(p13;q13);RBM15-MKL1. J Pediatr Hematol Oncol. 2012;34:576–580. doi: 10.1097/MPH.0b013e318245a027. [DOI] [PubMed] [Google Scholar]
- Wunderlich M, Chou FS, Link KA, Mizukawa B, Perry RL, Carroll M, Mulloy JC. AML xenograft efficiency is significantly improved in NOD/SCID-IL2RG mice constitutively expressing human SCF, GM-CSF and IL-3. Leukemia. 2010;24:1785–1788. doi: 10.1038/leu.2010.158. [DOI] [PMC free article] [PubMed] [Google Scholar]
- Yang JH, Li JH, Jiang S, Zhou H, Qu LH. ChIPBase: a database for decoding the transcriptional regulation of long non-coding RNA and microRNA genes from ChIP-Seq data. Nucleic Acids Res. 2013;41:D177–187. doi: 10.1093/nar/gks1060. [DOI] [PMC free article] [PubMed] [Google Scholar]
- Zeisig BB, Milne T, Garcia-Cuellar MP, Schreiner S, Martin ME, Fuchs U, Borkhardt A, Chanda SK, Walker J, Soden R, et al. Hoxa9 and Meis1 are key targets for MLL-ENL-mediated cellular immortalization. Mol Cell Biol. 2004;24:617–628. doi: 10.1128/MCB.24.2.617-628.2004. [DOI] [PMC free article] [PubMed] [Google Scholar]
- Zhao L, Ye P, Gonda TJ. The MYB proto-oncogene suppresses monocytic differentiation of acute myeloid leukemia cells via transcriptional activation of its target gene GFI1. Oncogene. 2014;33:4442–4449. doi: 10.1038/onc.2013.419. [DOI] [PubMed] [Google Scholar]
Associated Data
This section collects any data citations, data availability statements, or supplementary materials included in this article.