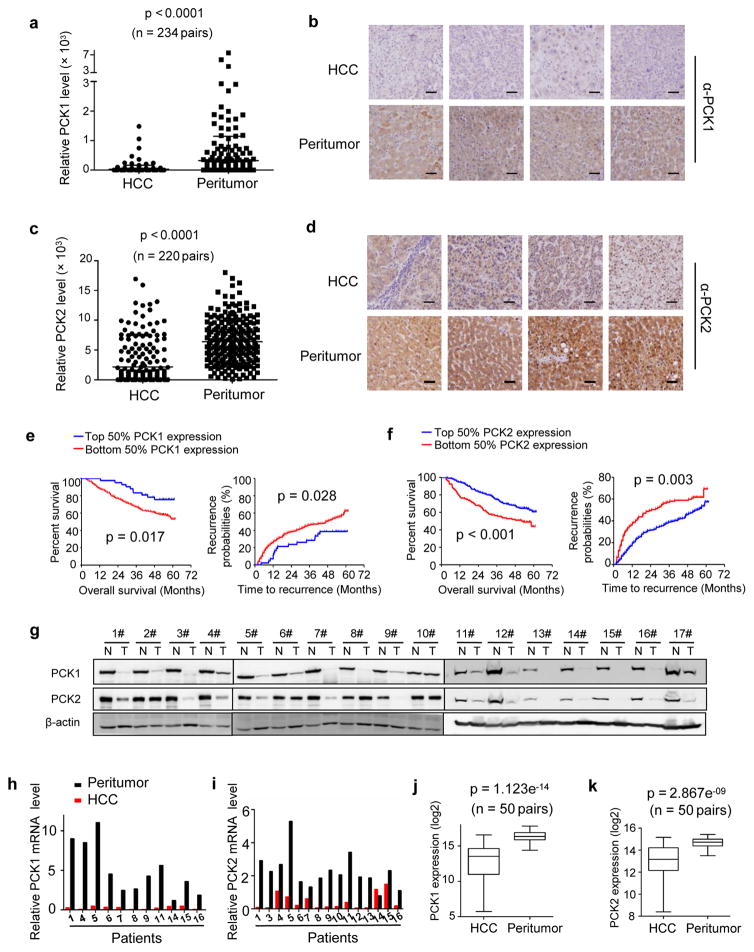
Figure 1. The expression of PCK1 and PCK2 was significantly decreased in HCC and low PCK expression was associated with poor prognosis in patients with HCC.
(a) Statistical analysis of PCK1 protein levels from 234 pairs of human liver tumors and adjacent normal liver tissues determined by IHC staining. The intensities of PCK1 proteins were quantified using the Motic Images Advanced software. The horizontal bars represent means of PCK1 protein level within each group (***p < 0.001). (b) Representative IHC staining of PCK1 from 4 pairs of patient samples described in (a). Scale bars: 50 μm. (c) Statistical analysis of PCK2 protein levels from 220 pairs of human liver tumors and adjacent normal liver tissues determined by IHC staining. Quantification was described in (a). The horizontal bars represent means of PCK2 protein level within each group (***p < 0.001). (d) Representative IHC staining of PCK2 from 4 pairs of patient samples described in (c). Scale bars: 50 μm. (e) Kaplan-Meier survival curve and probability recurrence curve of the 234 HCC patients separated into two groups by PCK1 protein levels in tumors. High and low PCK1 expressions were quantified by the intensities of PCK1 staining described in (a). (*p < 0.05). (f) Kaplan-Meier survival curve and probability recurrence curve of the 220 HCC patients separated into two groups by PCK2 protein levels in tumors. High and low PCK2 protein levels were quantified by the intensities of PCK2 staining described in (c). (** p < 0.01, ***p < 0.001). (g) The protein levels of PCK1 and PCK2 were downregulated in 17 additional patient liver tumors determined by Western blotting. (h and i) The mRNA level of PCK1 (h) and PCK2 (i) in patient-matched normal liver and tumor tissues was analyzed by RT-PCR. (j and k) Boxplot of normalized PCK1 (j) and PCK2 (k) mRNA levels in 50 pairs of human normal liver and HCC tissues provided by The Cancer Genome Atlas (TCGA) liver hepatocellular carcinoma (LIHC) project (https://gdc-portal.nci.nih.gov/projects/TCGA-LIHC). Box plots represent the 25th to 75th percentiles with median, and the whiskers represent the maximum and the minimum value. Statistical significance was determined by Wilcoxon rank sum test. p =1.123e−14 for PCK1 and p = 2.867e−09 for PCK2.

