Abstract
Background
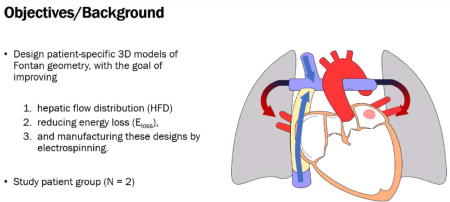
Despite advances in the Fontan procedure, there is an unmet clinical need for patient-specific graft designs that are optimized for variations in patient anatomy. The objective of this study is to design and produce patient-specific Fontan geometries, with the goal of improving hepatic flow distribution (HFD) and reducing power loss (Ploss), and manufacturing these designs by electrospinning.
Methods
Cardiac MRI data from patients who previously underwent a Fontan procedure (n=2) was used to create 3D models of their native Fontan geometry using standard image segmentation and geometry reconstruction software. For each patient, alternative designs were explored in silico – including tube-shaped and bifurcated conduits – and their performance in terms of Ploss and HFD probed by computational fluid dynamic (CFD) simulations. Best performing options were then fabricated using electrospinning.
Results
CFD simulations showed that the bifurcated conduit improved HFD between the left and right pulmonary artery, while both types of conduits reduced power loss. In vitro testing with a flow-loop chamber supported the CFD results. The proposed designs were then successfully electrospun into tissue-engineered vascular grafts (TEVG).
Conclusions
Our unique virtual cardiac surgery approach has the potential to improve the quality of surgery by manufacturing patient-specific designs before surgery, that are also optimized with balanced HFD and minimal Ploss, based on refinement of commercially available options for image segmentation, computer aided design, and flow simulations.
Graphical abstract
Introduction
The Fontan procedure is the critical, cumulative step in the overall surgical management of the single ventricle. The procedure ultimately results in a total cavopulmonary connection (TCPC), such that the majority of systemic venous return passively enters the pulmonary arteries and bypasses the heart1. Since its first development in 1971, several modifications have been made to the procedure in order to improve hemodynamics and decrease the incidence of arrhythmia, including the intraatrial tunnel, the extracardiac conduit, or more recently the intra/extracardiac modification2 or the bifurcated Y-graft design.3
Despite such advances in surgical technique and improvement in overall survival, patients with a Fontan circulation remain at risk for long term complications such as protein losing enteropathy, ventricular dysfunction, and arrhythmias.4 Fontan patients also demonstrate poorer exercise performance and decreasing functional health status over time.5 The physiological mechanism for this decrease in exercise performance is multifactorial; from a fluid dynamics standpoint, power losses along narrowed vessels in the Fontan pathway have been shown to negatively affect exercise performance.6,7 Thus, research into new Fontan conduit designs have focused on minimizing power loss (Ploss) to improve exercise capacity and potentially provide long term benefits for patients’ overall quality of life. Other hemodynamic elements can also be optimized, such as balancing the hepatic flow distribution (HFD) across the pulmonary arteries, which may reduce the instance of pulmonary arteriovenous malformations.8 Use of simulation via computational fluid dynamics (CFD) has shown to be useful in proposing virtual patient-specific Fontan designs optimized for Ploss and HFD.9,10 However, these virtual designs typically do not have commercially available counterparts for surgery, and thus this preoperative strategy cannot fully address the variable single ventricle anatomy where there is no “one-size fits all” solution.11
Tissue-engineered vascular grafts (TEVG) may serve as a bridge for implementing virtual designs. 3D custom-made TEVGs can be fabricated with an FDA-approved biodegradable nanofiber material composed of polyglycolic acid (PGA) and poly L-lactide-co-ε-caprolactone (PLCL) electrospun along a 3D-printed mandrel. Our pre-clinical trial of TEVG implanted into sheep models demonstrated remarkable resorption of the biodegradable scaffold over a 6 month period with development of an organized smooth muscle layer, extracellular matrix deposition and endothelization; the vascular grafts promisingly showed mechanical properties similar to native inferior vena cava.12 Thus, patient specific grafts (whether they are bifurcated Y-grafts or extracardiac conduits) could theoretically be fabricated in this manner to produce an optimized Fontan pathway in vivo.
The objective of this study is to introduce a novel preoperative planning method for the Fontan procedure, where virtual patient-specific Fontan conduits are first optimized via computational fluid dynamics, and subsequently 3D manufactured into TEVGs via electrospinning. This methodology could serve as a potential workflow to allow congenital heart surgeons to preoperatively visualize the Fontan circuit, optimize a conduit design, and ensure the preservation of simulated hemodynamics after the TEVGs are implanted in vivo.
Material and Methods
MRI and MR Flow Data Acquisition and Processing
This study was approved by the institutional review boards of all institutions. Cardiovascular magnetic resonance (CMR) imaging datasets from two patients, who had previously undergone a Fontan surgery for the palliation of a single ventricle heart defect, were anonymized and exported in DICOM format. CMR data included a contrast-enhanced, subtracted MR angiogram and four phase velocity flow cines in the cavae and the pulmonary arteries. MR angiography data consisted of a late phase, non-gated, breath-held acquisition with pixel size ~ 1.4 × 1.4 mm. The MR angiogram was used as a roadmap to build a 3D digital model of the Fontan circuit, including the proximal cavae and branch pulmonary arteries, using a commercially available image segmentation software (Mimics, Materialise, Belgium). Both automatic thresholding and manual methods were used to identify the blood pool of the Fontan in each slice of the MR angiogram, allowing for the creation of a 3D digital Fontan model, which was then exported using the stereolithography (STL) file format. This STL file was hollowed, smoothed, and extensions were added to allow for velocity profiles to be partially developed at the anatomic inlets (superior vena cava (SVC) and inferior vena cava (IVC)). Extension were also added at the outlets (left pulmonary artery (LPA) and right pulmonary artery (RPA)) to avoid spurious influence of the boundary conditions in the domain of interest. Figure 1 illustrates the segmentation process, beginning with the MR angiogram, and ending with the 3D digital model after the segmentation process.
Figure 1.
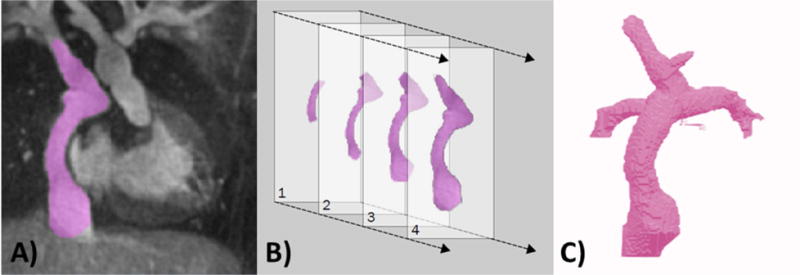
Starting with 3D contrast-enhanced magnetic resonance angiography (MRA) data, a 3D virtual model of the Fontan is built through a process called segmentation. Panel A shows the MRA with the region of interest, the Fontan blood pool, highlighted in purple. Panel B shows that the Fontan is highlighted in each slice of the MRA dataset, and all of these slices are combined to create a 3D Virtual model, shown in panel C.
Retrospectively-gated, through plane phase-encoded velocity maps were acquired across the IVC, SVC, LPA and RPA using standard sequences, reconstructing 30 phases per cardiac cycle with a velocity encoding threshold of 150 cm/sec. The time-averaged IVC and SVC flow rates were derived from the phase velocity data and prescribed as inlet boundary conditions to the CFD simulations. The time-averaged RPA and LPA flow rates were prescribed as outlet flow splits (the ratio of LPA:RPA). Finally, an additional sequence of phase velocity mapping was performed to measure the in-plane velocity along the coronal plane of the Fontan conduit to validate the flow structures predicted by CFD simulation.
CFD Simulation
CFD simulations were then performed to predict blood flow within the Fontan geometry, based on the inlet and outlet conditions extracted from MRI acquisition. The CFD simulation included several simplifications to ensure reasonable computational time while still capturing important fluid dynamic characteristics. Given the low Reynolds number in the order of 900, the flow was modeled as laminar. Following the procedure detailed in3,13, the Fontan geometry was modeled with rigid walls. Blood was modeled as an incompressible, Newtonian fluid with constant viscosity of 3.71 mPas and a density of 1060 kg/m3.13, assumptions that are deemed acceptable in large vessels such as the PAs and venae cavae.
IVC and SVC flows were prescribed to have a flat uniform flow profile with constant velocity13, the extensions allowing for partial development prior to TCPC. The corresponding velocity values of each inlet were derived from the MRI measurements averaged over one cardiac cycle. The outlet flow conditions were prescribed by the measured flow split ratio (LPA:RPA) of total inlet flow rate to maintain conservation of mass.
The commercial program Ansys FLUENT was used as the CFD simulation platform. The 3D unsteady Navier-Stokes equations were solved for 3000 timesteps. The time step of each iteration was set to 0.001 seconds. Each step was solved within 30 iterations by the SIMPLE numerical solving method. The convergence values are set to 10−5 for x,y,z-velocity and mass conservation residuals.
The performance of the Fontan grafts, and optimization goals, were measured by two parameters: the Ploss across the Fontan geometry and HFD.
Ploss was calculated based on changes in the pressure and flow rates through each inlet and outlet, according to
HFD was prescribed as the ratio of blood from IVC to the LPA and RPA respectively. The hepatic flow distribution was evaluated through particle tracking; a total number of 3000 particles (Ntot) were seeded uniformly at the IVC inlet. The number of particles passing through the RPA and LPA outlets (NRPA and NLPA respectively) was calculated at the end of the simulation using the velocity field at 3 seconds. The HFD was calculated according to
In vivo validation of simulation results was performed by comparison with MRI data, using the phase velocity map acquired along the coronal plane of the Fontan conduit. An equivalent simulated velocity map was first reconstructed and oriented along the same plane as the acquired MRI data. The velocity maps of simulation and MRI measurements were then compared, pixel-to-pixel, along 32 time measurements through the cardiac cycle. Velocity differences within 7.5cm/s were considered acceptable.
Graft Optimization
Graft optimization aimed to minimize Ploss and maintain balanced HFD within the 60:40 range, similar to previous CFD studies.14 Two graft design strategies were investigated: Tube-shaped conduits and bifurcated conduits. All graft designs were performed with the conventional computer aided design program Solidworks (Dassault Systèmes, USA), specifically using the Loft tool, which interpolates between two cross-sectional profiles along a defined curve. Different tube conduit variations were constructed from a fixed circular inlet profile (based on the native IVC area), a variable outlet profile, and a pathline. The bifurcated conduit design consisted of a stem with fixed inlet profile dividing into a left branch and a right branch of variable profiles.
For tube-shaped conduits, a manual strategy was implemented in an iterative fashion, first by exploring different locations for the insertion point within the feasible anastomoses area. Different outlet shapes were varied throughout the second iteration. In the third iteration, the size of the outlet was varied, followed by angle adjustments. After each iteration, the design with the best performance was used for the next iteration of adjustments and simulation (Figure 2). A 3D model of the surrounding heart and aorta anatomy was overlaid with the new graft designs, to minimize any overlap between the optimized graft and other thoracic features (i.e. ascending aorta, vena cavae, etc).
Figure 2.
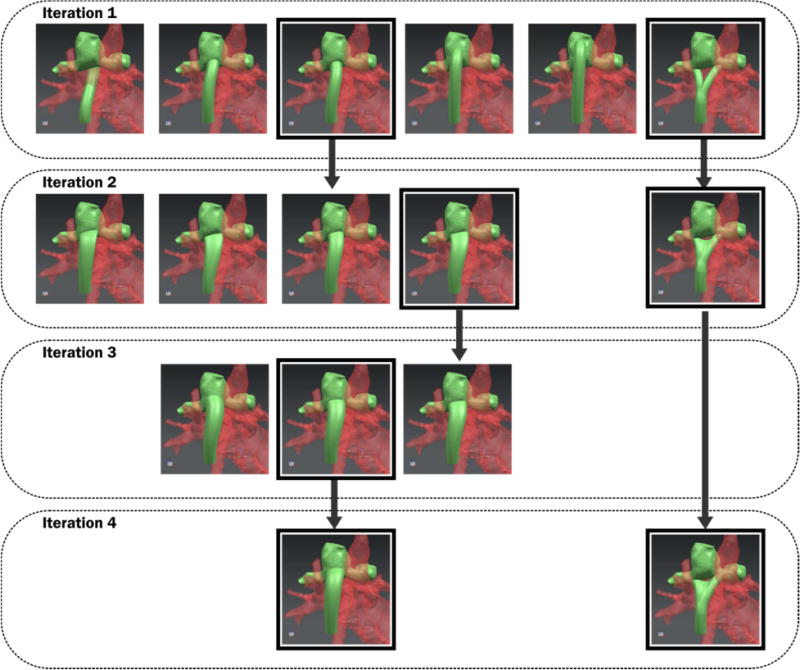
Diagram illustrating optimization strategy with four iterations of adjustments.
In vitro Testing
Validation of the simulation results was performed by testing a 3D printed version of each conduit in a four-chamber flow loop, based on an earlier developed concept presented by Ochsner et al.15 The optimized conduits were first manufactured by exporting the conduit profile as an STL file and 3D printed using a Connex500 polyjet printer (Stratasys, Eden Prarie, MN) with VeroWhite material. The printed conduits were connected to the experimental flow loop consisting of four chambers, two pumps and using a viscosity-matched glycerol-water mixture as a blood substitute. The pumps were situated upstream of the inlets and set the flow of the SVC and IVC. Two pressure adjustable chambers, connected to the LPA and RPA, controlled the flow through the corresponding outlet. The pressures of each tank and the pumps were adjusted until the measured flows matched to the in vivo time averaged IVC and SVC flow rates and RPA:LPA flow splits. Pressure measurements were conducted during three independent trials (N=3) for each one of the retained designs. The GraphPad Prism 7 (GraphPad Software, La Jolla, USA) software was used to analyze the data of the in vitro bench tests.
Statistical Analysis
To determine if data was parametric, a Shapiro-Wilk test for normality with alpha=0.05 was performed on in vitro pressure data. The Shapiro-Wilk test found that the data did not differ significantly from a normal distribution (P>0.05), so the data was assumed to be parametric. A One-Sample T-Test was used to determine if in vitro pressure data differed significantly from the theoretical mean as predicted by simulation. A Two-sample unpaired T-Test was used to compare in vitro pressures between optimized and native conduit designs. A T-Test was chosen because it is more robust to errors from small data sets, and our initial hypothesis only considers the relationships between measured data and the hypothetical mean. P values are reported for 1) pressures compared to their hypothetical mean, and 2) pressure comparison between native and optimized graft design. P<0.05 was considered statistically significant for the Shapiro-Wilk and T-Tests.
Graft Manufacturing
After validation of the optimized design, a biodegradable version of each conduit was manufactured using a 3D electrospinning technique. A stainless-steel mandrel in the shape of the optimized graft was 3D printed by exporting the STL file of the graft to an external printing house (Shapeways, NY). The mandrel was designed in a way that the electrospun polymer graft could be removed. In case of the bifurcated grafts, the mandrel was a three-part piece, pinned together, to allow taking apart for graft removal. An additional pin was added to the mandrel to clamp it into the electrospinning setup.
Next, nano/micro polymer fibers were electrospun onto the mandrel (Nanofiber Solutions, OH). By applying a high voltage to the polymer solution of a syringe and the mandrel, polymer fibers were deposited on the mandrel to create the graft design.
Results
In vivo Validation of the CFD simulations
When reconstructed along the coronal plane of the Fontan conduit and compared with cardiac MRI phase contrast data, 75% of simulated data remained within a representative threshold (Figure 3). Errors above the set threshold were found predominantly along the boundaries of the acquired velocity maps.
Figure 3.
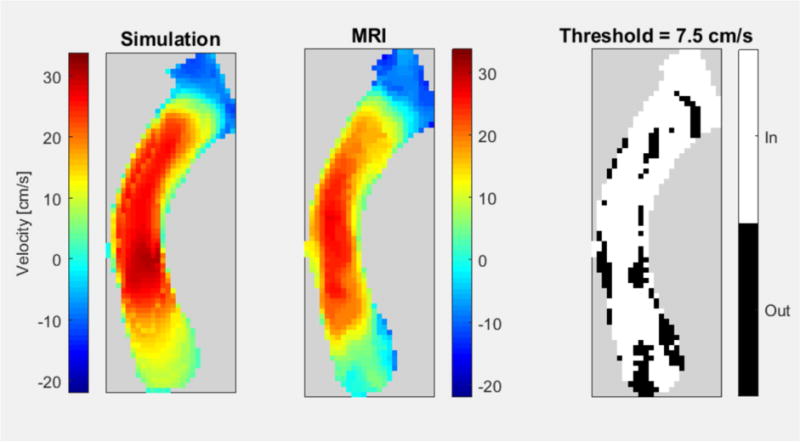
In vivo validation results are shown, comparing flow velocity profiles of simulation (left) to measured MRI flow (middle). Subtracting the two (right) highlights that the areas of velocities difference are primarily located on the boundaries.
Optimized Patient Designs
Patient 1 (Extra Cardiac Fontan)
The results of two optimized designs are shown in Figure 4. The length of the tube shaped conduit was similar to the native condition. The outlet profile had an elliptic shape (major axis = 12.4 mm, minor axis = 9.6 mm) and the insertion point was shifted approximately 5 mm towards the RPA. The insertion angle in the transverse plane was tilted approximately 35 degrees towards the RPA compared to the native condition. The insertion angle of the sagittal plane was tilted approximately 18 degrees towards the IVC. The stem of the bifurcated graft had a circular profile and split into two branches with equal diameter of 11.3 mm. The left branch was shifted 16 mm towards the lower side of the LPA and the right branch was shifted 19 mm towards the RPA. The tube-shaped conduit and bifurcated graft designs showed improvements in hepatic flow distribution and power loss compared to the native geometry. The tube-shaped conduit design demonstrated a Ploss of 3.42 mW, a 24% decrease in Ploss compared to the native geometry. The HFD for LPA/RPA also improved from 74:26 to 57:42. The bifurcated graft also decreased Ploss by 38% to 2.89 mW. The HFD improved to 41:59.
Figure 4.
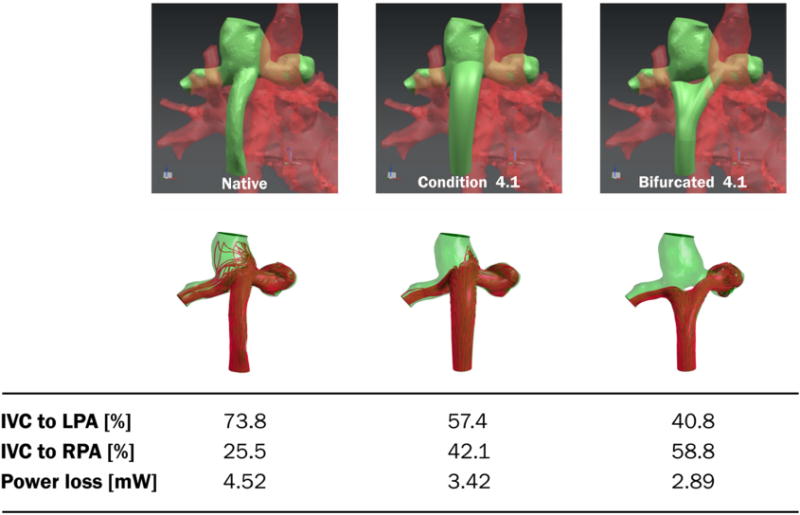
Graft optimization results for patient #1. Native graft, best tube-like graft, and best bifurcated graft are shown with corresponding power loss and left/right pulmonary flow distribution. The tube is positioned in the center of the cavopulmonary anastomosis with a slightly anterior position that avoided collision with the SVC inflow. The outlet of the graft was shaped elliptically in order to promote hepatic flow distribution. The area was 50% larger than the inlet area. The bifurcated graft is positioned in the center and the branches are directed towards the pulmonary arteries. A 10 mm fillet is inserted in the middle of the branches to account for electrospinning manufacturing specifications.
Patient 2 (Intra-Extra Cardiac Fontan)
The geometrical limitations of patient anatomy, specifically the positioning and size of the left pulmonary artery, limited the optimization of a bifurcated graft design. The tube-graft design relied on minor adjustments to positioning relative to the cavopulmonary anastomosis, resulting in an 11% decrease in Ploss (from 5.93 to 5.27 mW) and slight shift in HFD from 44:56 to 54:46 LPA:RPA (Figure 5). The outlet profile had a circular shape and was 3mm bigger in diameter than the inlet diameter. The insertion point was shifted approximately 6 mm towards the LPA. The insertion angle in the transverse plane was tilted approximately 40 degrees compared to the native condition. The insertion angle of the sagittal plane did not differ significantly.
Figure 5.
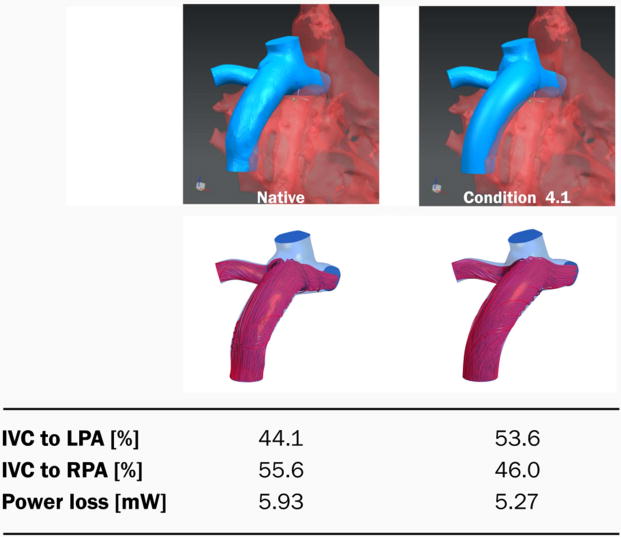
Graft optimization results for patient #2. Native graft and best tube-like graft are shown with corresponding power loss and left/right pulmonary flow distribution. Relative to the native geometry, the tube is positioned in the center of the cavopulmonary anastomosis and has a slightly anterior inflow direction that tries to avoid direct flow competition with the SVC inflow. The outlet of the graft has a circular shape with radius of 10mm.
In vitro Testing
With the exception of the RPA pressure in native Fontan of Patient 2 (P=0.004) the simulated pressures were in excellent agreement with the ones measured in our in vitro test setup (Figure 6), demonstrating that our CFD simulations can accurately predict pressures and power losses in complex Fontan geometries, and be applied toward the optimization of conduit geometries under set flow conditions. Maintaining caval and pulmonary flow constants, the reduction in power losses observed in the optimized designs compared to the native ones reflect a reduction in Fontan pathway resistance. The optimized designs were thus associated with smaller pressure drops.
Figure 6.
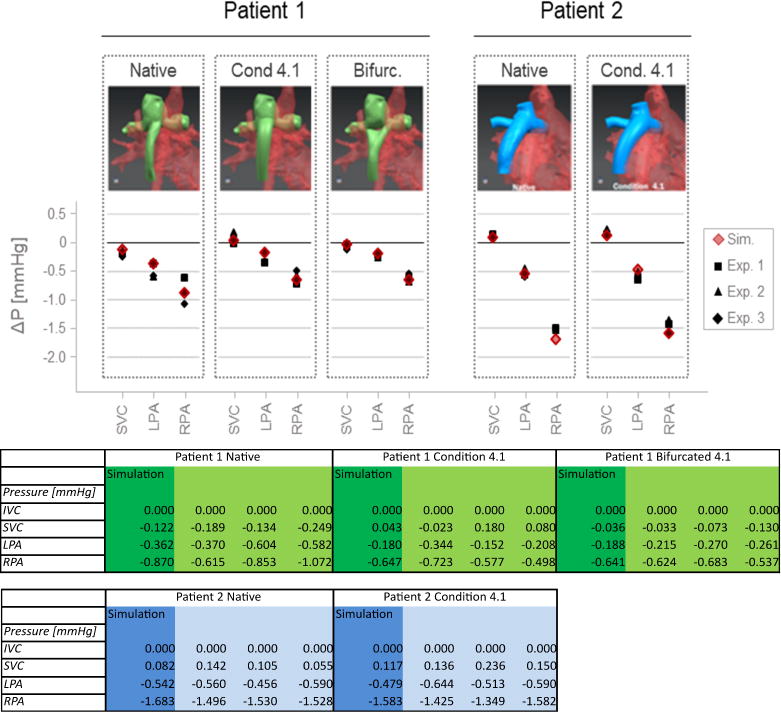
In vitro testing results to validate the CFD simulation showing the experimental in-vitro testing results in graphical form (on top) and numerically in a table (bottom). Preliminary in vitro testing in a four-chamber pressure and flow controlled test setup demonstrated a close match between CFD simulated (Sim) and in vitro measured (Nr. 1–3) pressures.
In our in vitro set-up, all pressure changes were significant with the exception of that of LPA pressure in Patient 2 (P=0.447). For Patient 1, the pressure drops between the IVC and the SVC, LPA, and RPA reduced by 0.296 (P=0.016), 0.284 (P=0.039), 0.247 (P=0.169) mmHg in the tube shape conduit and by 0.112 (P=0.062), 0.270 (P=0.024), 0.232 (P=0.170) mmHg in the bifurcated conduit. For Patient 2, the pressure drops between the IVC and the SVC, LPA, and RPA reduced by 0.073 (P=0.141), −0.047 (P=0.447) and 0.066 (P=0.395) mmHg in the tube-shaped conduit. The pressure changes predicted by the CFD simulations were comparable to those measured in vitro for both patients.
Electrospun Optimized Grafts
For the two patients, the native geometry, optimized tube-shaped graft and bifurcated biodegradable grafts were successfully manufactured using electrospinning on 3D printed stainless steel mandrels. The grafts easily detached from the mandrel and in case of the bifurcated graft, the mandrel was disassembled using the pinned design before removal. Figure 7 shows pairs of manufactured electrospun vascular grafts and stainless-steel mandrels.
Figure 7.

Pairs of 3D printed mandrels and electrospun biodegradable grafts (white). The pinned three-part design of the mandrel for bifurcated grafts can be seen on the right.
Discussion
The surgical management of the single ventricle is a classic demonstration of the current unmet clinical need for customized, patient-specific grafts in congenital cardiac surgery. Although many surgical textbooks show similar illustrations on how to perform the Fontan procedure, in reality, the significant variability in cardiac anatomy means that there is no true stereotyped approach to manage complex heart disease. Furthermore, using grafts of a standard shape without taking into account patient-specific anatomy may lead to an unequal distribution of hepatic blood flow across the left and right pulmonary arteries with the formation of pulmonary arteriovenous malformations.16 A suboptimal Fontan geometry would also lead to unnecessary power loss and increased workload on the single ventricle heart, hastening the onset of heart failure.17 In this way, virtual surgery has enormous potential in designing an optimal graft geometry before congenital cardiac surgery,18 and specifically in our case, improve HFD and reduce Ploss in Fontan patients as shown in this study.
The use of CFD in the design of Fontan geometries has previously been reported.19,20 The key differences in our study include an integrative and collaborative approach from image data acquisition to graft design and manufacturing and use of in vitro testing to support our simulation data. Additionally, the incorporation of TEVGs provided us with increased degrees of freedom for graft design. The integrated approach, in particular, was crucial in the translation of TEVGs into a clinical application. We have previously demonstrated our ability to create patient-specific tissue engineered vascular grafts using 3D printing and electrospinning technology12 for straight IVC conduits. In this paper, we demonstrate the ability to manufacture TEVGs for patient specific Fontan geometries as well. Our previous experience with electrospinning and using 3D printed mandrels allowed us to account for the technical boundaries with the 3D printing technology and provided feedback into the feasibility of printing out certain conduit designs. The recognition of these boundaries provided us useful feedback during the design of patient-specific Fontan conduits, in addition to the Ploss and HFD parameters measured.
Patient-specific 3D designs have been applied successfully in other surgical specialties, such as orthopedic surgery,21 orthognathic surgery and craniomaxillofacial surgery.22 The differences between these surgical fields and the cardiovascular field include the following: 1) the need for suitable graft material with similar compliance to native vessels and biocompatibility with blood; 2) design optimization based on dynamic parameters as opposed to static and relatively immobile boundary conditions; 3) and the need for consistent and accurate flow parameters provided by cardiac MRI sequences. Each represents a unique step and challenge in the use of 3D printing in the cardiovascular field. With an integrative and collaborative approach between the imaging clinicians, the engineers responsible for CFD and graft manufacturing, and the cardiovascular surgeon, these challenges can be addressed and overcome in order to bring patient-specific graft designs into the cardiovascular field.
One of the limitations of this present study is the low number of patients. In the establishment of this integrative approach, significant time and effort was spent developing an optimization strategy (Figure 2) and validation of the CFD solver by in vivo and in vitro methods. We intend to apply this approach to other types of Fontan geometries. Despite the small number of patients, it was observed that the benefit of custom-made vs. standard graft can differ between patients, which emphasizes the need for patient–specific solution to identify the best suited strategy on an individual basis. Additionally, our optimization strategy also focused only on Ploss and HFD; surrogates for platelet activation as well as low flow regions and areas of low wall shear stress (WSS) to assess the susceptibility to thrombosis will be included in future work. Future work will include refining the simulation framework (e.g. to account for pulsatile flow and model exercise conditions) to further determine the significance of the results. We are planning to perform larger sets of in vitro flow-loop comparisons with electrospun grafts to further validate our simulation results. We will also conduct mechanical testing of the patient-specific grafts for burst pressure and suture strength. Finally, there are currently no animal models which are suitable for a long-term Fontan study and, consequently, a lack of long term validation of the CFD using in vivo experiments via animal models. A feasible animal study would be constrained on short-term outcomes, anastomoses results and form retention properties of electrospun grafts. Therefore, future work will include large animal models with RV-PA venous structures to provide further pre-clinical supporting data before clinical application.
In conclusion, we have demonstrated a workflow allowing not only for the optimization of the Fontan pathway in silico, but also for the manufacture of the thus-optimized conduits. Although further computational, experimental and animal testing are warranted, this works lays down the first concrete step to make “virtual surgical planning” a surgical reality.
Central Message.
3D electrospinning carries large potential for implementing patient specific solutions in the Fontan arena: allowing for the “printing” of grafts optimized in silico for hemodynamic performance
Central Picture.
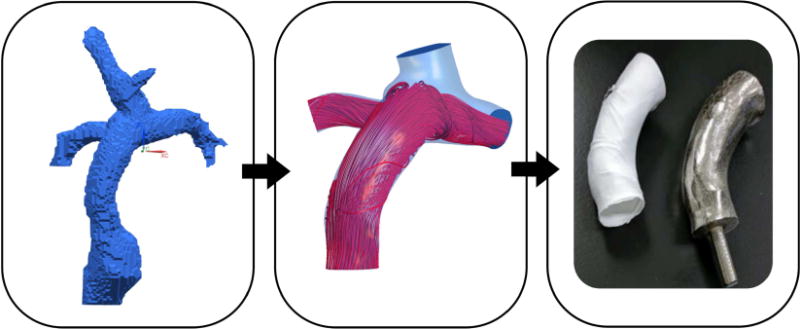
Virtual cardiac surgery with patient specific graft design, optimization, and validation.
Perspective Statement.
Ideal patient specific conduit design is important for complex congenital cardiac surgery. Our integrated approach including image segmentation, computer aided design based on flow simulations, patient specific optimization, and manufacturing of a custom graft has the potential to improve the surgical result.
Acknowledgments
This work was supported by the Eunice Kennedy Shriver National Institute of Child Health and Human Development of the National Institutes of Health under award number R21HD090671. The content is solely the responsibility of the authors and does not necessarily represent the official views of the National Institutes of Health.
The authors gratefully acknowledge the financial support provided by the Swiss National Science Foundation (grant 200021_147193 CINDY) and the NCCR Kidney.CH.
Conflict of interest statement and source of funding: Authors Johnson, Hibino, Krieger are inventors on US Patent App 62/209,990, which is related to this work. The work is supported in part by NIH/NICHD R21HD090671. The graft materials were provided by Nanofiber Solutions.
Abbreviation Table
- 3D
Three dimensional
- 2D
Two dimensional
- CFD
Computational fluid dynamics
- CHD
Congenital heart disease
- CMR
Cardiovascular magnetic resonance
- Ploss
Power loss
- HFD
Hepatic flow distribution
- MR
Magnetic resonance
- STL
Stereo Lithography
- SVC
Superior Vena Cava
- IVC
Inferior Vena Cava
- RPA
Right Pulmonary Artery
- LPA
Left Pulmonary Artery
Footnotes
Publisher's Disclaimer: This is a PDF file of an unedited manuscript that has been accepted for publication. As a service to our customers we are providing this early version of the manuscript. The manuscript will undergo copyediting, typesetting, and review of the resulting proof before it is published in its final citable form. Please note that during the production process errors may be discovered which could affect the content, and all legal disclaimers that apply to the journal pertain.
Justification for large number of authors: Multidisciplinary and multi-national collaboration.
References
- 1.John AS. Fontan Repair of Single Ventricle Physiology. Cardiol Clin. 2015;33:559–569. doi: 10.1016/j.ccl.2015.07.010. [DOI] [PubMed] [Google Scholar]
- 2.Jonas RA. The Intra/Extracardiac Conduit Fenestrated Fontan. Semin Thorac Cardiovasc Surg Pediatr Card Surg Annu. 2011;14:11–18. doi: 10.1053/j.pcsu.2011.01.010. [DOI] [PubMed] [Google Scholar]
- 3.Marsden AL, et al. Evaluation of a novel Y-shaped extracardiac Fontan baffle using computational fluid dynamics. J Thorac Cardiovasc Surg. 2009;137:394–403.e2. doi: 10.1016/j.jtcvs.2008.06.043. [DOI] [PubMed] [Google Scholar]
- 4.Pundi KN, et al. 40-Year Follow-Up After the Fontan Operation. J Am Coll Cardiol. 2015;66:1700–1710. doi: 10.1016/j.jacc.2015.07.065. [DOI] [PubMed] [Google Scholar]
- 5.Atz AM, et al. Longitudinal Outcomes of Patients? With?Single Ventricle After?the?Fontan?Procedure. J Am Coll Cardiol. 2017;69:2735–2744. doi: 10.1016/j.jacc.2017.03.582. [DOI] [PMC free article] [PubMed] [Google Scholar]
- 6.Khiabani RH, et al. Exercise capacity in single-ventricle patients after Fontan correlates with haemodynamic energy loss in TCPC. Heart. 2015;101:139–143. doi: 10.1136/heartjnl-2014-306337. [DOI] [PubMed] [Google Scholar]
- 7.Tang E, et al. Effect of Fontan geometry on exercise haemodynamics and its potential implications. Heart. 2017 doi: 10.1136/heartjnl-2016-310855. heartjnl-2016-310855. [DOI] [PubMed] [Google Scholar]
- 8.Pike NA, Vricella LA, Feinstein JA, Black MD, Reitz BA. Regression of severe pulmonary arteriovenous malformations after Fontan revision and ? hepatic factor? rerouting. Ann Thorac Surg. 2004;78:697–699. doi: 10.1016/j.athoracsur.2004.02.003. [DOI] [PubMed] [Google Scholar]
- 9.Yang W, Chan FP, Reddy VM, Marsden AL, Feinstein JA. Flow simulations and validation for the first cohort of patients undergoing the Y-graft Fontan procedure. J Thorac Cardiovasc Surg. 2015;149:247–255. doi: 10.1016/j.jtcvs.2014.08.069. [DOI] [PubMed] [Google Scholar]
- 10.de Zélicourt DA, Kurtcuoglu V. Patient-Specific Surgical Planning, Where Do We Stand? The Example of the Fontan Procedure. Ann Biomed Eng. 2016;44:174–186. doi: 10.1007/s10439-015-1381-9. [DOI] [PubMed] [Google Scholar]
- 11.Yang W, et al. Hepatic blood flow distribution and performance in conventional and novel Y-graft Fontan geometries: A case series computational fluid dynamics study. J Thorac Cardiovasc Surg. 2012;143:1086–1097. doi: 10.1016/j.jtcvs.2011.06.042. [DOI] [PubMed] [Google Scholar]
- 12.Fukunishi T, et al. Preclinical study of patient-specific cell-free nanofiber tissue-engineered vascular grafts using 3-dimensional printing in a sheep model. J Thorac Cardiovasc Surg. 2017;153:924–932. doi: 10.1016/j.jtcvs.2016.10.066. [DOI] [PMC free article] [PubMed] [Google Scholar]
- 13.de Zélicourt DdeJ. Pulsatile Fontan Hemodynamics and patient-specific surgical planning: A numerical Investigation. Georgia Institute of Technology; 2010. [Google Scholar]
- 14.Yang W, Chan FP, Reddy VM, Marsden AL, Feinstein JA. Flow simulations and validation for the first cohort of patients undergoing the Y-graft Fontan procedure. J Thorac Cardiovasc Surg. 2015;149:247–255. doi: 10.1016/j.jtcvs.2014.08.069. [DOI] [PubMed] [Google Scholar]
- 15.Ochsner G, et al. A novel interface for hybrid mock circulations to evaluate ventricular assist devices. IEEE Trans Biomed Eng. 2013;60:507–516. doi: 10.1109/TBME.2012.2230000. [DOI] [PubMed] [Google Scholar]
- 16.Duncan BW, Desai S. Pulmonary arteriovenous malformations after cavopulmonary anastomosis. Ann Thorac Surg. 2003;76:1759–1766. doi: 10.1016/s0003-4975(03)00450-8. [DOI] [PubMed] [Google Scholar]
- 17.Haggerty CM, Whitehead KK, Bethel J, Fogel MA, Yoganathan AP. Relationship of Single Ventricle Filling and Preload to Total Cavopulmonary Connection Hemodynamics. Ann Thorac Surg. 2015;99:911–917. doi: 10.1016/j.athoracsur.2014.10.043. [DOI] [PMC free article] [PubMed] [Google Scholar]
- 18.Ong CS, et al. Virtual Surgery for Conduit Reconstruction of the Right Ventricular Outflow Tract. World J Pediatr Congenit Heart Surg. 2017;8:391–393. doi: 10.1177/2150135117692777. [DOI] [PMC free article] [PubMed] [Google Scholar]
- 19.Tang E, Yoganathan AP. Optimizing hepatic flow distribution with the Fontan Y-graft: Lessons from computational simulations. J Thorac Cardiovasc Surg. 2015;149:255–256. doi: 10.1016/j.jtcvs.2014.09.094. [DOI] [PubMed] [Google Scholar]
- 20.Yang W, Feinstein JA, Shadden SC, Vignon-Clementel IE, Marsden AL. Optimization of a Y-Graft Design for Improved Hepatic Flow Distribution in the Fontan Circulation. J Biomech Eng. 2012;135 doi: 10.1115/1.4023089. 011002-011002-12. [DOI] [PubMed] [Google Scholar]
- 21.Hoang D, Perrault D, Stevanovic M, Ghiassi A. Surgical applications of three-dimensional printing: a review of the current literature & how to get started. Ann Transl Med. 2016;4 doi: 10.21037/atm.2016.12.18. [DOI] [PMC free article] [PubMed] [Google Scholar]
- 22.Jacobs CA, Lin AY. A New Classification of Three-Dimensional Printing Technologies: Systematic Review of Three-Dimensional Printing for Patient-Specific Craniomaxillofacial Surgery. Plast Reconstr Surg. 2017;139:1211–1220. doi: 10.1097/PRS.0000000000003232. [DOI] [PubMed] [Google Scholar]


