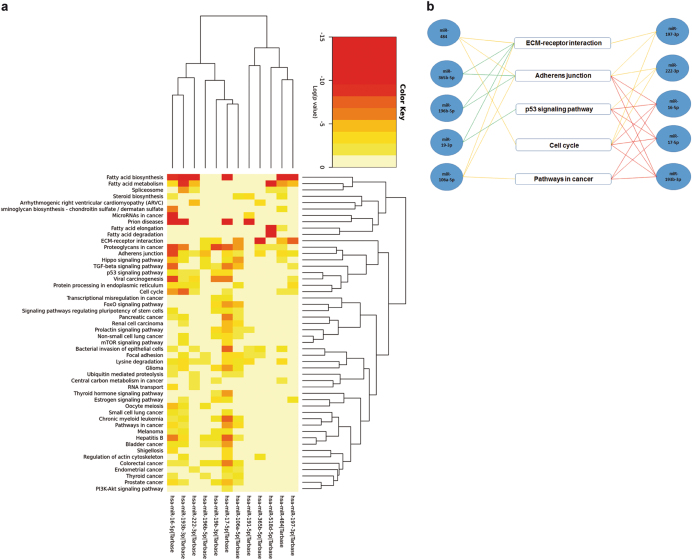
Fig. 8.
miR/pathway heat map representation and KEGG pathways—miRNA network. a Meta-analysis algorithm of the most significant pathways targeted by miR-222-3p, miR-16-5p, miR-484, miR-17-5p, miR-106a-5p, miR-365b-5p, miR-196b-5p, miR-19b-3p, miR-197-3p, miR-193b-3p, miR-518d-5p and miR-191-5p. Relevant correlation with the following pathways was found; cell cycle pathway (p-value = 9.55−11), adherens junction (p-value = 1.0−325), pathway in cancer (p-value = 1.9−8), ECM receptor interaction (p-value = 1.0−325) and p53 signaling pathway (p-value = 1.27−8). (Image from DIANA-miRpath software). Color notation identifies Log (p-value). b Representative scheme of DIANA miRpath analysis between miRs and correlated pathways. miRs were linked with pathways by lines of different colors. Red lines: miRs involved in 4 pathways; yellow lines: miRs involved in 3 pathways; green lines: miRs involved in two pathways

