

Summary
Background
With its increasing incidence, nonalcoholic fatty liver disease (NAFLD) is of particular concern in the Veterans Health Administration (VHA).
Aims
To evaluate risk factors for advanced fibrosis in biopsy-proven NAFLD in the VHA, to identify patients at risk for adverse outcomes.
Methods
In randomly selected cases from VHA databases (2005-2015), we performed a retrospective case-control study in adults with biopsy-defined NAFLD or normal liver.
Results
Of 2091 patients reviewed, 399 met inclusion criteria. Normal controls (n = 65) had normal liver function. The four NAFLD cohorts included: NAFL steatosis (n = 76), nonalcoholic steatohepatitis (NASH) without fibrosis (n = 68), NAFLD/NASH stage 1-3 fibrosis (n = 82), and NAFLD/NASH cirrhosis (n = 70). NAFLD with hepatocellular carcinoma (HCC) was separately identified (n = 38). Most patients were older White men. NAFLD patients with any fibrosis were on average severely obese (BMI>35 kg/m2). Diabetes (54.4%-79.6%) and hypertension (85.8%-100%) were more common in NAFLD with fibrosis or HCC. Across NAFLD, 12.3%-19.5% were enrolled in diet/exercise programs and 0%-2.6% had bariatric surgery. Hispanics exhibited higher rates of NASH (20.6%), while Blacks had low NAFLD rates (1.4%-11.8%), particularly NAFLD cirrhosis and HCC (1.4%-2.6%). Diabetes (OR 11.8, P < .001) and BMI (OR 1.4, P < .001) were the most significant predictors of advanced fibrosis.
Conclusions
In the VHA, diabetes and severe obesity increased risk for advanced fibrosis in NAFLD. Of these patients, only a small proportion (~20%) had enrolled in diet/exercise programs or had bariatric surgery (~2%). These results suggest that providers should focus/tailor interventions to improve outcomes, particularly in those with diabetes and severe obesity.
1. INTRODUCTION
In comparison to the general US population, obesity rates are higher among Veterans.1 Due to high rates of obesity and metabolic syndrome, non-alcoholic fatty liver disease (NAFLD) affects nearly 1 in 3 Americans and is now the leading cause of chronic liver disease.2 A recent Veterans Health Administration (VHA) study reported a nearly 3-fold increase in NAFLD prevalence between 2003 and 2011, with more than 1 in 5 patients at high risk for advanced fibrosis.3 In the US, NAFLD is currently the third most common chronic liver disease cause for liver transplantation and continues to increase.4 In the VHA, NAFLD is also the third most common disease associated with hepatocellular carcinoma (HCC), even in the absence of cirrhosis.5 VHA leadership has targeted NAFLD as an emerging challenge.6
NAFLD encompasses a disease spectrum ranging from simple steatosis or non-alcoholic fatty liver (NAFL), to non-alcoholic steatohepatitis (NASH) (i.e. steatosis with hepatocellular injury) with or without fibrosis, cirrhosis and disease complicated by HCC,7 in the absence of alcohol and secondary causes of hepatic fat accumulation. In validated NAFLD scoring systems, fibrosis stage ranges from absent (stage 0) to cirrhosis (stage 4).7,8 In paired-biopsy studies of fibrosis progression, both NAFL and NASH progress, yet fibrosis is much more prevalent and progressive in NASH.9 Identification of NASH and high histologic NAFLD Activity Score do not predict overall mortality.10 Advanced fibrosis (stage 3-4) is the most important predictor of NAFLD overall mortality and liver-related events.2,10-13
In addition to the importance of fibrosis, racial and ethnic differences in NAFLD must be evaluated. Relative to Whites, Hispanic patients exhibit a significantly higher prevalence of NAFLD, while Blacks have a lower prevalence.14 While predominantly comprised of older White men, the VHA patient population includes approximately 10% women, 12% Blacks, 6% Hispanics and 4% other ethnicities.15,16 Contributing to racial disparities in NAFLD, the VHA population of women, Blacks, Hispanics and other ethnicities are projected to double by 2040.15
Additional risk factors for NAFLD fibrosis progression include older age, male gender, and components of the metabolic syndrome, such as central obesity, hypertension, insulin resistance, and dyslipidemia.8 Unfortunately, NAFLD/NASH often advances unnoticed to cirrhosis due to low awareness of patients at risk for progression.17 To enhance early interventions, it is critical to identify NAFLD earlier and to better characterise its risk factors for disease progression. Veterans have unique exposures (e.g. Agent Orange), as well as high rates of smoking and depression, which may affect NAFLD progression.18 Due to its growing burden, NAFLD identification and risk stratification is particularly important in the VHA.
As the largest US integrated health system, the VHA could potentially improve patient outcomes with a wide-scale NAFLD clinical management program, categorising patients by risk. To accomplish this, VHA-specific risk factors for NAFLD and advanced fibrosis must be evaluated to better characterise patients at risk for adverse NAFLD outcomes, particularly liver cancer, need for liver transplantation, and death. Liver biopsy accurately assesses NAFLD fibrosis stage.14 In this study, we evaluated and characterised risk factors for advanced fibrosis in biopsy-proven NAFLD, using VHA administrative databases.
2. MATERIALS AND METHODS
2.1. Study design and data source
We performed a retrospective case-control study using nationally representative data from the VHA Corporate Data Warehouse (CDW), available on the VHA Informatics and Computing Infrastructure (VINCI) platform. CDW contains VHA electronic medical record data such as outpatient and inpatient utilisation with related diagnostic and procedure codes, radiologic, biopsy, pharmacy and laboratory data, as well as the Alcohol use disorders identification test -Alcohol consumption questions (AUDIT-C).19 The Durham Veterans affairs (VA) Medical Center and the VA Ann Arbor Healthcare System Institutional Review Boards approved this study protocol.
2.2. Patient population
Identified in the CDW, the study population included adults ( ≥ 18 years) who had a liver biopsy during January 2005 to September 2015. If the patient met inclusion criteria, the first liver biopsy during this study window was selected as the index biopsy. As only 36 of 399 (9.0%) of patients had more than one biopsy during the study period, only the index biopsy data is presented. Using ICD-9 codes and laboratory results from 1-year prior to the index biopsy, patients with the following conditions were excluded: alcoholic liver disease, alpha-1-antitrypsin deficiency, autoimmune hepatitis, drug-induced liver injury, hemochromatosis, hepatitis B or C, primary biliary cholangitis, primary sclerosing cholangitis, and Wilson’s disease. Patients with excess alcohol use were excluded by ICD-9 codes for alcohol dependence and abuse, as well as by AUDIT-C scores ≥3 for women and ≥4 for men.3,20
We developed a DatStat IllumeTM data collection platform survey (Data S1, S2) to record available histologic data defining NAFLD activity using a validated scale from the index liver biopsy report.7 Laboratory tests, select medications, anthropometric data, and comorbidity data within 1 year prior to index liver biopsy were also recorded, as well as liver imaging reports within 1 year before or after the index liver biopsy. Most liver biopsies were obtained percutaneously, with either ultrasound or CT guidance. Liver biopsies were reviewed by local pathologists only. To be included in the study group, all NAFLD (without HCC) and most control liver biopsies (see description of controls below) were ≥15 mm (and of median size ≥22 mm) and had fibrosis clearly staged.7 A liver biopsy of ≥15 mm was required to most accurately detect fibrosis and NASH.21,22 Based on the pathologist’s interpretation, we divided NAFLD patients into four histological groups: NAFL, NASH without fibrosis, NAFLD/NASH stage 1-3 fibrosis, and NAFLD/NASH cirrhosis.
For control category inclusion, two groupings were required to achieve sufficient numbers: (1) Healthy normal liver on histology that exhibited no fibrosis, steatosis ≤5%, or inflammation (aside from trivial or rare) and size ≥15 mm; and (2) Normal liver histology adjacent to metastatic cancer, haemangioma or other benign lesion in which some liver parenchyma specimens were ≤15 mm (Of note, no significant differences were seen between the two control groups, including features of the metabolic syndrome, body mass index and ethnicity). All controls exhibited normal liver function (albumin, INR and total bilirubin) and had no evidence of steatosis or fibrosis on available liver imaging. The NAFLD with HCC samples also included liver parenchyma specimens of length ≤15 mm.
For all patients, we recorded comorbidities in the year prior to the liver biopsy including diabetes (defined by ICD-9 code, known diabetic medication, fasting glucose ≥126 mg/dL or HbA1c≥6.5%, diabetic complications by ICD-9 code such as diabetic neuropathy and retinopathy), hypertension (defined by ICD-9 code or antihypertensive medication), and metabolic syndrome (defined by ICD-9 code or three or more of the following findings: (1) hypertension or anti-hypertensive medication, (2) hypertriglyceridemia as defined as fasting triglycerides ≥150 mg/dL or fibrates, or niacin for treatment of hypertriglyceridemia (3) dyslipidemia as defined as HDL cholesterol <40 mg/dL [males] or <50 mg/dL [females] or treatment of low HDL with statins or fibrates and (4) fasting glucose >100 mg/dL or treatment with diabetes medications). Other comorbidities defined by ICD-9 code included sleep disorder, obstructive sleep apnea, asthma, chronic obstructive pulmonary disease (COPD), sleep-related hypoxaemia, obesity hypoventilation syndrome, depression, anxiety, Agent Orange exposure, HIV infection, congestive heart failure, coronary artery disease, vitamin D deficiency, hypothyroidism and chronic kidney disease. We included laboratory data within 1 year before the liver biopsy, with results most proximal to the liver biopsy recorded. Laboratory data included aspartate aminotransferase (AST), alanine aminotransferase (ALT), total bilirubin, direct bilirubin, alkaline phosphatase, ferritin, albumin, glycosylated hemoglobin (HbA1c), high-density lipoprotein (HDL), low-density lipoprotein (LDL), triglycerides, total cholesterol, hemoglobin, platelet count and international normalised ratio (INR). Demographic data included ethnicity and anthropomorphic data included body mass index (BMI, kg/m2). History of tobacco use was captured by chart review.
2.3. Chart abstraction
Chart abstraction was conducted by four hepatologists [YAP, LMG, CMH and CAM]. To assess consistency among the abstractors, we created a training dataset of 12 cases spanning the NAFLD disease range. All data was collected in a DatStat IllumeTM survey (Data S1, S2). We found >90% agreement of case categorisation before initiating abstraction on the full dataset. When discrepancies in diagnosis occurred, the abstractors discussed differences to improve consistency in future cases. During case abstraction, weekly team meetings were held to address questions.
Following satisfactory completion of the training sample, case abstractors conducted chart abstraction on a randomly selected sample of patients with liver biopsies who met inclusion criterion from the CDW dataset. The goal was to identify 60 patients in each category. Because of potential missing data on laboratory results or other covariates, we increased the quota to allow up to 82 patients per category. Because of the low proportion of patients with HCC, we were unable to fulfill the quota (in the 2091 cases reviewed, we identified 38 cases of NAFLD with HCC). We terminated case abstractions when all control and NAFLD non-HCC groupings were completed.
2.4. Statistical analysis
Baseline characteristics of the control group and each successive NAFLD phenotype were adjusted for sex, race/ethnicity, age, and BMI and were compared using analysis of variance for continuous variables and logit regression for dichotomous variables. A Bonfer-roni correction was used to correct for multiplicity by dividing the alpha (0.05) by the number of comparisons being made in each table. For angiotensin-converting enzyme (ACE) inhibitors and angiotensin II receptor blockers (ARBs), the frequency of use was obtained in the subset of each group with hypertension and/or diabetes. For Vitamin E supplementation, the frequency of use was obtained in the subset of each group without diabetes. Because NAFLD/NASH with HCC phenotype may occur in any of the NAFLD phenotypes (from simple steatosis to cirrhosis),5 baseline characteristics of this group were compared to controls.
A multinomial logistic regression was performed with NAFLD phenotype as the outcome and controls (i.e. absence of NAFLD) serving as the reference group. Predictor variables included age, ethnicity (White non-Hispanic, Black non-Hispanic, Hispanic, other), BMI, diabetes mellitus, hypertension, dyslipidemia, platelets, AST/ ALT ratio, hypertriglyceridemia and smoking status (current, prior or never smoker). These variables were determined by pathophysiologic relevance, evidence in earlier NAFLD models,11,23,24 and distribution in our dataset. Model predictors also included the components of metabolic syndrome: hypertension, diabetes mellitus and BMI (as a surrogate for obesity). Given the NAFLD histology range observed and low case numbers, NAFLD patients with HCC were excluded. Statistical analyses were performed using Stata 15 (STATACORP LLC, College Station, TX, USA). Coefficients from the multinomial logistic regression were exponentiated to provide the generalised odds ratio. The generalised odds ratio provides a measure of how the probability of being in NAFLD category j (i.e. NAFLD steatosis, NASH without fibrosis, NAFLD/NASH with Stage 1-3 fibrosis, and NAFLD/ NASH cirrhosis) versus being in the control condition (j = 1) for a given value of X (e.g. has diabetes, White-non-Hispanic, etc.) differs for a 1 unit increase in X.
As a sensitivity analysis, a multinomial logistic regression was also performed on a sample limited to White American patients.
3. RESULTS
Of the 2091 patients reviewed, 399 met all inclusion criteria and were included in the final analyses (Figure 1). Patients were primarily excluded due to the absence of fibrosis grading, biopsy size <15 mm, and possible non-NAFLD diagnoses. In all NAFLD groups (excluding HCC), the median biopsy size was 22-25 mm. Demographic and anthropometric data (Table 1) revealed that most patients were older White men with mean age across the groups significantly increasing with advancing fibrosis stage. On average, while the controls were overweight (BMI>25 kg/m2), those with NAFL and NASH without fibrosis were obese (BMI>30 kg/m2), and NAFLD patients with any degree of fibrosis were severely obese (BMI>35 kg/m2). A statistically significant association existed between NAFLD category and ethnicity. Among those without fibrosis, a lower proportion of Black patients were included in the NASH group relative to the NAFL group (2.9% vs. 11.8%). In contrast, a higher proportion of Hispanic patients (20.6%) were observed in the NASH group than either NAFL or NAFLD fibrosis. Hispanic patients were also significantly younger (n= 31; mean age 49.7 ± 10.4) compared to non-Hispanics (n = 368, mean age 56.8 ± 12.1). In the NAFLD and HCC group, 12 patients had underlying NAFL, one patient had NASH without fibrosis, seven patients had NAFLD/NASH stage 1-3 fibrosis, and 13 patients had NAFLD/NASH cirrhosis.
FIGURE 1.
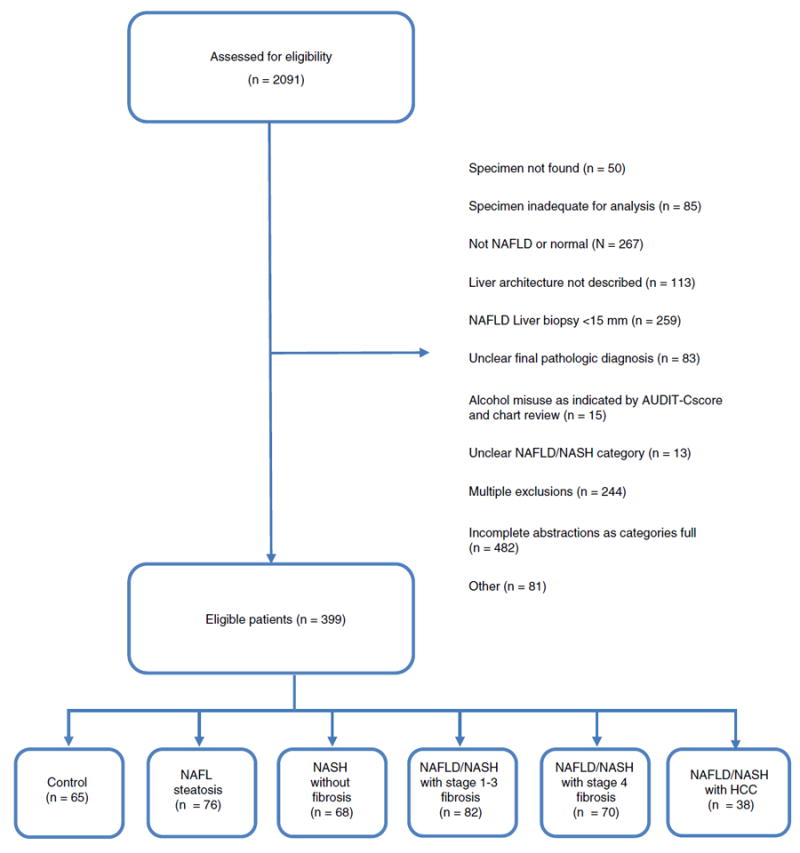
Flow diagram
TABLE 1.
Demographics by NAFLD Category
| Control (n = 65) | NAFL Steatosis (n = 76) | NASH without Fibrosis (n = 68) | NAFLD/NASH with Stage 1-3 Fibrosis (n = 82) | NAFLD/NASH Cirrhosis (n = 70) | NAFLD/NASH HCC (n = 38) | |
|---|---|---|---|---|---|---|
| Age (years ± SE) | 56.7 ± 1.3 | 52.4 ± 1.2a | 49.5 ± 1.3a | 54.3 ± 1.2a | 61.2 ± 1.3ab | 70.6 ± 1.7ab |
| Male (%) | 73.8 | 88.2a | 83.8 | 84.2 | 91.4 | 100ab |
| BMI (kg/m2 ± SE) | 28.3 ± 0.7 | 33.9 ± 0.7ab | 32.7 ± 0.7 | 36.8 ± 0.6ab | 35.9 ± 0.7 | 32.1 ± 0.9ab |
| Race/Ethnicity (%) | ||||||
| White | 63.1 | 72.4 | 67.6 | 69.5 | 82.9a | 94.7ab |
| Black | 23.1 | 11.8 | 2.9a | 9.8 | 1.4a | 2.6ab |
| Asian | 1.5 | 2.6 | 0ab | 1.2ab | 5.7 | 0ab |
| Hispanic | 4.6 | 5.3 | 20.6a | 8.5a | 2.9 | 2.6 |
| Other | 7.7 | 7.9 | 8.8 | 11.0 | 7.1 | 0ab |
All comparisons made between adjacent ordinal groupings (i.e. control vs NAFL, NAFL vs NASH without fibrosis, etc.). The superscripts ‘a’ and ‘b’ denote statistically significant differences between that category and the category to the left. An exception is that the NAFLD/NASH with HCC is compared to the control group.
Statistical significance key: unadjusted P < .05.
Statistical significance key: adjusted for multiplicity P < .00147.
Analysis of comorbidities across the NAFLD spectrum (Table 2) demonstrated that the prevalence of diabetes mellitus increased as fibrosis stage increased with 53.8%, 66.3% and 79.6% in NASH without fibrosis, NASH with fibrosis, and cirrhosis respectively. A similar pattern was seen for hypertension, with high rates in NAFLD/NASH with fibrosis, cirrhosis, and HCC (85.8%-100%). The proportion of patients with metabolic syndrome generally increased with NAFLD severity, affecting only 23.9% of controls, about half of those with NAFL or NASH without fibrosis, and 64.7%-83.8% of NAFLD/NASH with fibrosis, cirrhosis, or HCC. Depression (30.3%-37.8%) was prevalent but not statistically significantly different across comparison groups.
TABLE 2.
Comorbidities and Medication use
| Comorbidity (%) | Control (n = 65) | NAFL Steatosis (n = 76) | NASH without Fibrosis (n = 68) | NAFLD/NASH with Stage 1-3 Fibrosis (n = 82) | NAFLD/NASH Cirrhosis (n = 70) | NAFLD/NASH HCC (n = 38) |
|---|---|---|---|---|---|---|
| Diabetes Mellitus | 22.54 | 37.19 | 53.79 | 66.28 | 79.60 | 54.36b |
| Hypertension | 84.73 | 75.75 | 75.29 | 85.84 | 94.32 | 100.00b |
| Metabolic syndrome | 23.92 | 52.67b | 58.88 | 70.55 | 83.82 | 64.73bc |
| Hypertriglyceridemia | 23.64 | 54.03b | 76.32b | 62.27 | 60.20 | 44.45 |
| Dyslipidemia | 65.65 | 84.65b | 89.75 | 87.21 | 97.09b | 86.25 |
| Coronary artery disease | 12.06 | 4.11 | 8.26 | 9.38 | 14.81 | 11.12 |
| Hypothyroidism | 10.32 | 12.35 | 10.12 | 11.04 | 18.93 | 8.28 |
| Depression | 31.84 | 30.26 | 36.05 | 36.51 | 31.92 | 37.81 |
| Vitamin D deficiency | 18.79 | 20.81 | 22.98 | 23.37 | 13.58 | 19.99 |
| COPD | 16.30 | 3.76b | 1.70 | 6.06 | 10.23 | 5.11 |
| Asthma | 10.76 | 4.36 | 15.19b | 6.33 | 2.52 | 7.33 |
| Obstructive sleep apnea | 18.10 | 28.36 | 25.72 | 29.36 | 18.15 | 13.26 |
| Ever tobacco use | 48.38 | 53.44 | 66.85 | 60.27 | 60.06 | 53.67 |
| Current tobacco use | 22.19 | 19.17 | 28.04 | 20.35 | 28.48 | 25.68 |
| Previous tobacco use | 20.72 | 32.10 | 36.37 | 38.02 | 29.80 | 25.08 |
| Diet/exercise program | 21.39 | 15.05 | 14.02 | 12.33 | 19.47 | 18.51 |
| Beta blocker | 30.72 | 16.63 | 23.60 | 20.30 | 48.07bc | 31.93 |
| Statin | 42.28 | 55.00 | 53.44 | 51.79 | 46.38 | 37.27 |
| ACE inhibitora | 34.34 | 42.06 | 36.15 | 38.94 | 49.04 | 48.25 |
| ARBa | 1.58 | 5.37 | 6.61 | 20.85b | 10.12 | 5.23 |
Means are adjusted for age, BMI, sex, ethnicity. All comparisons made between adjacent ordinal groupings (i.e. control vs NAFL, NAFL vs NASH without fibrosis, etc.). Statistical tests are corrected for multiplicity using the Bonferroni method. The superscripts ‘b’ and ‘c’ denote statistically significant differences between that category and the category to the left. An exception is that the NAFLD/NASH with HCC is compared to the control group.
Of those with diabetes and/or hypertension.
Statistical significance key: unadjusted P < .05.
Statistical significance key: adjusted for multiplicity P < .00051.
We then examined the effects of toxicologic, pharmacologic and other exposures on NAFLD progression. We found no association of Agent Orange exposure (0%-4.3%) or HIV (0%-2.4%) with any NAFLD category (data not shown). In all NAFLD groups, diet and exercise program use (12.3%-19.5%) was uncommon, as was bariatric surgery (0%-2.6%, data not shown). Tobacco use was generally similar across NAFLD categories. Vitamin D deficiency (13.6%-23.4%) was not associated with any NAFLD category. Vitamin E supplement use (≤10.0%) was infrequent amongst non-diabetic NAFLD patients (data not shown). Across all NAFLD groups, thiazolidinedione (pioglitazone and rosiglitazone) treatment was uncommon (<7.2%; data not shown). Used in variceal bleeding prophylaxis, beta-blockers were prescribed more commonly in NAFLD cirrhotics compared to patients with NAFLD/NASH with fibrosis. Statin use (≥37.3%) was common in all groups. Of those patients with hypertension and/or diabetes, an ACE-inhibitor or ARB was prescribed in >58% of NAFLD patients with any degree of fibrosis.
We evaluated liver imaging in all patients. Liver ultrasound was the most common imaging modality performed for all patients with NAFL/NASH, except in those with HCC, for whom the CT scan was the most frequently performed (Table 3). In those with NAFLD and cirrhosis, 95.8% had 1 or more liver imaging studies (with an average of 2.8 ± 1.7 imaging tests) within 1 year of liver biopsy.
TABLE 3.
Imaging by NAFLD Category
| (%) | Control (n = 65) (%) | NAFL Steatosis (n = 76) (%) | NASH without Fibrosis (n = 68) (%) | NAFLD/NASH with Stage 1-3 Fibrosis (n = 82) (%) | NAFLD/NASH Cirrhosis (n = 70) (%) | NAFLD/NASH (%) HCC (n = 38) (%) |
|---|---|---|---|---|---|---|
| Liver Ultrasound | 44.6 | 67.1 | 61.8 | 68.3 | 77.1 | 50.0 |
| CT scan of Abdomen | 53.9 | 43.4 | 35.3 | 46.3 | 65.7 | 94.7 |
| MRI of Abdomen | 20.0 | 6.6 | 8.8 | 7.3 | 20.0 | 47.4 |
| At least 1 Imaging Modality performed | 87.7 | 90.8 | 76.5 | 86.6 | 95.8 | 100 |
In examining laboratory values across study groups, mean ALT was higher in patients with NASH without fibrosis (76.4 U/L), relative to NAFL steatosis (55.7 U/L) or controls (36.8 U/L) (Table 4). Mean bilirubin and INR were significantly increased in NAFLD cirrhosis or HCC, relative to the control group. Relative to controls (129.5 mg/dL), mean triglycerides were elevated in patients with NAFL (193.2 mg/dL) and patients with NASH without fibrosis (261.3 mg/dL). In NAFLD cirrhosis, the mean platelet count was notably low (with a mean of 152.0 × 10⁹/L) yet the mean albumin was within the normal range.
TABLE 4.
Laboratories by NAFLD category
| Control (n = 65) | NAFL Steatosis (n = 76) | NASH without Fibrosis (n = 68) | NAFLD/NASH with Stage 1-3 Fibrosis (n = 82) | NAFLD/NASH Cirrhosis (n = 70) | NAFLD/NASH HCC (n = 38) | |
|---|---|---|---|---|---|---|
| Alkaline phosphatase (U/L) | 83.8 ± 7.1 | 77.4 ± 5.8 | 79.3 ± 6.4 | 83.8 ± 5.7 | 88.9 ± 6.3 | 139.5 ± 9.3ab |
| AST (U/L) | 27.1 ± 3.9 | 38.4 ± 3.3a | 46.8 ± 3.6 | 54.6 ± 3.2 | 60.3 ± 3.6 | 54.7 ± 5.1ab |
| ALT (U/L) | 36.8 ± 5.3 | 55.7 ± 4.4a | 76.4 ± 4.8ab | 79.3 ± 4.3 | 69.5 ± 4.7 | 57.0 ± 6.8a |
| Total bilirubin (mg/dL) | 0.7 ± 0.1 | 0.6 ± 0.1 | 0.7 ± 0.1 | 0.6 ± 0.1 | 0.8 ± 0.1ab | 0.8 ± 0.1 |
| HbA1c (%) | 6.2 ± 0.3 | 6.4 ± 0.2 | 6.7 ± 0.2 | 7.1 ± 0.2 | 7.4 ± 0.2 | 6.8 ± 0.3 |
| HDL (mg/dL) | 48.2 ± 1.6 | 40.9 ± 1.3ab | 37.9 ± 1.4 | 37.6 ± 1.3 | 34.7 ± 1.4 | 35.0 ± 2.1ab |
| LDL (mg/dL) | 105.8 ± 5.7 | 107.1 ± 4.4 | 108.0 ± 5.1 | 103.4 ± 4.3 | 91.8 ± 4.9 | 107.6 ± 7.1 |
| Cholesterol (mg/dL) | 179.6 ± 6.5 | 182.8 ± 5.1 | 194.7 ± 5.7 | 180.1 ± 5.0 | 162.9 ± 5.5a | 171.7 ± 8.1 |
| Triglycerides (mg/dL) | 129.5 ± 21.1 | 193.2 ± 16.6a | 261.3 ± 17.9a | 223.7 ± 16.1 | 198.8 ± 17.8 | 164.5 ± 25.9 |
| Hemoglobin (g/dL) | 14.0 ± 0.2 | 14.5 ± 0.2 | 14.3 ± 0.2 | 14.5 ± 0.2 | 14.0 ± 0.2a | 13.7 ± 0.3 |
| INR | 1.00 ± 0.02 | 1.00 ± 0.01 | 1.00 ± 0.01 | 1.02 ± 0.01 | 1.13 ± 0.01ab | 1.06 ± 0.02a |
| Platelets ( × 109/L) | 224.1 ± 8.7 | 221.9 ± 7.5 | 231.0 ± 8.1 | 214.1 ± 7.3 | 152.0 ± 8.0ab | 213.4 ± 11.3 |
| Albumin (g/L) | 4.1 ± 0.1 | 4.3 ± 0.1a | 4.2 ± 0.1 | 4.2 ± 0.1 | 4.0 ± 0.1a | 3.8 ± 0.1a |
The table displays the mean ± standard error. Means are adjusted for age, BMI, sex, and ethnicity. All comparisons made between adjacent ordinal groupings (i.e. control vs NAFL, NAFL vs NASH without fibrosis, etc.). Statistical tests are corrected for multiplicity using the Bonferroni method. The superscripts ‘a’ and ‘b’ denote statistically significant differences between that category and the category to the left. An exception is that the NAFLD/ NASH with HCC is compared to the control group.
HbA1c missing in 41% (163/399). All other variables missing less than 12% (maximum 48/399).
Statistical significance key: unadjusted P < .05.
Statistical significance key: adjusted for multiplicity P < .0038.
The multinomial regression analysis revealed that men, relative to women, had a 3.84 (95% CI, 1.04-14.13) increased odds of being in the NAFL steatosis group than in the control group (Table 5). Relative to White non-Hispanic patients, Hispanic patients were 18.52 (95% CI, 1.79-192.0) times more likely to be in the NASH without fibrosis group than the control group. Higher BMI was associated with a higher odds of being in each of the NAFLD categories relative to the controls. A unit increase in BMI was associated with a 28% to a 40% increase in the odds of being in a NAFLD category relative to the control group. Patients with diabetes had a fourfold increase in the odds of being in the NASH without fibrosis group relative to the control group, an eightfold increase in the odds of being in the NAFLD/NASH with fibrosis group relative to the control group, and nearly 12-fold increase in being in the NAFLD/NASH with cirrhosis group relative to the control group. Patients with hypertension had lower odds of being in the NAFL group, the NASH without fibrosis group, or the NAFLD/NASH with fibrosis group than being in the control group. Relative to patients without hypertriglyceridaemia, patients with hypertriglyceridemia had a higher odds of being in the NAFL group, the NASH without fibrosis group, or the NAFLD/NASH with fibrosis group than being in the control group. When a multinomial logistic regression was performed in White Americans only, all findings remained significant and of consistent magnitude with the overall analysis.
TABLE 5.
Multinomial logistic regression results
| NAFL Steatosis Generalised odds ratio (95% C.I.) | NASH without Fibrosis Generalised odds ratio (95% C.I.) | NAFLD/NASH with Stage 1-3 Fibrosis Generalised odds ratio (95% C.I.) | NAFLD/NASH Cirrhosis Generalised odds ratio (95% C.I.) | |
|---|---|---|---|---|
| Age (continuous) | 1.006 (0.958-1.058) | 0.986 (0.935-1.040) | 1.004 (0.952-1.059) | 1.000 (0.939-1.064) |
| Male | 3.841a (1.044-14.13) | 3.065 (0.789-11.91) | 1.485 (0.401-5.507) | 2.067 (0.390-10.94) |
| Black non-Hispanic | 0.739 (0.181-3.012) | 0.308 (0.045-2.106) | 0.852 (0.188-3.859) | 0.131 (0.011-1.566) |
| Hispanic | 3.831 (0.345-42.52) | 18.52a (1.787-192.0) | 6.066 (0.531-69.23) | 1.022 (0.058-18.04) |
| Non-White Other | 6.564a (1.016-42.41) | 6.769 (0.967-47.39) | 10.64a (1.581-71.58) | 27.83b (3.330-232.5) |
| BMI (continuous) | 1.333c (1.188-1.496) | 1.282c (1.139-1.443) | 1.403c (1.247-1.578) | 1.372c (1.210-1.554) |
| Diabetes Mellitus | 2.497 (0.763-8.174) | 4.075a (1.186-14.00) | 8.268c (2.452-27.88) | 11.78c (2.913-49.36) |
| Hypertension | 0.263a (0.082-0.850) | 0.227a (0.066-0.783) | 0.486a (0.132-1.787) | 1.027 (0.133-7.911) |
| Dyslipidemia | 2.070 (0.621-6.893) | 2.088 (0.523-8.329) | 1.958 (0.541-7.081) | 15.51 (0.979-245.7) |
| Platelets (continuous) | 0.999 (0.992-1.007) | 1.002 (0.994-1.010) | 0.997 (0.989-1.005) | 0.979c (0.969-0.989) |
| AST/ALT Ratio (continuous) | 0.112b (0.021-0.584) | 0.043b (0.065-0.289) | 0.062b (0.010-0.390) | 2.141 (0.374-12.26) |
| Hypertriglyceridemia | 2.976a (1.013-8.739) | 7.841c (2.438-25.21) | 3.956a (1.311-11.94) | 3.161 (0.937-10.66) |
| Current tobacco | 0.655 (0.193-2.230) | 1.597 (0.415-6.140) | 0.431 (0.114-1.631) | 0.656 (0.137-3.148) |
| Previous tobacco | 0.722 (0.192-2.720) | 1.778 (0.409-7.730) | 0.764 (0.195-2.989) | 0.602 (0.126-2.880) |
| Unknown tobacco | 0.303 (0.062-1.483) | 0.935 (0.175-5.000) | 0.195 (0.037-1.043) | 0.365 (0.057-2.326) |
Generalised odds ratio with 95% CI in parentheses. Reference category for the dependent variable is control group.
Statistical significance key: P < .05.
Statistical significance key: P < .01.
Statistical significance key: P < .001. Omitted: Never smoked and White Non-Hispanic.
4. DISCUSSION
In our retrospective case-control VHA study of nearly 400 patients with well-characterised control and NAFLD liver biopsies, we found that predictors for advanced NAFLD fibrosis among these veterans were diabetes mellitus, body mass index, AST/ALT ratio, and hypertriglyceridemia. In this predominantly White male population, more than two of three patients with NAFLD fibrosis or HCC exhibited diabetes mellitus, hypertension or metabolic syndrome. The proportion of Hispanic veterans with NASH was notable. We did not find an effect of smoking or depression on NAFLD progression.
While all NAFLD categories exhibited obesity, severe obesity was observed in NAFLD with advanced fibrosis/cirrhosis. A 5%-10% weight loss is effective in improving NAFLD steatosis and necroinflammation.14 Despite the high prevalence of diabetes and severe obesity in VHA patients with advanced NAFLD, less than 1 in 5 were enrolled in diet or exercise programs and only approximately 1 in 40 had bariatric surgery. In the VHA, the increasing incidence of NAFLD3 and high prevalence of obesity1 suggest the value of broad preventive measures for obesity, diabetes, and NAFLD. For example, in pre-diabetics coached by exercise trainers on exercise and diet, the cost-effective diabetes prevention program (DPP) successfully yielded an average 7% weight loss and 58% decrease in the incidence of diabetes in a racially diverse population.25,26 In a VHA pilot study of DPP, preliminary findings revealed promising weight loss.27 Among nearly 1800 VHA patients undergoing Roux-en-Y gastric bypass surgery for severe obesity compared to nonsurgical matched patients, a 21% weight loss was sustained at a 10 year follow-up.28 Bariatric surgery has been reported to decrease NASH and NAFLD fibrosis.29 While NAFLD can improve with weight loss, few patients received obesity interventions, yet most had multidisciplinary care (e.g. Primary Care, GI/Hepatology, Endocrinology, Cardiology, etc.). This suggests the need for creative new NAFLD solutions, such as a Healthy Lifestyles Clinic led by dieticians and exercise coaches to enhance nutrition and physical activity. To catalyze health behavior changes, providers can collaborate with veterans on action plans,30,31 provide education, and address barriers. Sustained behavioral change is generally socially rooted. In veterans with diabetes, peer support groups significantly improved glycemic control, particularly among those with initially low medication adherence.32 To maximise convenience and use, clinics could be onsite, virtual, or community-based. While the Veterans Choice Program enables community-based care, close VHA collaboration will be needed. A VHA-based care model for NAFLD would ultimately seek to improve outcomes by optimizing communication with the patient and all providers, enhance access to clinical trials, and promote systematic data collection to aid in large-scale research endeavours.
Without interventions to address obesity and diabetes, NAFLD may progress to cirrhosis and HCC. HCC can even develop in non-cirrhotic liver, as we observed in this study. In our NAFLD population, we noted high rates of liver imaging, particularly in cirrhotic patients-in whom nearly all had liver imaging within a year of their biopsy diagnosis, likely for HCC screening. Although our numbers were limited, our NAFLD and HCC group reflected the NAFLD spectrum-from steatosis to cirrhosis, as earlier observed in the VHA.5 Particularly in the presence of obesity and diabetes, HCC arises in association with underlying inflammation, oxidative stress, lipid peroxidation, apoptosis and liver regeneration, and patatin like phospholipase domain containing 3 (PNPLA3) GG genotype (rs738409).33,34 Relative to Whites, the PNPLA3 GG genotype is most prevalent in Hispanics and least prevalent in Blacks34-36; this variant is associated with susceptibility to necroinflammation and fibrosis.35
The prevalence of diabetes is 1.7-fold higher in Hispanics and Blacks, relative to Whites in the US.37 In the VHA, minority populations are projected to increase.16 Our study aligns with earlier findings revealing health disparities in NAFLD, with a higher prevalence reported in Hispanics37 and a lower prevalence in Blacks.14 In our study, Hispanics experienced a 6-fold or higher odds of being in the NAFLD with fibrosis or NASH groups. This suggests value in maximising inclusion of the VHA Hispanic population in NAFLD prevention and treatment measures. Hispanics comprised 20% of the NASH group, and had a lower prevalence among those with cirrhosis or NAFLD with HCC. This unexpected finding is likely due to the younger average age of Hispanics in our study, relative to non-Hispanics. With population aging and the projected doubling of the VHA Hispanic population, higher rates of advanced NAFLD fibrosis and HCC are anticipated in Hispanic patients in future VHA studies.
Paralleling our study, earlier NAFLD studies report diabetes mellitus to be a significant predictor of advanced hepatic fibrosis, even in predominantly female populations.38 Similarly, other studies examining liver biopsies report the prevalence of metabolic syndrome or BMI increase with NAFLD progression,39 and an increasing AST/ALT ratio elevates risk of NAFLD cirrhosis.11,23 Hypertriglyceridemia has also been reported as a risk factor for NASH,40 and was found to increase the risk of NAFL, NASH, and NAFLD with fibrosis in our study. In contrast to some,41,42 but not all earlier studies2,43,44 reporting a positive association with smoking, we found no association of smoking and NAFLD progression.
While liver biopsy is termed the “gold standard” for NAFLD diagnosis,14 it is encumbered by morbidity and sampling variability.21,45 Hence, NAFLD fibrosis is increasingly quantified by safe noninvasive measures: clinical prediction rules,8,46,47 such as the validated NAFLD fibrosis score,12 transient elastography, and magnetic resonance elastography. Furthermore, while a VHA study of natural history of NAFLD could further refine our understanding of risk factors, such a study is becoming increasingly challenging with the move to fewer liver biopsies and more noninvasive follow-up of NAFLD patients.48 Our study therefore complements innovative VHA electronic medical record (EMR) algorithms developed and validated to identify NAFLD patients with ALT elevations.3,49 Application of these NAFLD algorithms in the VHA has informed NAFLD epidemiologic trends over time.3 The NAFLD fibrosis score11 has been demonstrated to stratify low-and high-risk NAFLD patients for intervention more cost-effectively than liver biopsy.47 Further modeling of our data may enable VHA-customised EMR algorithms to potentially enable “real time” identification of NAFLD patients at highest risk of advanced fibrosis for immediate intervention and triage to specialist care.
Utilising another systemic approach, the VHA has very successfully used patient registries to identify and track patients for intervention and treatment.50 While approved NAFLD pharmacologic treatments are not yet available, potential treatments are progressing.51 Our findings reveal the VHA NAFLD population to be similar to NAFLD populations in earlier non-veteran studies,6,16,27-29 suggesting its suitability for testing promising therapeutics. With the low current rates of NAFLD intervention, creation of NAFLD registries may identify patients at risk for disease progression, and enhance VHA clinical care and research.6
Strengths of our study include its use of adequately sized liver biopsies well-phenotyped for NAFLD and fibrosis, randomly selected from a national sample, extensive data of potential relevance to NAFLD progression in the VHA (e.g. Agent Orange exposure, smoking history, and alcohol use), racially diverse population, and consistency of chart abstraction. Comprised of patients with normal liver biopsies and without known liver disease, our control group was similar in age and gender to the NAFLD patients in our analysis. In controls and cases, we broadly examined comorbidities, exposures, or medications that might influence NAFLD pathobiology.
Our study is limited by selection bias. We only included patients with biopsy-proven NAFLD or normal liver, and patients subjected to biopsy may not be representative of the overall VHA population. Reflecting the VHA population, our study population was predominantly male and has limited generalisability to the larger NAFLD population as females more frequently develop NASH.52 Some patients were enrolled in clinical trials at academic centers, which may have introduced bias or affected the racial/ethnic composition. Liver biopsies were reviewed by local pathologists; no centralised study pathologist review was performed. This limitation was ameliorated by our stringent histologic inclusion criteria and 22 mm median biopsy size enabling accurate fibrosis staging. As liver ultrasound may be less sensitive for HCC surveillance in obesity,53 we may have missed some HCC (however, this was mitigated by CT or MRI imaging in nearly half of all patients). To maximise data quality, we excluded many cases with ambiguous, incomplete or inadequate histologic data. Although recorded when available, we found low rates of Agent Orange exposure and incomplete data on the number of pack years smoked, which limited our analyses.
As the leading cause of chronic liver disease in the US, NAFLD is of increasing clinical concern in the VHA.3 In our national VHA study, we characterised NAFLD and identified risk factors for advanced fibrosis. We found that features associated with NASH and advanced fibrosis in our veterans were nearly identical to the non-veteran population. For example, diabetes and BMI best predicted advanced fibrosis, Hispanics were more likely to have NASH, Blacks exhibited low rates of NAFLD and advanced fibrosis, and current or prior tobacco use had no significant impact on NAFLD progression. Despite severe obesity and high rates of comorbidity, patients with NAFLD fibrosis were seldom enrolled in a diet or exercise program, and very uncommonly had bariatric surgery. To better identify patients and track behavioral and lifestyle interventions, a NAFLD registry could prove useful. Alternatively, use of “real-time” electronic medical record algorithms at point of care may enhance VHA care. Our findings can now be applied to better tailor NAFLD screening, categorisation, and treatment in the VHA.
Supplementary Material
Acknowledgments
The authors wish to thank Ayako Suzuki, George Ioannou, Folasade P. May, Joseph R. Pisegna, Michael Lewis, Grace L. Su, Akbar K. Waljee, Wing-Kin Syn, Akshay Shetty, M.D. Kay Washington, Clare M. Haystead, Mustafa R. Bashir and Rendon C. Nelson for valuable input to the design of this analysis, Meghan O’Leary for developing our initial DatStat Illume™ survey for case abstraction, and Teresa Day’s research assistance.
Declaration of personal interests: none.
Declaration of funding interests: This study was funded in part by resources from the VA Cooperative Studies Program Epidemiology Center in Durham, and the VA Ann Arbor Healthcare Systems. This study was funded in part by the National Institutes of Health (NIH), grant number 5T32DK007568-25.
Funding information
National Institute for Health Research, Grant/Award Number: 5T32DK007568-25; Durham VA Cooperative Studies Program Epidemiology Center
APPENDIX
AUTHORS’ COMPLETE AFFILIATIONS
Yuval A. Patel, Department of Medicine, Duke University Medical Center and Durham Veterans Administration Medical Center, Durham, NC, USA; Elizabeth J. Gifford, Sanford School of Public Policy, Duke University, Durham, NC, USA; Lisa M. Glass, Department of Medicine, University of Michigan and VA Ann Arbor Healthcare Systems, Ann Arbor, MI, USA; Rebecca McNeil, RTI International, Durham, NC, USA; Marsha J. Turner, Cooperative Studies Program Epidemiology Center, Durham Veterans Administration Medical Center, Durham, NC, USA; Byungjoo Han, Cooperative Studies Program Epidemiology Center, Durham Veterans Administration Medical Center, Durham, NC, USA; Dawn Provenzale, Department of Medicine, Duke University Medical Center and Director, Cooperative Studies Program Epidemiology Center, Durham Veterans Administration Medical Center, Durham, NC, USA; Steve S. Choi, Department of Medicine, Duke University Medical Center and Durham Veterans Administration Medical Center, Durham, NC, USA; Cynthia A. Moylan, Department of Medicine, Duke University Medical Center and Durham Veterans Administration Medical Center, Durham, NC, USA; Christine M. Hunt, Department of Medicine, Duke University Medical Center and Cooperative Studies Program Epidemiology Center, Durham Veterans Administration Medical Center, Durham, NC, USA.
Footnotes
AUTHORSHIP
Guarantor of the article: Dr. Christine Hunt
Author contributions: YP contributed to research design, data acquisition, data analysis, data interpretation, and drafted the paper. All authors approved the final version of the article. EG contributed to research design, data analysis, data interpretation, and critical draft revision. LG contributed to research design, data acquisition, data interpretation, and critical draft revision. RM contributed to research design, data analysis, data interpretation, and critical draft revision. MT contributed to research design, data acquisition, data interpretation, and critical draft revision. BH contributed to research design, data acquisition, data interpretation, and critical draft revision. DP contributed to research design, data analysis, data interpretation, and critical draft revision. SS contributed to research design, data analysis, data interpretation, and critical draft revision. CM contributed to research design, data acquisition, data interpretation, and critical draft revision. CH contributed to research design, data acquisition, data analysis, data interpretation, and critical draft revision. All authors approved the final version of the article.
DISCLAIMERS
The views expressed in this paper are those of the authors and do not necessarily reflect the position or policy of the Department of Veterans Asffairs or the United States government.
SUPPORTING INFORMATION
Additional Supporting Information will be found online in the supporting information tab for this article.
ORCID
Y. A. Patel http://orcid.org/0000-0002-4362-3983
C. M. Hunt http://orcid.org/0000-0002-6874-8889
References
- 1.Fryar CD, Herrick K, Afful J, Ogden CL. Cardiovascular disease risk factors among male veterans, U.S., 2009-2012. Am J Prev Med. 2016;50:101–105. doi: 10.1016/j.amepre.2015.06.011. [DOI] [PMC free article] [PubMed] [Google Scholar]
- 2.Le MH, Devaki P, Ha NB, et al. Prevalence of non-alcoholic fatty liver disease and risk factors for advanced fibrosis and mortality in the United States. PLoS ONE. 2017;12:e0173499. doi: 10.1371/journal.pone.0173499. [DOI] [PMC free article] [PubMed] [Google Scholar]
- 3.Kanwal F, Kramer JR, Duan Z, Yu X, White D, El-Serag HB. Trends in the burden of nonalcoholic fatty liver disease in a United States cohort of veterans. Clin Gastroenterol Hepatol. 2016;14:301–308. e1–2. doi: 10.1016/j.cgh.2015.08.010. [DOI] [PMC free article] [PubMed] [Google Scholar]
- 4.Goldberg D, Ditah IC, Saeian K, et al. Changes in the prevalence of hepatitis C virus infection, nonalcoholic steatohepatitis, and alcoholic liver disease among patients with cirrhosis or liver failure on the waitlist for liver transplantation. Gastroenterology. 2017;152:1090–1099. e1. doi: 10.1053/j.gastro.2017.01.003. [DOI] [PMC free article] [PubMed] [Google Scholar]
- 5.Mittal S, El-Serag HB, Sada YH, et al. Hepatocellular carcinoma in the absence of cirrhosis in United States veterans is associated with nonalcoholic fatty liver disease. Clin Gastroenterol Hepatol. 2016;14:124–131. e1. doi: 10.1016/j.cgh.2015.07.019. [DOI] [PMC free article] [PubMed] [Google Scholar]
- 6.O’Leary TJ, Dominitz JA, Chang KM. Veterans affairs office of research and development: research programs and emerging opportunities in digestive diseases research. Gastroenterology. 2015;149:1652–1661. doi: 10.1053/j.gastro.2015.10.021. [DOI] [PMC free article] [PubMed] [Google Scholar]
- 7.Kleiner DE, Brunt EM, van Natta M, et al. Design and validation of a histological scoring system for nonalcoholic fatty liver disease. Hepatology (Baltimore, MD) 2005;41:1313–1321. doi: 10.1002/hep.20701. [DOI] [PubMed] [Google Scholar]
- 8.Rinella ME. Nonalcoholic fatty liver disease: a systematic review. JAMA. 2015;313:2263–2273. doi: 10.1001/jama.2015.5370. [DOI] [PubMed] [Google Scholar]
- 9.Singh S, Allen AM, Wang Z, Prokop LJ, Murad MH, Loomba R. Fibrosis progression in nonalcoholic fatty liver vs nonalcoholic steatohepatitis: a systematic review and meta-analysis of paired-biopsy studies. Clin Gastroenterol Hepatol. 2015;13:643–654. doi: 10.1016/j.cgh.2014.04.014. quiz e39-40. [DOI] [PMC free article] [PubMed] [Google Scholar]
- 10.Ekstedt M, Hagstrom H, Nasr P, et al. Fibrosis stage is the strongest predictor for disease-specific mortality in NAFLD after up to 33 years of follow-up. Hepatology (Baltimore, MD) 2015;61:1547–1554. doi: 10.1002/hep.27368. [DOI] [PubMed] [Google Scholar]
- 11.Angulo P, Hui JM, Marchesini G, et al. The NAFLD fibrosis score: a noninvasive system that identifies liver fibrosis in patients with NAFLD. Hepatology (Baltimore, MD) 2007;45:846–854. doi: 10.1002/hep.21496. [DOI] [PubMed] [Google Scholar]
- 12.Angulo P, Kleiner DE, Dam-Larsen S, et al. Liver fibrosis, but no other histologic features, is associated with long-term outcomes of patients with nonalcoholic fatty liver disease. Gastroenterology. 2015;149:389–397. e10. doi: 10.1053/j.gastro.2015.04.043. [DOI] [PMC free article] [PubMed] [Google Scholar]
- 13.Dulai PS, Singh S, Patel J, et al. Increased risk of mortality by fibrosis stage in nonalcoholic fatty liver disease: systematic review and meta-analysis. Hepatology (Baltimore, MD) 2017;65:1557–1565. doi: 10.1002/hep.29085. [DOI] [PMC free article] [PubMed] [Google Scholar]
- 14.Chalasani N, Younossi Z, Lavine JE, et al. The diagnosis and management of non-alcoholic fatty liver disease: practice guideline by the American association for the study of liver diseases, American college of gastroenterology, and the American gastroenterological association. Hepatology (Baltimore, MD) 2012;55:2005–2023. doi: 10.1002/hep.25762. [DOI] [PubMed] [Google Scholar]
- 15.Veterans Administration. Veteran Population Projections: FY2010 to FY2040. [June 14 2017]; http://www.va.gov/vetdata/docs/QuickFacts/Population_quickfacts.pdf.
- 16.US Department of Veterans Affairs. National Center for Veterans Analysis and Statistics. Washington, DC: DVA; 2015. Available at: http://www.va.gov/vetdata. [Google Scholar]
- 17.Ratziu V, Cadranel JF, Serfaty L, et al. A survey of patterns of practice and perception of NAFLD in a large sample of practicing gastroenterologists in France. J Hepatol. 2012;57:376–383. doi: 10.1016/j.jhep.2012.03.019. [DOI] [PubMed] [Google Scholar]
- 18.Youssef NA, Abdelmalek MF, Binks M, et al. Associations of depression, anxiety and antidepressants with histological severity of nonalcoholic fatty liver disease. Liver Int. 2013;33:1062–1070. doi: 10.1111/liv.12165. [DOI] [PubMed] [Google Scholar]
- 19.Lapham GT, Achtmeyer CE, Williams EC, Hawkins EJ, Kivlahan DR, Bradley KA. Increased documented brief alcohol interventions with a performance measure and electronic decision support. Med Care. 2012;50:179–187. doi: 10.1097/MLR.0b013e3181e35743. [DOI] [PubMed] [Google Scholar]
- 20.Using AUDIT-C Alcohol Screening Data in VA Research: Interpretation, Strengths, Limitations, & Sources. 2015 Jan; Available at: http://www.hsrd.research.va.gov/for_researchers/cyber_seminars/archives/vci-031511.pdf.
- 21.Vuppalanchi R, Unalp A, van Natta ML, et al. Effects of liver biopsy sample length and number of readings on sampling variability in non-alcoholic Fatty liver disease. Clin Gastroenterol Hepatol. 2009;7:481–486. doi: 10.1016/j.cgh.2008.12.015. [DOI] [PMC free article] [PubMed] [Google Scholar]
- 22.McPherson S, Hardy T, Henderson E, Burt AD, Day CP, Anstee QM. Evidence of NAFLD progression from steatosis to fibrosing-steatohepatitis using paired biopsies: implications for prognosis and clinical management. J Hepatol. 2015;62:1148–1155. doi: 10.1016/j.jhep.2014.11.034. [DOI] [PubMed] [Google Scholar]
- 23.Bazick J, Donithan M, Neuschwander-Tetri BA, et al. Clinical model for NASH and advanced fibrosis in adult patients with diabetes and NAFLD: guidelines for referral in NAFLD. Diabetes Care. 2015;38:1347–1355. doi: 10.2337/dc14-1239. [DOI] [PMC free article] [PubMed] [Google Scholar]
- 24.McPherson S, Hardy T, Dufour JF, et al. Age as a confounding factor for the accurate non-invasive diagnosis of advanced NAFLD fibrosis. Am J Gastroenterol. 2017;112:740–751. doi: 10.1038/ajg.2016.453. [DOI] [PMC free article] [PubMed] [Google Scholar]
- 25.Knowler WC, Barrett-Connor E, Fowler SE, et al. Reduction in the incidence of type 2 diabetes with lifestyle intervention or metformin. N Engl J Med. 2002;346:393–403. doi: 10.1056/NEJMoa012512. [DOI] [PMC free article] [PubMed] [Google Scholar]
- 26.Diabetes Prevention Program Research Group. The 10-year cost-effectiveness of lifestyle intervention or metformin for diabetes prevention: an intent-to-treat analysis of the DPP/DPPOS. Diabetes Care. 2012;35:723–730. doi: 10.2337/dc11-1468. [DOI] [PMC free article] [PubMed] [Google Scholar]
- 27.Damschroder L. Diabetes Prevention Program (DPP) Translation in VA Health Services Research & Development. [January 5, 2017]; Available at: https://www.hsrd.research.va.gov/for_researchers/cyber_seminars/archives/video_archive.cfm?SessionID=1266.
- 28.Maciejewski ML, Arterburn DE, van Scoyoc L, et al. Bariatric surgery and long-term durability of weight loss. JAMA Surg. 2016;151:1046–1055. doi: 10.1001/jamasurg.2016.2317. [DOI] [PMC free article] [PubMed] [Google Scholar]
- 29.Lassailly G, Caiazzo R, Buob D, et al. Bariatric surgery reduces features of nonalcoholic steatohepatitis in morbidly obese patients. Gastroenterology. 2015;149:379–388. doi: 10.1053/j.gastro.2015.04.014. quiz e15-6. [DOI] [PubMed] [Google Scholar]
- 30.Leventhal H, Leventhal EA, Breland JY. Cognitive science speaks to the “common-sense” of chronic illness management. Ann Behav Med. 2011;41:152–163. doi: 10.1007/s12160-010-9246-9. [DOI] [PubMed] [Google Scholar]
- 31.Rodriguez V, Andrade AD, Garcia-Retamero R, et al. Health literacy, numeracy, and graphical literacy among veterans in primary care and their effect on shared decision making and trust in physicians. J Health Commun. 2013;18:273–289. doi: 10.1080/10810730.2013.829137. [DOI] [PMC free article] [PubMed] [Google Scholar]
- 32.Fisher EB, Coufal MM, Parada H, et al. Peer support in health care and prevention: cultural, organizational, and dissemination issues. Ann Rev Public Health. 2014;35:363–383. doi: 10.1146/annurev-publhealth-032013-182450. [DOI] [PubMed] [Google Scholar]
- 33.Starley BQ, Calcagno CJ, Harrison SA. Nonalcoholic fatty liver disease and hepatocellular carcinoma: a weighty connection. Hepatology (Baltimore, MD) 2010;51:1820–1832. doi: 10.1002/hep.23594. [DOI] [PubMed] [Google Scholar]
- 34.Hassan MM, Kaseb A, Etzel CJ, et al. Genetic variation in the PNPLA3 gene and hepatocellular carcinoma in USA: risk and prognosis prediction. Mol Carcinog. 2013;52:E139–E147. doi: 10.1002/mc.22057. [DOI] [PMC free article] [PubMed] [Google Scholar]
- 35.Sookoian S, Pirola CJ. Meta-analysis of the influence of I148M variant of patatin-like phospholipase domain containing 3 gene (PNPLA3) on the susceptibility and histological severity of nonalcoholic fatty liver disease. Hepatology (Baltimore, MD) 2011;53:1883–1894. doi: 10.1002/hep.24283. [DOI] [PubMed] [Google Scholar]
- 36.Romeo S, Kozlitina J, Xing C, et al. Genetic variation in PNPLA3 confers susceptibility to nonalcoholic fatty liver disease. Nat Genet. 2008;40:1461–1465. doi: 10.1038/ng.257. [DOI] [PMC free article] [PubMed] [Google Scholar]
- 37.Saab S, Manne V, Nieto J, Schwimmer JB, Chalasani NP. Nonalcoholic fatty liver disease in Latinos. Clin Gastroenterol Hepatol. 2016;14:5–12. doi: 10.1016/j.cgh.2015.05.001. quiz e9-10. [DOI] [PubMed] [Google Scholar]
- 38.Angulo P, Keach JC, Batts KP, Lindor KD. Independent predictors of liver fibrosis in patients with nonalcoholic steatohepatitis. Hepatology (Baltimore, MD) 1999;30:1356–1362. doi: 10.1002/hep.510300604. [DOI] [PubMed] [Google Scholar]
- 39.Hossain N, Afendy A, Stepanova M, et al. Independent predictors of fibrosis in patients with nonalcoholic fatty liver disease. Clin Gastroenterol Hepatol. 2009;7:1224–1229. e1–2. doi: 10.1016/j.cgh.2009.06.007. [DOI] [PubMed] [Google Scholar]
- 40.Bambha K, Belt P, Abraham M, et al. Ethnicity and nonalcoholic fatty liver disease. Hepatology (Baltimore, MD) 2012;55:769–780. doi: 10.1002/hep.24726. [DOI] [PMC free article] [PubMed] [Google Scholar]
- 41.Zein CO, Unalp A, Colvin R, Liu YC, McCullough AJ. Smoking and severity of hepatic fibrosis in nonalcoholic fatty liver disease. J Hepatol. 2011;54:753–759. doi: 10.1016/j.jhep.2010.07.040. [DOI] [PMC free article] [PubMed] [Google Scholar]
- 42.Wu P, Hua Y, Tan S, Li M, Yongxiang S, Fang G. Interactions of smoking with rs833061 polymorphism on the risk of non-alcoholic fat liver disease in Hubei Han population: a preliminary case-control study. Iran J Basic Med Sci. 2015;18:1112–1117. [PMC free article] [PubMed] [Google Scholar]
- 43.Younossi ZM, Stepanova M, Afendy M, et al. Changes in the prevalence of the most common causes of chronic liver diseases in the United States from 1988 to 2008. Clin Gastroenterol Hepatol. 2011;9:524–530. e1. doi: 10.1016/j.cgh.2011.03.020. quiz e60. [DOI] [PubMed] [Google Scholar]
- 44.Shen H, Peng JL, Tayarachakul S, Liangpunsakul S. Association between serum cotinine level and prevalence of non-alcoholic fatty liver disease: a cross-sectional study from the Third national health and nutrition examination survey. J Investig Med. 2017;65:43–48. doi: 10.1136/jim-2016-000213. [DOI] [PMC free article] [PubMed] [Google Scholar]
- 45.Bedossa P. Utility and appropriateness of the fatty liver inhibition of progression (FLIP) algorithm and steatosis, activity, and fibrosis (SAF) score in the evaluation of biopsies of nonalcoholic fatty liver disease. Hepatology (Baltimore, MD) 2014;60:565–575. doi: 10.1002/hep.27173. [DOI] [PubMed] [Google Scholar]
- 46.Cui J, Ang B, Haufe W, et al. Comparative diagnostic accuracy of magnetic resonance elastography vs eight clinical prediction rules for non-invasive diagnosis of advanced fibrosis in biopsy-proven non-alcoholic fatty liver disease: a prospective study. Aliment Pharmacol Ther. 2015;41:1271–1280. doi: 10.1111/apt.13196. [DOI] [PMC free article] [PubMed] [Google Scholar]
- 47.Tapper EB, Sengupta N, Hunink MG, Afdhal NH, Lai M. Cost-effective evaluation of nonalcoholic fatty liver disease with NAFLD fibrosis score and vibration controlled transient elastography. Am J Gastroenterol. 2015;110:1298–1304. doi: 10.1038/ajg.2015.241. [DOI] [PubMed] [Google Scholar]
- 48.Tapper EB, Lok AS. Use of liver imaging and biopsy in clinical practice. N Engl J Med. 2017;377:756–768. doi: 10.1056/NEJMra1610570. [DOI] [PubMed] [Google Scholar]
- 49.Husain N, Blais P, Kramer J, et al. Nonalcoholic fatty liver disease (NAFLD) in the Veterans administration population: development and validation of an algorithm for NAFLD using automated data. Aliment Pharmacol Ther. 2014;40:949–954. doi: 10.1111/apt.12923. [DOI] [PMC free article] [PubMed] [Google Scholar]
- 50.Backus LI, Belperio PS, Shahoumian TA, Loomis TP, Mole LA. Real-world effectiveness of ledipasvir/sofosbuvir in 4365 treatment-naive, genotype 1 hepatitis C-infected patients. Hepatology (Baltimore, MD) 2016;64:405–414. doi: 10.1002/hep.28625. [DOI] [PubMed] [Google Scholar]
- 51.Armstrong MJ, Gaunt P, Aithal GP, et al. Liraglutide safety and efficacy in patients with non-alcoholic steatohepatitis (LEAN): a multicentre, double-blind, randomised, placebo-controlled phase 2 study. Lancet (London, England) 2016;387:679–690. doi: 10.1016/S0140-6736(15)00803-X. [DOI] [PubMed] [Google Scholar]
- 52.Neuschwander-Tetri BA, Clark JM, Bass NM, et al. Clinical, laboratory and histological associations in adults with nonalcoholic fatty liver disease. Hepatology (Baltimore, MD) 2010;52:913–924. doi: 10.1002/hep.23784. [DOI] [PMC free article] [PubMed] [Google Scholar]
- 53.Wong LL, Reyes RJ, Kwee SA, Hernandez BY, Kalathil SC, Tsai NC. Pitfalls in surveillance for hepatocellular carcinoma: how successful is it in the real world? Clin Mol Hepatol. 2017;23:239–248. doi: 10.3350/cmh.2017.0008. [DOI] [PMC free article] [PubMed] [Google Scholar]
Associated Data
This section collects any data citations, data availability statements, or supplementary materials included in this article.