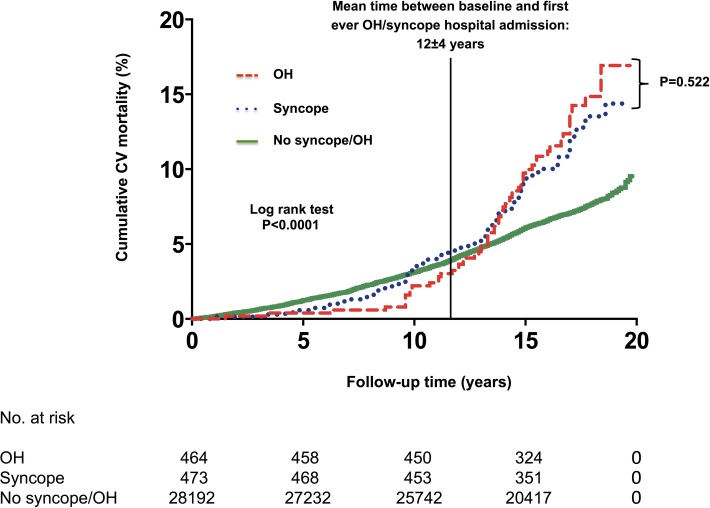
Figure 4.
Long-term cumulative incidence of cardiovascular (CV) mortality rates according to incident syncope-related and OH-related hospital admission (n=29 129). Kaplan-Meier curves with regard to CV mortality stratified according to incident syncope-related (blue) and OH-related (red) hospital admission: inpatients showed a significantly lower survival rate (Log-rank test p<0.001) compared with those never hospitalised for syncope or OH (green). The black vertical line at 12 years is a landmark point indicating mean time between baseline and first-ever OH/syncope hospital admission. Thereafter, survival curves for OH/syncope-related hospital admission and non-hospitalised patients begin and continue to diverge. OH, orthostatic hypotension.

