Abstract
A national sample survey of leprosy was undertaken in partnership with Indian Council of Medical Research (ICMR) institutions, National Leprosy Eradication Programme (NLEP), Panchayati Raj members, and treated leprosy patients to detect new cases of leprosy in India. The objectives of the survey were to estimate the new leprosy case load; record both Grade 1 and Grade 2 disabilities in the new cases; and to assess the magnitude of stigma and discrimination prevalent in the society. A cluster based, cross-sectional survey involving all States was used for the door-to-door survey using inverse sampling methodology. Rural and urban clusters were sampled separately. The population screened for detecting 28 new cases in rural and 30 in urban clusters was enumerated, recorded and analyzed. Data capture and analysis in different schedules were the main tools used. For quality control three tiers of experts were utilized for the confirmation of cases and disabilities. Self-stigma was assessed in more than half of the total new patients detected with disabilities by the approved questionnaire. A different questionnaire was used to assess the stigma in the community. A population of 14,725,525 (10,302,443 rural; 4,423,082 urban) was screened and 2161 new cases - 1300 paucibacillary (PB) and 861 multibacillary (MB) were detected. New case estimates for leprosy was 330,346 (95% Confidence limits, 287,445-380,851). Disabilities observed in these cases were 2.05/100,000 population and 13.9 per cent (302/2161) in new cases. Self-stigma in patients with disabilities was reduced, and the patients were well accepted by the spouse, neighbour, at workplace and in social functions.
Keywords: Deformities, leprosy, national sample survey (NSS), new case detection rate, stigma
India has achieved the global leprosy elimination target in December 2005, and the average prevalence of the disease at the national level was 0.68/10,000 in 20151. New cases, however, have been detected in about the same frequency in the National Leprosy Eradication Programme (NLEP) in the post-elimination era and have varied from about 1.2/100,000 in 2008 to 0.97/100,000 in 20151. This was not a substantial decline and pointed to the continued transmission and also late reporting of cases. Besides, there were reports about the detection of new cases of leprosy in several tertiary care and service providing centres in the country2,3. Therefore, despite the declining trends, leprosy continues to be an important public health disease in India both for the professionals and the policymakers. This study was undertaken in response to the 131st Report of the Committee on Petitions of Rajya Sabha, 2008, which recommended that ‘A final survey, involving Panchayati Raj institutions (PRI) may be undertaken so that the government can have realistic figures of leprosy-affected persons (LAPs) to devise a national policy’ (Central Leprosy Division, Ministry of Health and Family Welfare, personal communication). The Ministry of Health and Family Welfare (MoHFW) along with the Indian Council of Medical Research (ICMR) decided that a multicentric study be undertaken to assess the burden of new leprosy cases, number of these newly detected leprosy patients with Grade 1 and Grade 2 disabilities and determine the magnitude of stigma and discrimination prevalent in the society. Several deliberations were held with the Expert Committee which included programme managers of Central Leprosy Division (CLD), MoHFW, medical statisticians, academicians and epidemiologists, for deciding on the methodology to undertake the aforesaid survey. The ICMR-National Institute of Medical Statistics (NIMS), New Delhi, was entrusted to carry out a pilot house-to-house survey for the detection of new leprosy cases and comparing the inverse sampling methodology with the conventional method4,5, in Bareilly district of Uttar Pradesh (UP) with funding from CLD. The detailed results of this pilot study were presented4, and discussed at length with the experts. It was proposed that in the main national sample survey to assess the disease burden of new leprosy cases, all States and Union Territories (UTs) needed to be covered and inverse sampling methodology5 was to be used to detect the new cases. A house-to-house survey was to be undertaken to detect the new leprosy cases with the NLEP staff after re-training and time frame was allotted. Lakshadweep was not included as no new case of leprosy was detected in the area in the last five years.
The main objectives of the national survey were as follows: (i) to estimate new leprosy caseload; (ii) to assess both Grade 1 and Grade 2 disabilities in the newly detected cases; and (iii) to assess the magnitude of stigma and discrimination prevalent in the society.
Methodology of Survey and Sampling Design
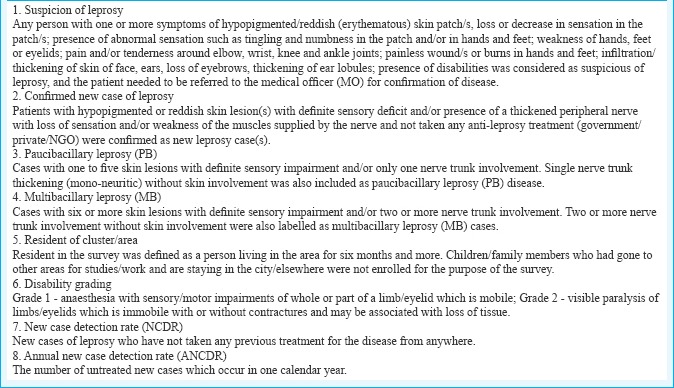
The definitions used in the survey are given in Box 1.
Box 1.
Definitions used in the survey
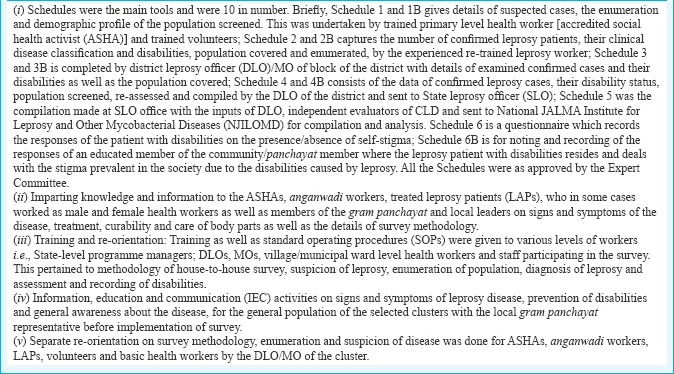
Thesurvey tools used included 10 schedules, training and orientation programmes, information, education and communication (IEC) activities, etc. as listed in Box 2.
Box 2.
Survey tools
Survey methodology and design for determining the new leprosy case load
As recommended by the Expert Committee, inverse sampling methodology was adopted for the estimation of new cases of leprosy at State and national level. All States and UTs were covered except Lakshadweep as no new cases had been reported in the preceding five years before the present survey. Besides the estimates of new cases at the national and State level, estimates for the rural and urban areas were also done by adopting a separate sampling design5,6. This sampling design was used for the rural and urban settings due to the known differences in occurrence of the disease in the two areas. These included differences in the system of health providers, variable socio-economic and hygienic conditions, population density per square area, different ways of living and presence of large and variable migrant population.
Inverse sampling
Inverse sampling is a sampling technique to estimate the proportion ‘P’ for rare events like leprosy4,5,6. Briefly, this consists of sampling until exactly ‘m’ the predetermined occurrences of rare event appear in the population, and the population covered to record these rare events is the denominator. In this methodology, the required sample size ‘n’ is a random variable and not known in advance. It is contrary to the conventional method where sample size is fixed and the events are noted after attaining the required sample size. In the inverse sampling, the unbiased estimate of ‘P’ is given by  , where n is the sample size at which the m, the (pre-determined) number of cases is to be detected4. The estimate of new case detected
  was estimated as by the formula:

and the standard error by the formula:

Sample size
For deciding the sample size in the survey using the inverse sampling methodology, district was taken as a basic unit in the rural areas and cities with ≥250,000 population in the urban areas. As the coefficient of variance as 20 per cent, the pre-determined number of new cases to be detected per district (in rural clusters) worked out to be 27 (m=27). This was rounded off to 28 in the survey at the district level and the cases needed to be detected by a house-to-house survey and the population covered to detect these new cases was noted. More than 90 per cent of the resident population per cluster was covered. In areas/districts with very low incidence of the disease, where the required 28 new leprosy cases could not be detected, a population of 200,000 was surveyed and number of new cases of leprosy detected noted and the screened population enumerated. The number of cases to be detected in the urban areas was fixed as 30 per urban cluster taking into account the increased population density/area, overcrowding, uneven distribution of cases, etc. Only residential areas were screened.
Selection and sampling of rural clusters
Ninety two (15%) of the total 612 districts (as per administrative divisions in 2011) were covered in the rural clusters. The UT of Andaman and Nicobar Islands was included in the rural sample framework as it had a predominantly rural population while the rest of UTs were included in the urban clusters. The total number of districts allocated to the States was determined by the total number of districts in the State and their reported annual new case detection rate (ANCDR), by Neyman optimum allocation4. Briefly, the number of districts allocated in each State was calculated by the formula,

In this, ni is the number of districts allocated in the State; i is the suffix for the State; n is the number of districts allocated to the i State, Ni=total number of districts in the particular i State; pi=the reported NCDR for the State ‘i'.
To have a representative sample from each State, firstly, districts from each State were divided into three strata (Table I) and were arranged according to the reported ANCDR within the State as per NLEP reports in the ascending order. Stratum I consisted of districts with reported ANCDR of <1/100,000; stratum II with reported ANCDR between 1/100,000 and 2/100,000 and stratum III consisted of districts with reported ANCDR of >2/100,000. The required number of districts from each stratum was then selected by circular systematic sampling ensuring the geographical spread, proportional distribution with reported NLEP varying ANCDR (Table I). In the second stage, all the blocks of the selected district were arranged in ascending order of ANCDR and grouped into two strata, i.e. high and low endemic, the cut-off being the median ANCDR. One block from each stratum (one high and one low) in the district was selected randomly. Of the 28 new cases of leprosy to be detected, 12 cases were to be detected from low endemic block and 16 cases from the higher endemic block of the district. For each selected block, four villages were selected randomly from four quadrants in different directions to have a representative sample. Twelve and 16 new cases, respectively, were to be detected depending on low- and high-endemic blocks (Fig. 1). The selected household was selected randomly starting from landmark area of the identified village, moving in a particular direction covering the whole village. The whole village was covered, and the population enumerated and noted after detecting four new confirmed cases from the particular village in high-endemic block and three from a low endemic block. For treatment purposes, all the leprosy cases confirmed were put on NLEP treatment; however, for the purpose of the survey, the population enumeration and noting of confirmed cases were restricted to four and three, respectively, from the high and low endemic block village start point. However, if the desired number of new cases was not detected in the particular village, the next consecutive village and so on, were to be surveyed till the required number of new cases was identified and the whole village was covered. In hilly areas, in some of the districts, the population of a block was much <100,000 population; therefore, after covering the entire population of the two selected blocks, number of new cases detected as well as the population screened was noted.
Table I.
State-wise allocation of districts in the rural clusters of national sample survey
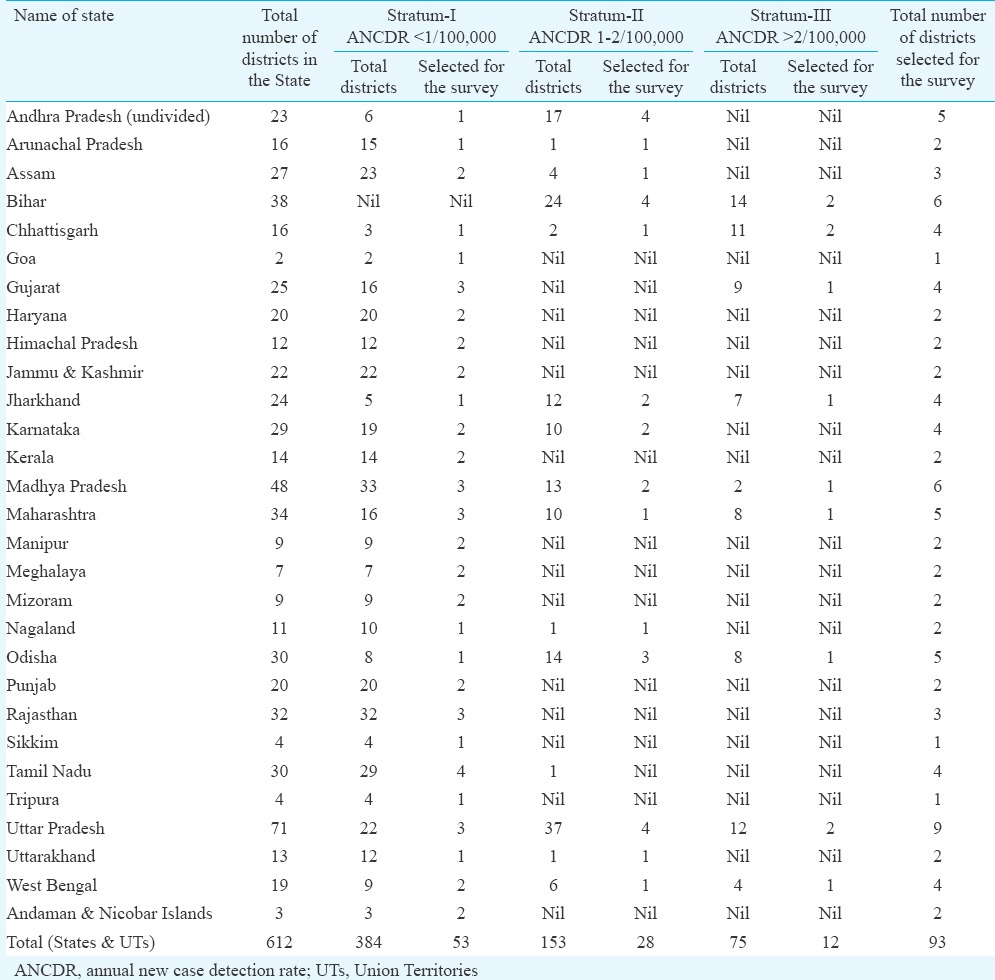
Fig. 1.
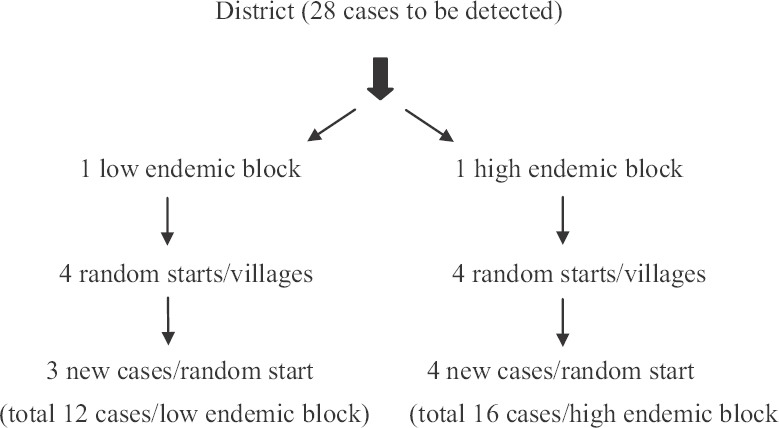
Flow diagram showing the sampling design for rural district clusters.
Selection and sampling of urban clusters
The selection of urban clusters also involved three stages and only residential areas were included. All the 157 cities having population of 250,000 or more from all the States were categorized into four strata according to their population, and all the UTs were put under a different stratum i.e. stratum E (Table II). In view of special characteristics and importance, all the four metros (Delhi, Mumbai, Kolkata and Chennai) as well as three other four million-plus cities (Hyderabad, Ahmadabad and Bengaluru) were covered in the survey. The number of cities to be selected from different States was decided based on Neyman optimum allocation4 considering the population of the city and its reported ANCDR. These were selected in a similar way as explained for rural population, with at least one city from each State. State-wise allocation of the urban cities is shown in Table III. The municipal wards were the basic unit and 30 cases were decided to be detected from each city and population screened enumerated. Due to more number of people residing per unit area in the urban clusters and uneven distribution of population, six random points were selected from geographically different areas with at least one slum area in each. Five cases were to be identified per each random start point. The population in metros and other more than four million population cities was bigger and distributed over a larger area with uneven distribution than other cities and towns; therefore, 10 random start points were selected for these metros as well as other four million population cities and included two slums in these cities (Fig. 2). Using the same inverse sampling methodology, three new cases of leprosy were to be detected from each random start in the metros (total 30). For the other cities (spread over lesser area than metros), there were six random start points with detection of five new cases from each random start point (Fig. 2). Population enumeration was done for each random start point. The whole municipal ward was covered and all patients detected and confirmed were put on NLEP treatment, although enumeration of population was restricted to the stipulated cases per random start point for the survey. If the required number of cases were not found, a total of 250,000 population in the city was to be covered and the number of new cases detected as well as the population covered noted.
Table II.
Categorization and allocation of cities in the urban clusters
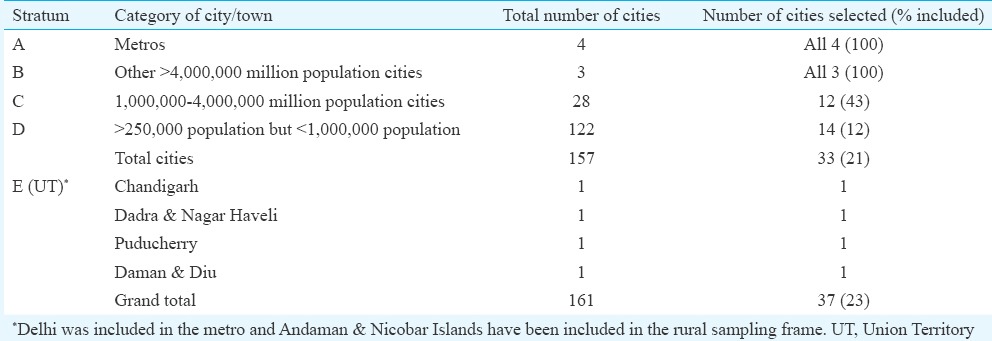
Table III.
Details of clusters (rural and urban) identified for the survey
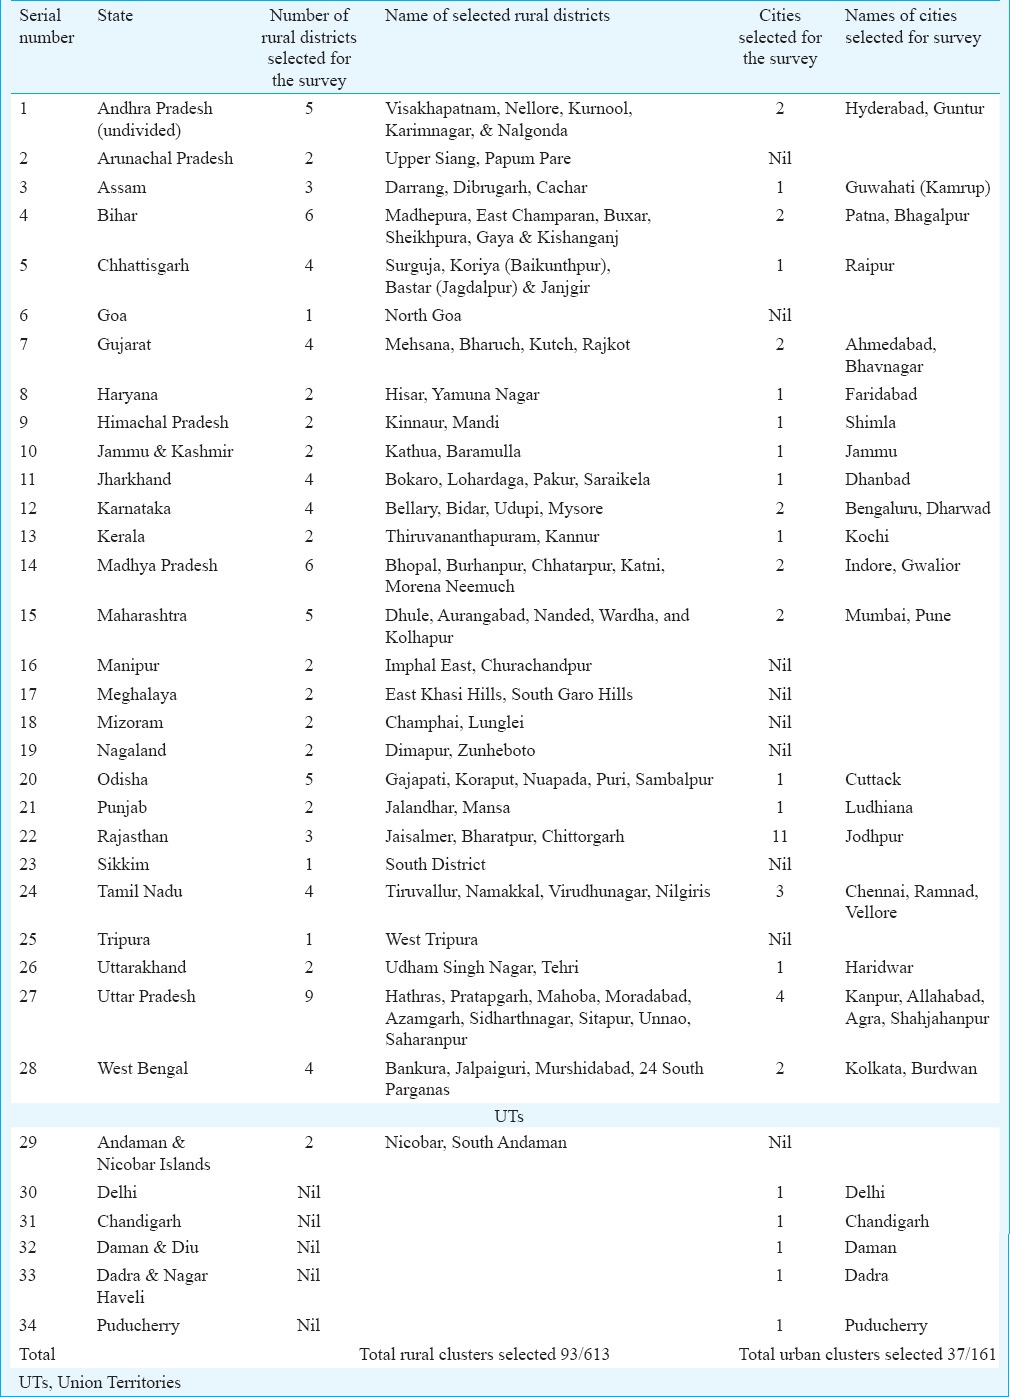
Fig. 2.
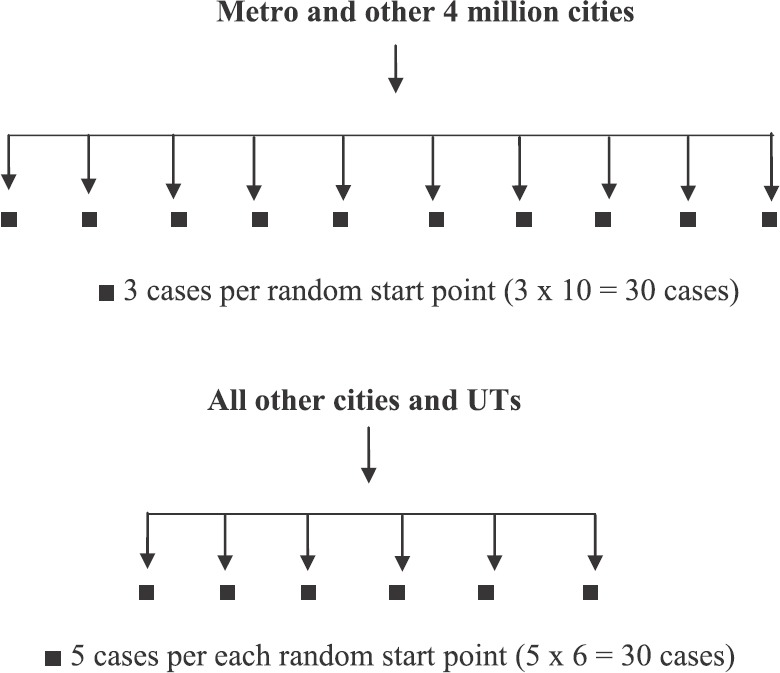
Flowchart showing the sampling design for the urban city clusters.
As the urban population in the States of Arunachal Pradesh, Goa, Manipur, Meghalaya, Mizoram, Nagaland, Sikkim and Tripura was <250,000, no city/urban cluster was screened in these States.
Assessment and recording of disabilities in newly detected cases
Only disabilities due to leprosy were considered and those due to other causes such as polio, congenital diseases and accidents were excluded. WHO grading of disability7 as being implemented in the NLEP was used. Grade 0 disability was not recorded as there was no disability only anaesthesia in the patches. Grade 1 and Grade 2 disabilities were recorded by the re-trained experienced leprosy worker, with experience of working in the Programme earlier, re-confirmed by the MO and DLO (confirmation team) and validated by the NLEP managers (ILEP representative/regional directors of the programme who were identified for the purpose). These were entered and noted in all newly diagnosed leprosy cases in the survey.
Assessing the stigma prevalent in the new leprosy disabled patients as well as the society
Questionnaire-based method was undertaken to analyze the attitudes and beliefs of patients as well as that of the common unaffected person of the community, as was done in the pilot study at Bareilly4. Sample questionnaire was discussed with the Expert Committee members, as well as renowned lawyers, legal experts, ILEP members and socio-behaviour scientists on the ethical issues involved in asking the questions and recording their responses. Two approved questionnaires, one for the patient with disabilities (Schedule 6 for self-assessment of stigma in the patient with disability) and Schedule 6B for assessing stigma prevailing in the society, from a member of the same community/municipal ward/village pradhan. After explaining the questions in the questionnaire in the local language it was filled up, after the consent of the patient and community member, by the re-trained leprosy worker noting their responses. The percentage response to the questions was then analyzed to assess the stigma. More than half of the patients with disabilities were interviewed with an equal number of respective gram pradhans or an educated resident of the area after obtaining their informed consent (unpublished data).
Methodology of survey
IEC activity was undertaken for the general population of the identified clusters, on the signs and symptoms of the disease, curability and treatment, care of eyes, hands and feet and care and prevention of disabilities by the DLO/MO of the identified clusters with the SLO and NLEP staff, as well as local gram panchayat leaders, to ensure maximum participation of the population.
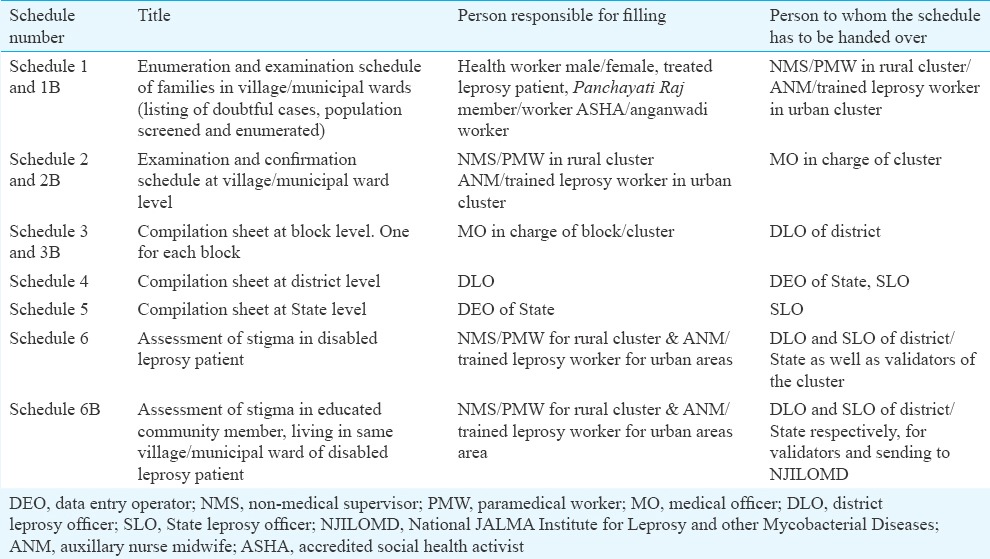
The DLO/MO after re-orientation and training on the survey methodology, in turn, trained the identified ASHA workers, male and female volunteers who in some areas were old treated patient, Panchayati Raj representative (who constituted the enumeration team) and initiated the house-to-house survey from the notified random start point. The enumeration team visited the households, enumerated the population screened, filled Schedules 1 and 1B and marked the suspected cases of leprosy, based on the notified signs and symptoms of leprosy (Table IV). All households in the defined, identified, residential area were visited; population examined and enlisted in the Schedule by the team and re-entered at the bottom of the Schedules and handed over to the next team i.e. the confirmation team. Households with absentees were re-visited and enumerated to ensure 90 per cent coverage of resident population.
Table IV.
Schedules, survey teams, their respective standard operating procedures and responsibilities
Confirmation team
Confirmation team confirmed the diagnosis of leprosy in the suspected cases and consisted of one trained non-medical supervisor (NMS) and one paramedical worker (PMW) who were re-trained and were working in the NLEP (Table IV). Schedule 1 and 1B, filled by the enumeration team were examined by them. The leprosy cases confirmed were enlisted in Schedule 2 and 2B individually, by both the members. The type of disease as well as the disability status was also marked in the Schedule. In addition, the team also examined 10 per cent of the households from Schedule 1, in whom there was no suspected leprosy case, to cross-check the data entered and look for any missing cases. The enumeration details of the population were also re-verified and population covered noted in the Schedule 2 and 2B. Furthermore, after validation of the leprosy cases by the validators, the team interviewed the patients with disabilities in local language after taking their consent for answering the questionnaire (Schedule 6 and 6B) and filled it up based on their responses. Schedule 6B was filled up by the answers obtained after interviewing an educated member of the same village/municipal ward or gram pradhan. These filled Schedules were handed over to MO/DLO of the cluster who constituted the supervisory team.
Reconfirmation/supervisory team
The MO of the supervisory team examined all the suspected cases again from Schedules 1 and 1B filled by the enumeration team, as well as the confirmed cases from Schedule 2 and 2B and reconfirmed the leprosy patients, their disease classification, including their disabilities. Schedule 3 was filled (one for each block), completed and sent to the SLO combining both the blocks for the district in Schedule 4. The enumerated screened population was also re-checked to ensure complete coverage and proper enumeration. The Schedules 6 and 6B filled by responses to the questions to the disabled leprosy patient as well as community member, respectively (by the confirmation team) was also cross-checked and ensured to be completed. The identified patient in the survey was treated with multidrug therapy (MDT) as per the NLEP norms, ensuring completion of treatment and care of hands, eyes and feet, and treatment of disabilities if any.
Validation team
Validation team consisted of State selected ILEP official/regional director and SLO. The team was constituted to ensure correct validation of cases and their disability status, both at the district and State level. The validators in close co-operation with MO and DLO of the area examined the Schedules 1, 1B, 2, 2B, 3, 3B and 4. They validated the diagnosis of leprosy patients as well as their disabilities. In addition, about 10 per cent of suspects enumerated in Schedule 1 and 1B were rechecked by them to ensure that data entered were correct and no cases were missed. After final verification and ensuring the correctness of the data in the Schedules, these were handed over to the SLO for State-level compilation (Schedule 5). The respective SLO finalized it and sent it for analysis as Schedule 5 to NJILOMD (study coordinator) for analysis and compilation. Table IV summarizes the SOP of the teams and their responsibilities.
Quality assurance
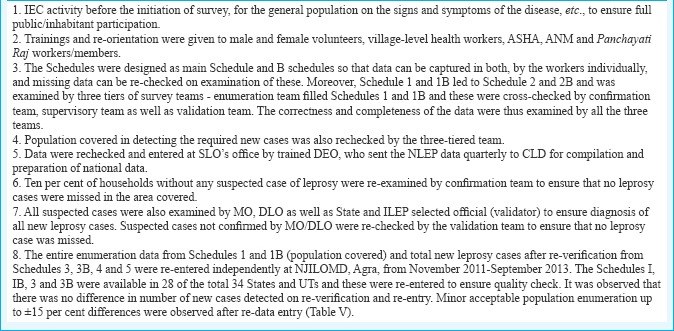
The quality assurance was ascertained in the survey as described in Box 3.
Box 3.
Quality assurance in survey
Outcome of the survey
To ascertain that the examined population was similar to the inhabitant population of the area and the survey truly represented the population, the parameters of religious practices (Hindu, Muslim, Christian and Sikh), caste (SC, ST and general category), gender and age groups among screened and the notified census population were compared. It was observed that the examined population were comparable on these parameters and details provided in the final report of the project were submitted to CLD, MoHFW(unpublished data).
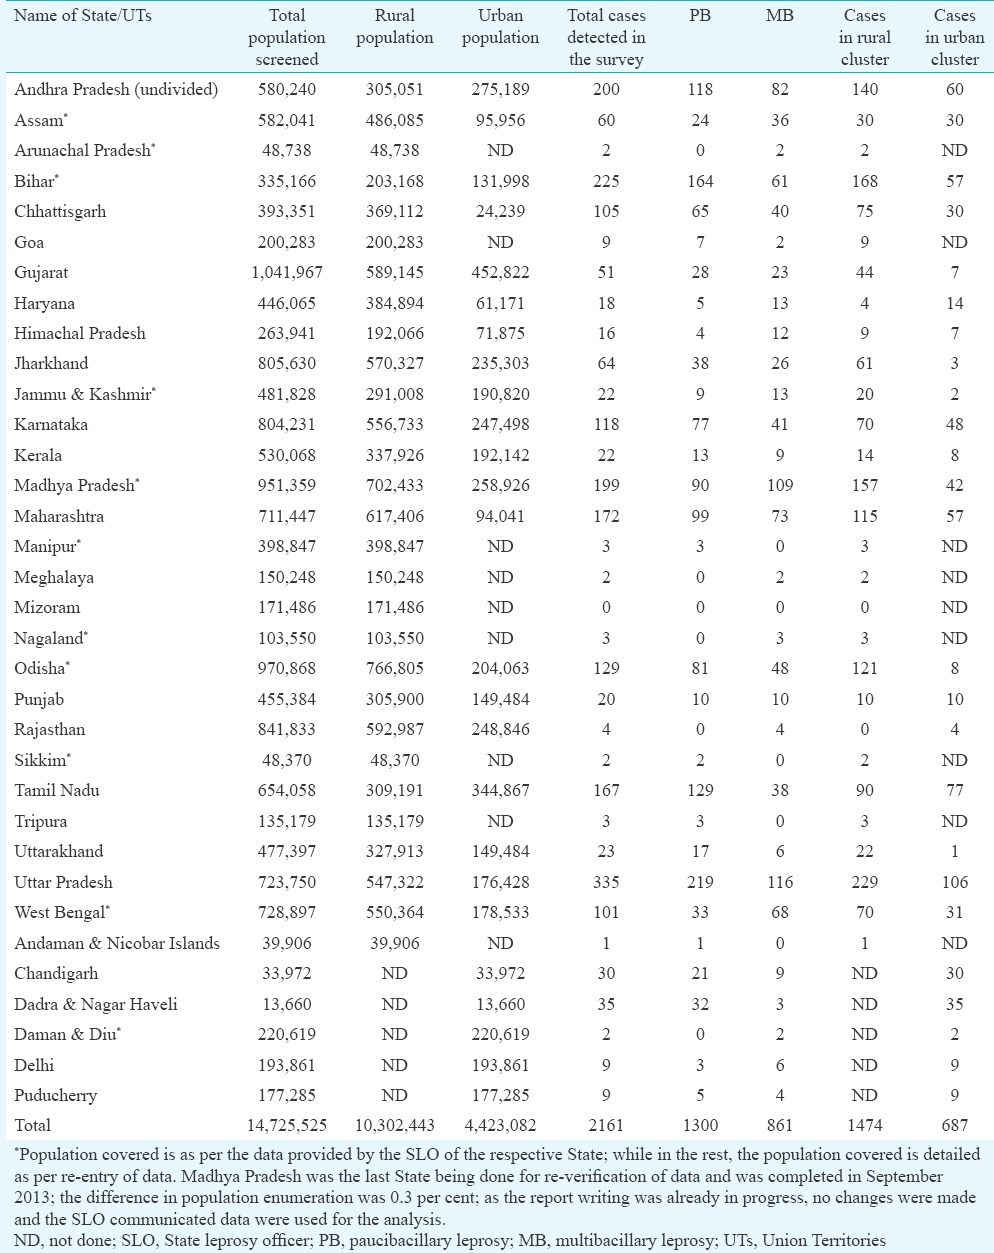
Trainings and re-orientation were completed in 2010 (with support from CLD and NIMS) and IEC as well as the survey was completed in 2011 (with active participation of NLEP staff at various levels and cross-verified by validators). The total population screened/examined in the survey was 14,725,525, which included 10,302,443 rural and the rest 4,423,082 urban population. A total of 2161 new cases of leprosy were detected and put on treatment which included 1300 PB cases and 861 MB cases (Table VI). Of these, 1474 cases (68.2%) were residing in rural areas and 687 (31.2%) in urban areas. No case was detected in Mizoram after screening a population of 171,486.
Table VI.
Details of population screened and new leprosy cases detected in the complete national sample survey of India
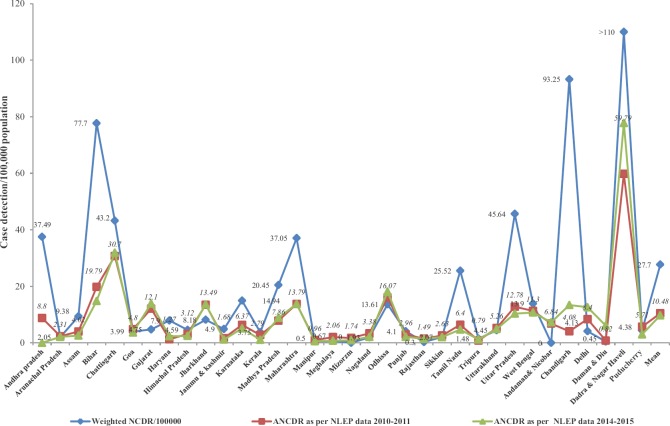
Using the inverse sampling methodology, the overall new case detection was 27.7/100,000 with a range of 0-366/100000 (Fig. 3 and Table VII). This was higher than that reported in NLEP annually. In the present survey, there was active new case detection by a house-to-house survey and more cases were detected than the reported cases as per the NLEP. More number of new cases was detected in UT of Dadra and Nagar Haveli, followed by Chandigarh in a comparatively smaller enumerated and examined population as compared to other States and UTs. Among the States, detection of new cases was highest in Bihar, UP, Chhattisgarh, Andhra Pradesh (undivided), Maharashtra, Tamil Nadu, Madhya Pradesh, Karnataka, West Bengal and Odisha, in descending order (Table VII and Fig. 3). This also varied in the rural and urban population and the mean new case detection nationally observed was 27.8/100,000 in the rural population and 27.5/100,000 in the urban population(unpublished data).
Fig. 3.
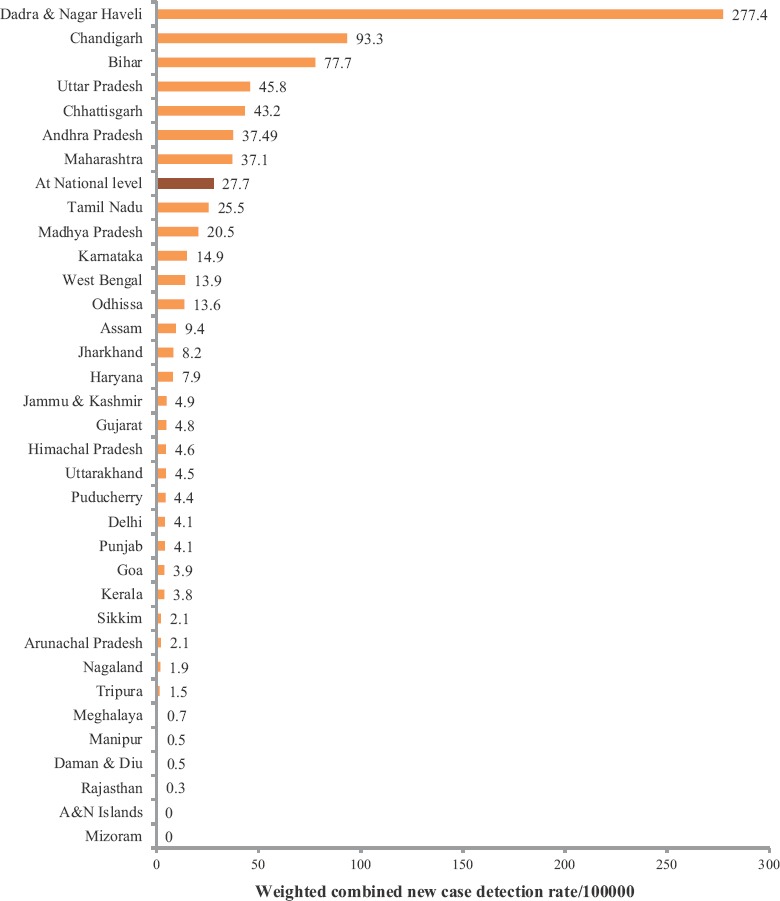
State-wise new cases detected/100,000 population observed in the survey.
Table VII.
New case detection and estimated/projected cases in various States & Union Territories as per the results of the survey
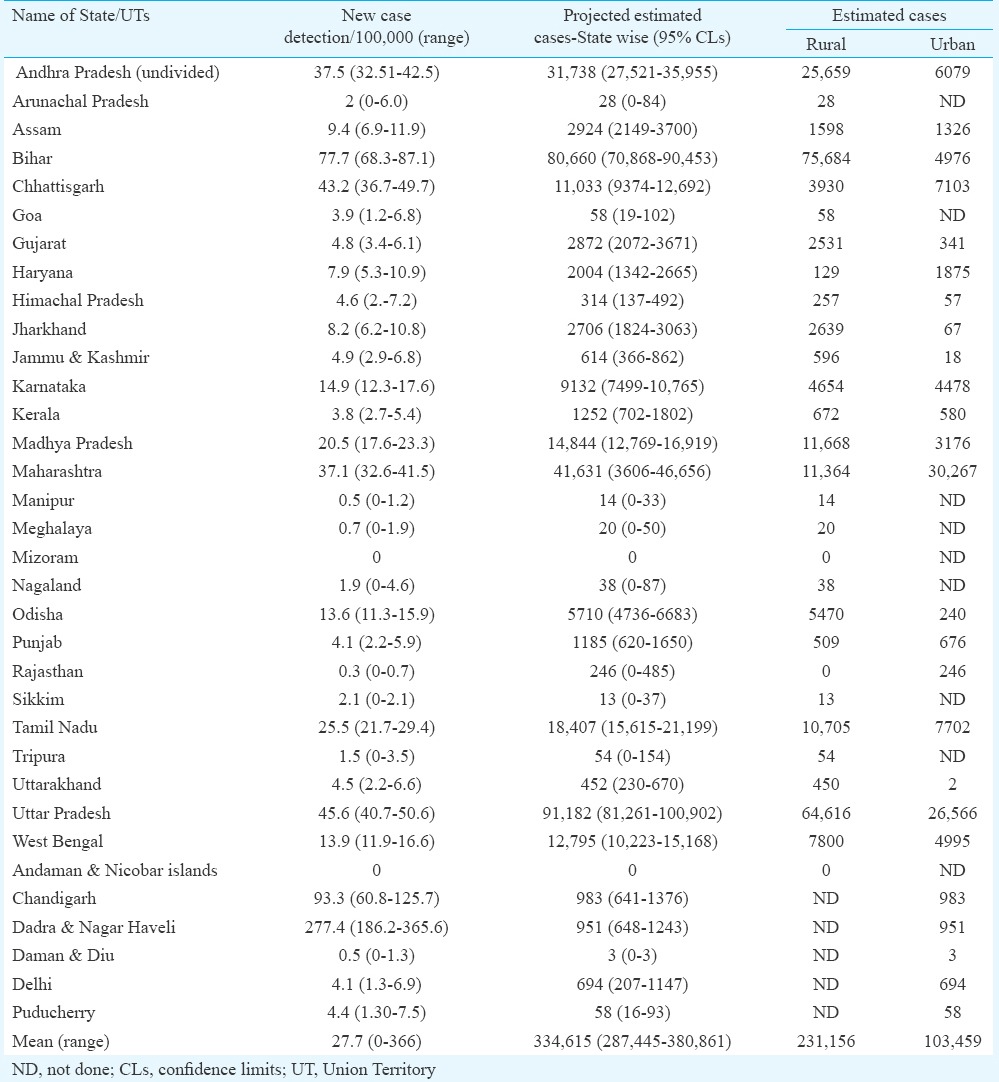
The estimated cases for the whole country were 334,615 and varied from the lower limit of 287,445 to higher limit of 380,861 (with 95% CI), as per the inverse sampling methodology (Table VII). As estimates were calculated as per the population of the State, it was highest in the State of UP, followed by Bihar, Maharashtra, Madhya Pradesh, undivided Andhra Pradesh, etc. It was much less in all the UTs.
In all the North-Eastern (NE) States and Goa, as well as UT of Andaman and Nicobar Islands, the urban clusters could not be selected due to the study design; therefore, the separate estimated cases in urban clusters of these States and UTs could not be determined. Similarly, in five UTs, i.e. Chandigarh, Dadra and Nagar Haveli, Daman and Diu, Puducherry and Delhi, no rural cluster was selected and screened, and new case estimates for rural clusters, separately, could not be determined. In the remaining States, the estimated cases were 231,156 and 103,459 respectively, for rural and urban clusters separately (Table VII).
Profile of new cases
The survey was based on the NLEP guidelines, and therefore, the cases were classified as PB and MB as per the definitions given. A total of 2161 cases were detected which included 1300 PB cases (60.2% of the total cases) and 861 MB cases (39.8% of the total cases); 1474 cases were detected in the rural cluster (68.2%) and 687 (31.8%) in the urban cluster. Table VI gives the detailed profile of the cases cluster-wise as well as at the State and national level. The profile of the cases varied in individual States as well as between the rural and urban clusters. More MB than PB cases were detected in the States of Assam, Arunachal Pradesh, Haryana, Himachal Pradesh, Jammu and Kashmir, Madhya Pradesh, Meghalaya, Nagaland, Rajasthan, West Bengal, Daman & Diu and Delhi (Tables VI and VII). More cases in urban clusters have been observed from Haryana and Rajasthan, while in both Assam and Punjab, an equal number of cases were detected from both rural and urban clusters.
Gender profile
Females constituted 46-50 per cent of the screened and surveyed population in the various States, which was similar to the census population of the respective States and UTs. The gender status of 156 cases (144 of rural clusters and 12 of urban clusters) was not known as the gender and age details were not communicated. Further, the Schedules from the States/UTs of Odisha, Nagaland, Daman and Diu and Jammu and Kashmir were not received for data entry and verification. Of the 2005 cases of whom the gender status was known, 928 were female cases (46.28%) and the rest males. In the rural clusters, 594 female cases were detected of the total 1330 cases (44.66%), and in urban clusters, females constituted 49.48 per cent (334/675) of the total cases (Fig. 4).
Fig. 4.
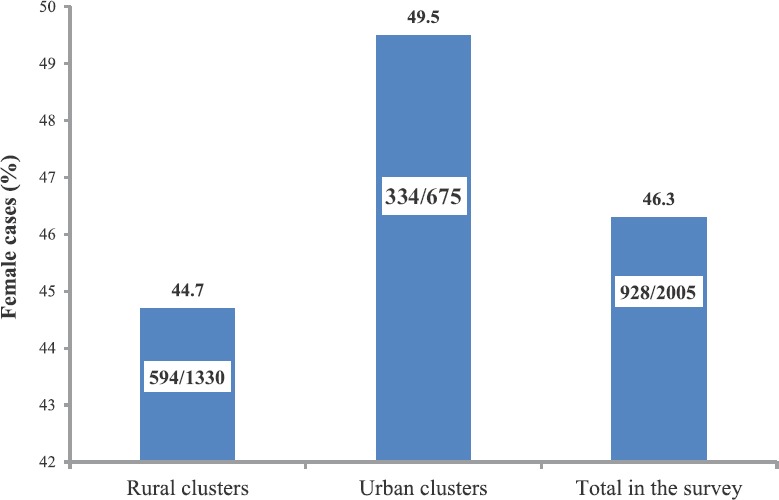
Percentage of female cases among the new cases detected.
Age profile of cases
As explained, the age-wise data were available for 2005 cases (1330 rural cases and 675 urban cases). About 11 per cent of cases were of the paediatric age group. It was similar in the rural and urban clusters (Fig. 5). In addition, about 10 per cent of cases were from the adolescent age.
Fig. 5.
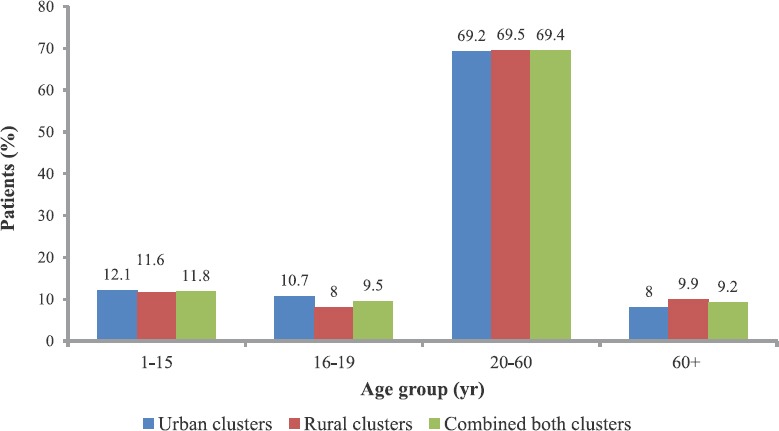
Percentage age-wise distribution of newly detected cases in the survey.
Estimation of new cases
The estimates were calculated with 95 per cent CI (Table VII). It varied from 287,445 to 380,861, with the maximum estimates being for UP. Both UP and Bihar add up to more than 50 per cent of the estimated cases. The estimated cases in the combined UTs were 3,689 (range 1496-3769). About a third of the estimated cases in combined UTs were from Dadra and Nagar Haveli (Table VII).
Disabilities
Both Grade 1 and Grade 2 disabilities were noted, confirmed by the respective MOs of the cluster as well as by validators. Among the new cases, 302 had disabilities of whom 127 had Grade 1 disabilities while 175 had Grade 2 disabilities (Table VIII and Fig. 6). All Grade 1 disability patients were given the recommended dosages of steroids and counseling for care of eyes, hands and feet. All Grade 2 disability cases were also counseled for appropriate reconstructive surgery and care of disabled parts. No disability of the eye was noted in any patient. The incidence of Grade 1 and 2 disabilities varied in different States as well as in the urban and rural clusters. In the States of Goa, Manipur, Mizoram, Tripura and UTs of Andaman and Nicobar Islands, Chandigarh, Dadra and Nagar Haveli and Puducherry, newly detected leprosy patients were not having any type of Grade 1 and Grade 2 disabilities (Table VIII). The States of Andhra Pradesh, Arunachal Pradesh, Assam, Bihar, Chhattisgarh, Haryana, Himachal Pradesh, Karnataka, Madhya Pradesh, Nagaland, Sikkim, UP and West Bengal had higher incidence of disabilities. In these States, the combined type of disabilities was more than 2/100,000 population. UP had the highest leprosy-related disabilities in the country. Disabilities were higher in MB patients versus PB patients (Fig. 6).
Table VIII.
Disabilities observed in the new cases detected in the various States and Union Territories
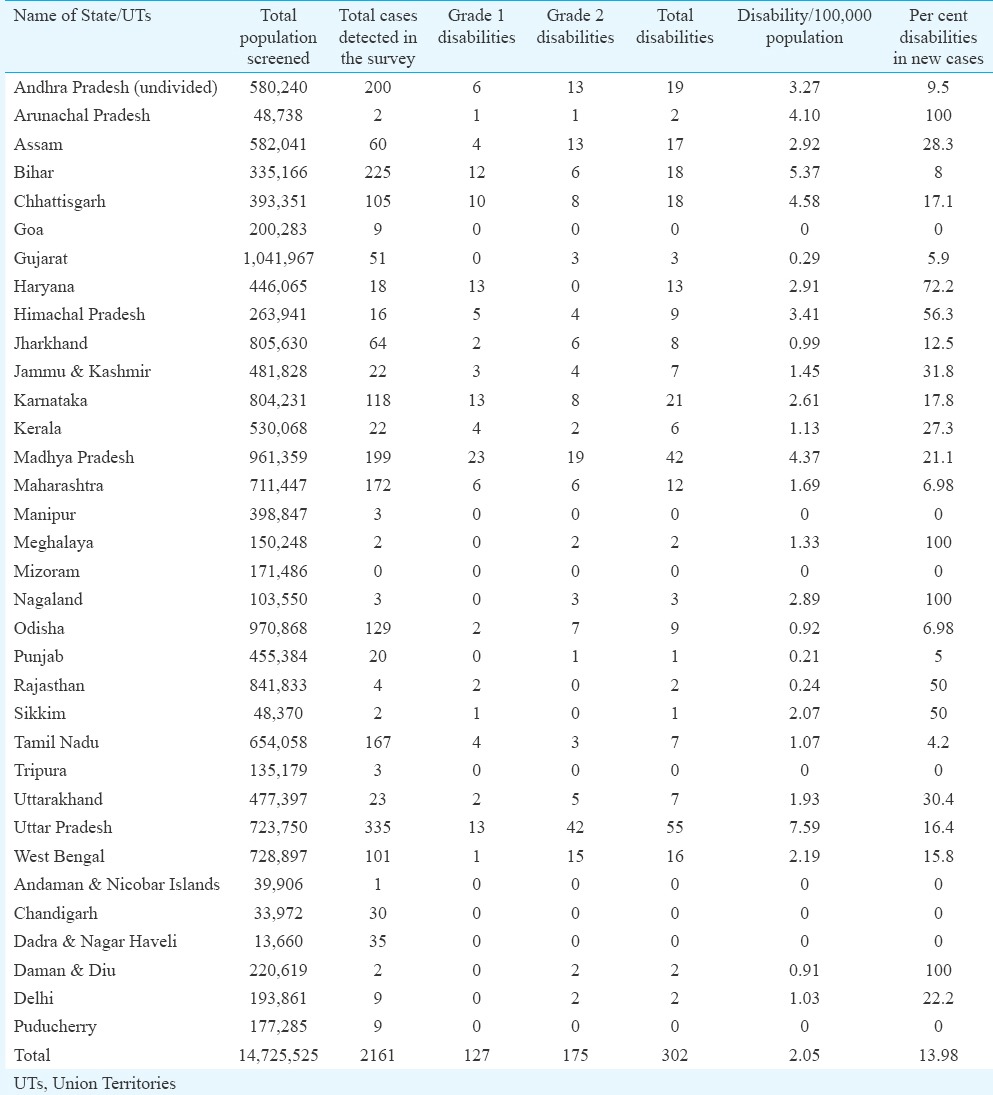
Fig. 6.
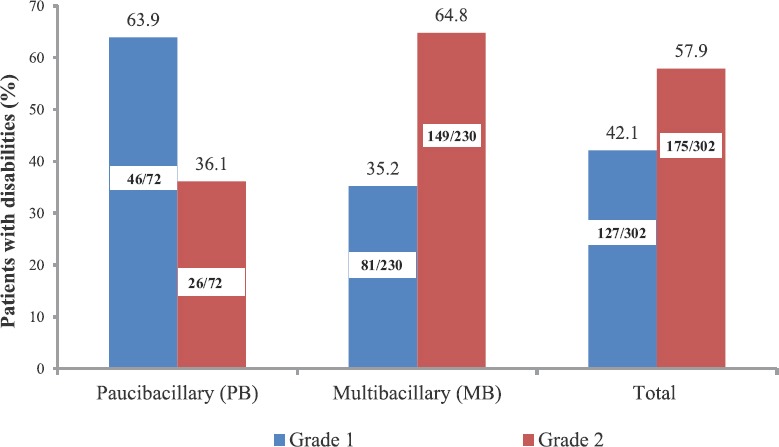
Type of disabilities in the newly detected leprosy cases in the survey.
Alternatively, calculating the percentage of combined disabilities in newly detected cases, 302 disabilities were observed in 2161 cases (13.9 %). Several NE States such as Arunachal Pradesh, Meghalaya and Nagaland had disabilities in all the new cases detected while these were present in more than half of the newly detected cases in Haryana (72.2%), 56.3 per cent in Himachal Pradesh and 50 per cent each in Sikkim and Rajasthan. The proportion of Grade 2 disabilities to the proportion of Grade 1 disabilities was also high 1.4:1 (175:127) i.e. 42 per cent had Grade 1 disabilities, while the rest had Grade 2 disabilities. Grade 1 disabilities were higher than Grade 2 disabilities in Bihar, Chhattisgarh, Haryana, Himachal Pradesh, Karnataka, Kerala, Madhya Pradesh, Rajasthan and Tamil Nadu (Table VIII).
Magnitude of stigma
Stigma in leprosy was largely due to the resulting disabilities and was present both in disabled leprosy patients (self- stigma) as well as the community and was assessed in both these groups.
Assessment of self-stigma in the disabled new leprosy patients
More than half of the patients with disabilities (156/302) were interviewed and questionnaire was filled after obtaining their informed consent (unpublished data). Among the patients interviewed, 80 per cent were males and 20 per cent females. Table IXA gives the details of the responses of the patient as he/she perceives from the behaviour of his/her immediate family members and attending health staff. It was observed that the extent of self-stigma was small and patient was at ease with his immediate family. However, 30 per cent of the patients still did not tell their family about the disease. Whenever family was told about the disease, they were supportive. It was observed that even after integration of the disease with general health care services, patients got their MDT and care for trophic ulcers as well as disabilities from the government dispensaries/centres and were satisfied with the services.
Table IXA.
Perception of self-stigma by leprosy patient with disabilities from his/her immediate family

Simple questions were asked to the patient with disability. The responses as perceived by the patient are presented in Table IXB. It was observed that the patient was well accepted at his/her workplace and was invited to participate in social functions.
Table IXB.
Perception of stigma from fellow workers/social contacts by the patient with disabilities

Assessment of stigma prevailing in the society
Simple questions were asked by experienced re-trained leprosy workers to gram pradhans/teachers or other educated members living in the same locality as the disabled leprosy patient. Table X shows the results of the questionnaire assessment. Most of the community members had seen a leprosy case and knew about the curability of the disease. However, some members of the community were uncertain about it and believed it was hereditary. They still believed that the patients should be kept at a distance, even when on treatment. This showed that there was still fear and misbelief about the disease. A substantial percentage of community members still felt that patients with residual disabilities, seen begging can spread the disease. A segment of people also gave contradictory and uncertain answers when asked about their social attitudes to the LAPs and needed more knowledge and education to dispel the misbeliefs.
Table X.
Responses of Gram Pradhan/educated fellow villager/neighbour for assessment of stigma as prevailing in the society

Discussion
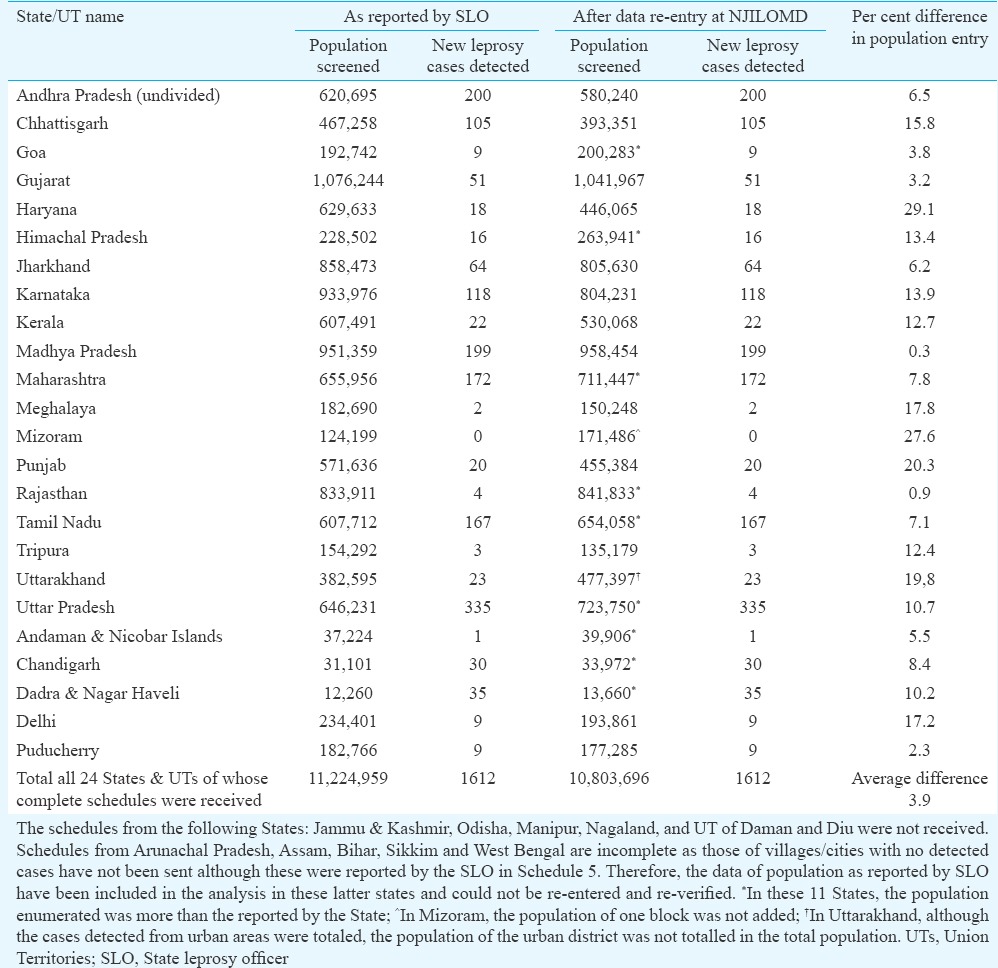
The population screened during the survey was similar to the inhabitant population(unpublished data) and was representative of the resident population. The new cases were confirmed by experienced leprosy workers, cross-verified by MO/DLO, experts (validators) identified by CLD, and recorded by data entry operator of SLO. These were also re-entered independently from the Schedules, at NJILOMD, Agra, for cross-verification. No discrepancy was observed in the number of new cases detected. (Table V). In Andhra Pradesh (undivided), Chhattisgarh, Gujarat, Haryana, Jharkhand, Karnataka, Kerala, Madhya Pradesh, Meghalaya, Punjab, Tripura, Delhi and Puducherry, the population as reported by the SLO was more than that observed by re-data entry at NJILOMD. On the other hand, in Goa, Himachal Pradesh, Maharashtra, Mizoram, Rajasthan, Tamil Nadu, UP, Uttarakhand, Andaman and Nicobar Islands, Chandigarh and Dadra and Nagar Haveli, the total population screened was more after data re-entry than that reported by the respective SLO. On the whole, the difference in enumeration was ±15 per cent. Considering the huge population screened this was within permissible limits (Table V). Some of the States such as Andhra Pradesh, Bihar, Chhattisgarh, Jammu and Kashmir and Jharkhand had undertaken the survey in very difficult situations, and in NE States, the terrain was difficult. It is possible that all enumeration data were not entered in the Schedules and totaled only. Except for the States where the schedules were not available, the re-entered enumerated population data were taken for analysis, and calculation of new case disease estimates. The study demonstrated that inverse sampling methodology, as reported earlier4,5,6 was adequate and operationally feasible for such massive exercises, with several advantages over the conventional method.
Table V.
Results after re-entry of schedules; enumeration of the population and new leprosy cases detected as undertaken at National JALMA Institute for Leprosy & Other Mycobacterial Diseases (NJILOMD)
Involvement of gram pradhans, treated leprosy patients and ASHAs (after training and re-orientation) ensured good population participation. IEC activities in the population increased the knowledge of the disease in the general population, and ensured co-operation and examination. The sample size of the study was planned to observe differences between the various States and UTs as well as differences in the occurrence of the disease in inhabitants of rural and urban dwellings. It was observed that the number of new patients detected in the present survey was more, mean was 27.7/100,000 (range 0-366/100,000) in various States and UTs. This was as expected as leprosy, being a non-fatal, low morbidity, slowly evolving disease, with a variable incubation period, and less cases of self-report. More cases were detected in door-to-door survey than self-reporting. The trends in new case detection, were however, similar except in Gujarat and Mizoram to the reported ANCDR for 2010-20118 (when the survey was conducted). Andhra Pradesh (undivided), Bihar, Haryana, Karnataka, Madhya Pradesh, Tamil Nadu, UP and UTs of Chandigarh, Dadra and Nagar Haveli and Puducherry had a much higher case load than that reported in the NLEP. Moreover, these trends of the reported new cases remained the same in 2014-20151 (Fig. 7). There is an urgent need to update and intensify the IEC activities, more so in these States, launch new case detection surveys after adequate re-orientation of the health staff, so that more cases can be detected and appropriately treated. In Lakshadweep, no survey was undertaken as per recommendations of the Expert Committee as no case was reported in the preceding five years. However, more cases were reported in the later years which emphasizes the need for detecting and treating more cases not only from the high-endemic areas but also continued surveillance and case finding activity, in low-endemic settings1. The NLEP is now focusing on the detection of cases and treating them to reduce the leprosy burden in such areas9. In Assam and Jharkhand, where the upper limit of the range of new case detection was >10/100,000, more new case detection activity and campaigns are needed.
Fig. 7.
New case detection/100,000 in different States as observed in present survey and ANCDR as reported in NLEP in years 2010-2011 and 2014-2015, respectively. The new cases detected/100,000 in Dadra & Nagar Haveli was observed as 277.4 and is depicted as >110 for graphical presentation. NCDR, new case detection rate; ANCDR, annual new case detection rate; NLEP, National Leprosy Eradication Programme
On the other hand, more new cases have been reported by the NLEP in Gujarat and Mizoram both in 2010-20118 and 2014-20151 than detected in the present survey, probably because of pro-active measures, taken up by the programme managers of the States for finding hidden cases. Higher numbers of new cases detected in the present survey in UTs of Dadra and Nagar Haveli and Chandigarh could be due to a door-to-door survey, better health facilities with larger number of people migrating for economic benefit and living in the same household with their village accomplices.
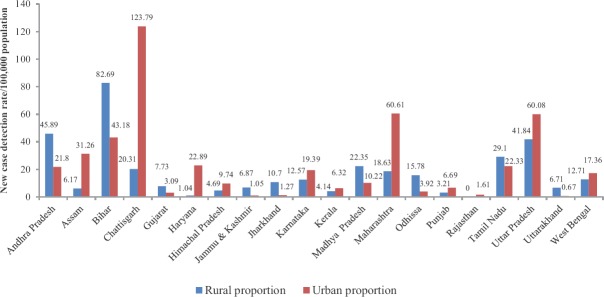
In 20 States, both the rural and urban clusters were screened. The proportion of new leprosy cases detected in the rural and urban is shown in Fig. 8. The new case detection in the rural population was higher in Andhra Pradesh, Bihar, Gujarat, Jammu and Kashmir, Jharkhand, Madhya Pradesh, Odisha, Tamil Nadu and Uttarakhand. In Assam, Chhattisgarh, Haryana, Himachal Pradesh, Karnataka, Maharashtra, Punjab, Rajasthan, UP and West Bengal, this was higher in the urban clusters, and no cases were detected in the rural clusters of Rajasthan. Special Activity Plan by NLEP has been launched in these and other areas to detect and treat these hidden cases10.
Fig. 8.
Comparison of rural and urban cluster new cases detected/100,000 of screened population in States where both the urban and rural clusters were sampled.
A higher proportion of female cases was detected in the survey than that reported in literature2,10,11. This higher proportion of female cases was also different from programme reported male-female ratio of the cases1,8,9. This can be attributed to better coverage of IEC of the general population, house-to-house survey and use of re-trained ASHAs and female health workers, panchayat members, LAPs in the survey. In the rural areas, more new female cases were detected in Manipur, Sikkim, Tamil Nadu, Tripura and Uttarakhand; while in the urban areas, more female cases than males were detected in Bihar, Chhattisgarh, Karnataka, Tamil Nadu and Maharashtra.
About 11 per cent of the new cases detected were child cases, and nearly an equal number were of the adolescent age group indicating continued transmission. There was not much difference in age distribution in the rural and urban clusters. However, these varied widely in the various States and UTs. No childhood cases were detected in the rural clusters of Andaman and Nicobar Islands, Arunachal Pradesh, Goa, Himachal Pradesh, Manipur, Meghalaya, Punjab, Sikkim and Tripura.
The high number of new cases detected in the adolescent age group needs special mention as this group is more prone to suffer from reactions in leprosy and is highlighted by other investigators earlier as well4,10,12,13,14. Disability in leprosy can be prevented to a large extent by early diagnosis and prompt and effective treatment of reactions. Uncontrolled reactions in these groups may lead to lifelong disabilities.
The projected new cases may have occurred between 280,000 and 390,000/year in the country as per the survey conducted. This varied in individual States and was less than hundred for the most of small States of Arunachal Pradesh, Goa, Manipur, Meghalaya, Nagaland and Sikkim. On the other hand, UP and Bihar together accounted for about half the estimated new cases in the country. Similarly Dadra and Nagar Haveli and Chandigarh (UTs) account for about 50 per cent of the estimates for all UTs.
The new case disability rates reported in the present survey was about two per 100,000 population. However, the number of new leprosy cases reporting with disabilities was rather high (302/2161 cases i.e. 13.98%). These varied widely in the various States and UTs. No disabilities were observed in the Andaman and Nicobar Islands, Chandigarh, Dadra and Nagar Haveli and Puducherry and States of Goa, Manipur, Mizoram and Tripura. In Arunachal Pradesh, Meghalaya and Nagaland, all the cases detected had disabilities. In addition, it was as high as 72 per cent in Haryana (13/18 cases); 56 per cent (9/16 cases) in Himachal Pradesh and 50 per cent in Sikkim and Rajasthan. These indicate late reporting and need special attention as most of these States have reached the elimination target at State as well as in some cases at the district level, as also observed by other workers1,12,13. Disability rates in new cases were 31.8 per cent (21/118 new cases) in Karnataka; 30 per cent in Uttarakhand (5/23 new cases). It was less than 10 per cent in new cases from Bihar, Jharkhand and Maharashtra. Among the UTs, Daman and Diu reported disabilities in both the new cases detected. However, no disabilities were observed in the other UTs even though higher number of new cases per 100,000 was observed. No disabilities in these areas, probably indicated that patients were reporting early due to better health facilities, doctor-patient ratio and better IEC and knowledge of the disease.
Of the total 72 disabilities observed in new PB patients, 46 were of Grade 1 and the rest 26 of the Grade 2 type. However, in the new MB patients, Grade 1 disabilities were observed in 81 of 230 cases as also reported by others12,13,14. These patients need to be treated adequately so that permanent disabilities can be prevented. Several other workers have also highlighted special activities and close surveillance for this vulnerable population12,13,14,15. In Haryana, all cases detected had Grade 1 disabilities, and in Bihar, Chattisgarh, Himachal Pradesh, Karnataka, Madhya Pradesh, Sikkim and Tamil Nadu these were higher than Grade 2 disabilities. It re-emphasis the need of proper training of doctors and health workers, better IEC for the general population so that they are timely recognized and adequately treated to prevent permanent disabilities13,14,15.
Children of leprosy disabled patients attend the same schools as the general population in a large proportion and there was no discrimination against them. Self stigma was observed in a proportion of disabled cases and can be further reduced by more frequent IEC activities and treated patient's participation in such activities. This has also been emphasized by Srinivasan13 and van Brakel et al15.
Limitations of the survey
The main limitations of the present survey were that towns and cities of less than 250,000 population could not be covered. Only big cities and metros were covered in the urban clusters. The differences, therefore, could be measured in 20 States only. The rural population could not be assessed in UTs (except Andaman and Nicobar islands) and National capital of Delhi. More emphasis was needed to be given for enumeration of the population, although this was within the acceptable limits. In addition, where lesser number than required cases were confirmed and validated, more population was not screened and enumerated to detect the optimally required number of cases. Further, in the methodology, there was little scope of diagnosis and capturing of data regarding reactions, which is an important parameter leading to increased morbidity of the disease. Lesser number of female patients with disabilities was assessed for stigma evaluation as compared to males although more than half of the patients with disabilities were assessed. Thus, differences in stigma as perceived by males vis-a-vis females could not be assessed. Furthermore, special assessment of the tribal population vis-a-vis the general population, could not be assessed.
Conclusion
The survey findings indicated the following:
-
(i)
Inverse sampling methodology could be used successfully for such large surveys. This reduced the false positivity and false negativity, to a large extent and was operationally acceptable.
-
(ii)
IEC activities before the survey empowered the population, improved knowledge about the disease and resulted in better coverage.
-
(iii)
Involvement of ASHAs, female health workers, LAPs and panchayat members, after training, improved the overall coverage and facilitated more women, adolescents and children to participate in the activity, get examined, diagnosed with early disease and treated.
-
(iv)
Three-tier validation of newly diagnosed cases was ascertained.
-
(v)
Quality assurance was ensured by re-entry of all new cases detected as well as proper enumeration of population.
-
(vi)
NCDR varied in different States and were different from the reported ANCDR as expected. These varied in each State.
-
(vii)
In some States, there were more disabilities in the newly detected cases, while in some, though the number of new cases detected/100,000 population was high, there were no disabilities in them indicating early detection of cases.
-
(viii)
Nearly 42 per cent of the disabilities were of Grade 1 type and needed quick, efficient and prompt treatment to decrease the morbidity rate and prevent Grade 2 disabilities.
-
(ix)
Proportion of Grade 2 disabilities was higher in MB cases.
-
(x)
More female patients were detected in the survey than in the self-reporting programme.
-
(xi)
The proportion of children and adolescents detected in the survey were higher than that reported in the ANCDR, indicating continued transmission of the disease, and this requires special focus in the Programme.
-
(xii)
Little self-stigma was still present in leprosy patients about their disabilities. More re-assurance as well as knowledge and care of such disabilities is required in them.
-
(xiii)
Some misbeliefs of the disease and disabilities still persist in the general population and more IEC activities are required for the general public to dispel them.
Acknowledgment
Authors acknowledge and thank the programme managers at Central Leprosy Division (CLD), all States, District Leprosy Officer (DLO), Medical Officer (MO) (130 of them in various States and UTs), health workers and treated leprosy workers (>250 of them), ASHAs (>500), Panchayat members as well as the inhabitant population for their co-operation, hard work, diligence and support. Authors thank the Expert Committee members Drs Dhillon, C.M. Aggarwal, Anoop Puri, Barkakaty and (Shrimati) Meena Kapoor of the CLD for their critical comments, training support and suggestions in completing the project, and acknowledge the support, comments and encouragement received from the Shri Pradhan, IAS; Shri Desiraju IAS; Dr R.S. Shukla IAS. Authors also acknowledge the support from NJILOMD staff and the contractual data entry staff for their support and efforts in completion of the project. Special thanks are due to Dr R.M. Pandey, All India Institute of Medical Sciences (AIIMS), New Delhi who as an independent expert helped in rephrasing of the methodology of Inverse sampling, as well as reply to the reviewers of the paper. The project was funded by the Central Leprosy Division, Ministry of Health and Family Welfare, Government of India, New Delhi.
Footnotes
Conflicts of Interest: None.
References
- 1.Central Leprosy Division, Directorate General of Health Services, Ministry of Health and Family Welfare, Government of India. New Delhi: [accessed on February 5, 2016]. National Leprosy Eradication Program - Progress Report for the Year 2014-15. Available from: http//www.nlep.nic.in/pdf/report . [Google Scholar]
- 2.Park K. Park's textbook of preventive and social medicine. 23rd ed. Jabalpur, India: Banarsidas Bhanot; 2015. Leprosy; pp. 316–29. [Google Scholar]
- 3.Tiwary PK, Kar HK, Sharma PK, Gautam RK, Arora TC, Naik H, et al. Epidemiological trends of leprosy in an urban leprosy centre of Delhi: A retrospective study of 16 years. Indian J Lepr. 2011;83:201–8. [PubMed] [Google Scholar]
- 4.Aggarwal A, Pandey A. Inverse sampling to study disease burden of leprosy. Indian J Med Res. 2010;132:438–41. [PubMed] [Google Scholar]
- 5.Cochran WG. Sampling techniques. 3rd ed. New York: John Wiley & Sons; 1977. [Google Scholar]
- 6.Aggarwal A, Pandey A, Katoch K. Survey methodology for the assessment of disease burden of leprosy in India. Health Popul Perspect Issues. 2011;34:193–203. [Google Scholar]
- 7.Alberts CJ, Smith WCS, Meima A, Wang L, Richardus JH. Potential effect of the World Health Organization's 2011-2015 global leprosy strategy on the prevalence of grade 2 disability: A trend analysis. Bull World Health Organ. 2011;89:469–95. doi: 10.2471/BLT.10.085662. [DOI] [PMC free article] [PubMed] [Google Scholar]
- 8.Central Leprosy Division, Directorate General of Health Services, Ministry of Health and Family Welfare, Government of India. New Delhi: [accessed on July 30, 2013]. National Leprosy Eradication Program - Progress Report for the Year 2010-11 Ending on 31st March, 2011. Available from: http//www.nlep.nic.in/pdf/report . [Google Scholar]
- 9.Central Leprosy Division, Directorate General of Health Services, Ministry of Health and Family Welfare, Government of India. New Delhi: [accessed on March 22, 2014]. National Leprosy Eradication Program - Progress Report for the Year 2012-13. Available from: http//www.nlep.nic.in/pdf/report . [Google Scholar]
- 10.Joshi PL. Epidemiology of leprosy. In: Kumar B, Kar HK, editors. IAL textbook of leprosy. 2nd ed. New Delhi: Jaypee Health Sciences Publishers; 2017. pp. 33–44. [Google Scholar]
- 11.Sarkar R, Pradhan S. Leprosy and women. Int J Womens Dermatol. 2016;2:117–21. doi: 10.1016/j.ijwd.2016.09.001. [DOI] [PMC free article] [PubMed] [Google Scholar]
- 12.Kumar B. World leprosy day 2015.Reviewing commitment for a leprosy free world. Indian J Med Res. 2015;14:1–4. doi: 10.4103/0971-5916.154476. [DOI] [PMC free article] [PubMed] [Google Scholar]
- 13.Srinivasan H. Disabilities in leprosy-current situation and some suggestions. Indian J Lepr. 2004;76:164–5. [PubMed] [Google Scholar]
- 14.Ganapati R, Pai VV, Tripathi A. Can primary health centres offer care to the leprosy-disabled after integration with general health services? - A study in rural India. Lepr Rev. 2008;79:340–1. [PubMed] [Google Scholar]
- 15.van Brakel Wim H, Sihombing B, Djarir H, Beise K, Kusumawardhani L, Yulihane R, et al. Disability in people affected by leprosy: The role of impairment, activity, social participation, stigma and discrimination. Glob Health Action. 2012;5 doi: 10.3402/gha.v5i0.18394. [DOI] [PMC free article] [PubMed] [Google Scholar]


