

ABSTRACT
The objective of this study was to investigate the interaction of the nitrogen (N) cycle with methane production in the Florida Everglades, a large freshwater wetland. This study provides an initial analysis of the distribution and expression of N-cycling genes in Water Conservation Area 2A (WCA-2A), a section of the marsh that underwent phosphorus (P) loading for many years due to runoff from upstream agricultural activities. The elevated P resulted in increased primary productivity and an N limitation in P-enriched areas. Results from quantitative real-time PCR (qPCR) analyses indicated that the N cycle in WCA-2A was dominated by nifH and nirK/S, with an increasing trend in copy numbers in P-impacted sites. Many nifH sequences (6 to 44% of the total) and nifH transcript sequences (2 to 49%) clustered with the methanogenic Euryarchaeota, in stark contrast to the proportion of core gene sequences representing Archaea (≤0.27% of SSU rRNA genes) for the WCA-2A microbiota. Notably, archaeal nifH gene transcripts were detected at all sites and comprised a significant proportion of total nifH transcripts obtained from the unimpacted site, indicating that methanogens are actively fixing N2. Laboratory incubations with soils taken from WCA-2A produced nifH transcripts with the production of methane from H2 plus CO2 and acetate as electron donors and carbon sources. Methanogenic N2 fixation is likely to be an important, although largely unrecognized, route through which fixed nitrogen enters the anoxic soils of the Everglades and may have significant relevance regarding methane production in wetlands.
IMPORTANCE Wetlands are the most important natural sources of the greenhouse gas methane, and much of that methane emanates from (sub)tropical peatlands. Primary productivity in these peatlands is frequently limited by the availability of nitrogen or phosphorus; however, the response to nutrient limitations of microbial communities that control biogeochemical cycling critical to ecosystem function may be complex and may be associated with a range of processes, including methane production. We show that many, if not most, of the methanogens in the peatlands of the Florida Everglades possess the nifH gene and actively express it for N2 fixation coupled with methanogenesis. These findings indicate that archaeal N2 fixation would play crucial role in methane emissions and overall N cycle in subtropical wetlands suffering N limitation.
KEYWORDS: Everglades, methanogenesis, nitrogen fixation, nifH gene, nitrogen cycle, methanogens
INTRODUCTION
Wetlands constitute the most significant natural source of the potent greenhouse gas methane, accounting for approximately 20% of annual global emissions (∼574 Tg) (1). The Florida Everglades is a large freshwater wetland in North America, covering over 8,000 km2. In recent decades, many studies on methane emissions have been conducted in Water Conservation Area 2A (WCA-2A) of the Everglades. Primary production in the Everglades was historically very limited in phosphorus (P); however, WCA-2A received agricultural runoff from the adjacent Everglades Agricultural Area (EAA) for many years (2, 3), resulting in a more nitrogen (N)-limited system in areas with an excess of P (4). Changes in the assemblage composition of methanogens (5, 6), methane production rates (7, 8), and methane production pathways (9) along the nutrient gradient have been reported; however, it is not clear how methanogens and methanogenesis may be impacted by nitrogen availability and limitation along this gradient.
The N cycle is central to global biogeochemistry and is commonly tightly linked with other elemental cycles, such as the carbon cycle. The N cycle is complex and is composed of a diverse set of redox reactions and assimilation/dissimilation pathways, many of which are carried out by specialized prokaryotes (10, 11). This cycle is a prime determinant of the availability of N for the populations involved. The N cycle has also been suggested to influence methane emissions indirectly via various ways (12, 13); for instance, NO3− can inhibit methanogens by stimulating denitrification that quickly depletes substrates of methanogens. However, the specific interactions between methanogens and the N cycle are poorly understood in wetland ecosystems.
N2 fixation is a key process of the N cycle and provides a convenient solution for N limitation in aquatic and terrestrial ecosystems (14, 15). The nitrogenase complex, containing dinitrogenase reductase (encoded by nifH) and dinitrogenase, is highly conserved across the bacterial and archaeal domains (16); however, methanogens are the only archaea described to date that harbor nifH (17). Recent studies have shown the near ubiquitous distribution of archaeal nifH in a variety of ecosystem types, including marine environments, submarine hydrothermal vents, the deep sea (18, 19), oligotrophic open seas (20), and deep-sea methane seeps (21, 22). Surprisingly little attention has been paid to methanogenic N2 fixation in wetlands, even though those ecosystems have been recognized to be a major source of global methane emissions (5, 23, 24) and support diverse groups of methanogens (6, 25).
This study's ultimate objectives were to gain insight into the links between methanogenesis and the N cycle in wetland ecosystems. We determined the quantitative structure of N-cycling populations, the distribution and expression of nifH in methanogenic archaea inhabiting WCA-2A soils, and the N2-fixing activity coupled with methanogenesis through field and laboratory incubation studies. The results from these studies provide fundamental knowledge necessary for better understanding of how the N cycle responds to environmental changes such as P loading and N limitation and the potential role that methanogenic archaea play in connecting that response to methanogenesis via N2 fixation.
RESULTS
Geochemical descriptions of study sites.
The P gradient in WCA-2A was established by drainage water input from EAA via spillways along the northeastern perimeter (26). Numerous studies have been conducted on methanogens and their activities along the P gradient (5, 6, 9, 27) in three sites representing impacted (F1), intermediate (F4), and unimpacted (U3) conditions (see Fig. S1 in the supplemental material). Data collected across more than 10 years consistently showed significant differences in P concentrations between these sites (<0.05 by Tukey-Kramer honestly significant difference [HSD] test): F1, 1.0 to 1.5 g · kg dry soil−1 (1.2 ± 0.2 g · kg dry soil−1, average ± standard deviation [SD]; n = 21); F4, 0.3 to 0.9 g · kg dry soil−1 (0.6 ± 0.1 g · kg dry soil−1; n = 12); and U3, 0.2 to 0.5 g · kg dry soil−1 (0.3 ± 0.1 g · kg dry soil−1; n = 21) (see Fig. S2 in the supplemental material).
Concentrations of total carbon (TC) did not show a significant change during the last 11 years, with a slight trend toward higher TC at the nutrient-impacted site relative to the unimpacted site: F1 (444 ± 24 g · kg dry soil−1; n = 15) > F4 (412 ± 17 g · kg dry soil−1; n = 15) > U3 (358 ± 47 g · kg dry soil−1; n = 15). Water-extractable organic carbon concentrations ranged between 1.7 and 4.8 g · kg dry soil−1 (accounting for 0.5 to 1% TC) without a significant difference between sites.
Concentrations of total nitrogen (TN) ranged from 24 to 39 g · kg dry soil−1 (31 ± 3 g · kg dry soil−1; n = 45), with the highest average value observed at F4 (33 ± 2 g · kg dry soil−1; n = 15). NH4+-N and NOx-N concentrations were 19 to 128 mg · kg dry soil−1 (70 ± 23 mg · kg dry soil−1; n = 61) and 1 to 241 mg · kg dry soil−1 (54 ± 59 mg · kg dry soil−1; n = 33), respectively, with no significant difference observed between sites.
Microbial community structures.
The prokaryotic community structures in WCA-2A soils were determined using a total of 549,593 high-quality paired-end reads for 16S rRNA gene obtained from soil samples across sites F1, F4, and U3 (triplicate samples for each site) through the filtering and trimming processes described in Materials and Methods. The reads were allotted to 23,971 operational taxonomic units (OTUs) with a sequence identity cutoff of ≥97%, which were further assigned to higher taxa, creating 1,003 genera (including 22 archaeal genera), 227 classes (including 8 archaeal classes), and 70 phyla (including 3 archaeal phyla). The majority of the Bacteria were distributed among the phyla Proteobacteria, Planctomycetes, Chloroflexi, Bacteroidetes, Chlorobi, Acidobacteria, Cyanobacteria, Actinobacteria, Firmicutes, and Verrucomicrobia (see Fig. S3 in the supplemental material), which made up ≥83% of total Bacteria within each site. Archaea were distributed over three phyla: Crenarchaeota, Euryarchaeota, and Parvarchaeota, of which all made up 0.36% of the total 16S rRNA sequences.
Two classes of methanogens belonging to Methanomicrobia and Methanobacteria were identified from the small-subunit (SSU) rRNA gene sequences, which were distributed over the families Methanobacteriaceae, within Methanobacteria, and Methanocellaceae, Methanomicrobiaceae, Methanoregulaceae, Methanospirillaceae, and Methanotrichaceae (formerly Methanosaetaceae), within Methanomicrobia. The methanogen sequences comprised 61 to 86% of total Euryarchaeota sequences in each sample and constituted 0.1 to 0.27% of total 16S rRNA gene sequence data. This estimated percentage is very similar to that estimated using a quantitative real-time PCR (qPCR), in which copies of mcrA (encoding methyl coenzyme M reductase, a genetic marker for methanogens) were 0.1 to 1.04% of bacterial 16S rRNA gene copies (see Fig. S4 in the supplemental material).
P enrichment was associated with changes in the abundance and community structure of prokaryotes. The qPCR results indicated that the copy numbers of 16S rRNA genes and mcrA were significantly increased in the P-enriched sites (F1 and F4) compared with the unimpacted site (U3) (Fig. S4). The change in community structure was clearly illustrated by principal-coordinate analysis (PCoA), revealing that the sequences from sites F1, F4, and U3 were separated along axes P1 and P2 on the PCoA biplot (see Fig. S5 in the supplemental material). Those communities also exhibited significant differences in diversity, as illustrated by Chao1 richness and Faith's phylogenetic diversity, with increasing trends with P enrichment (Fig. S5).
N-cycling gene copy numbers.
N-cycling gene copy numbers were estimated via qPCR in WCA-2A soil samples collected at three different time points: April 2010, August 2012, and December 2012 (Fig. 1). The numbers of N2 fixers (the diazotrophic population) were estimated by nifH and ranged from 5.5 × 10⁸ to 1.9 × 10¹⁰ · g dry soil−1 (5.2 × 10⁹ · g dry soil−1 average) at overall WCA-2A sites.
FIG 1.

Box-and-whisker plots (top) and temporal profiles (bottom) of N-cycling gene copy numbers measured in WCA-2A soils collected in April 2010, August 2012, and December 2012 (from the left in temporal profiles). Error bars in the bar graphs (bottom) represent 1 ± standard error (SE; n = 3). Box-and-whisker plots were constructed from the data pool of temporal profiles. The different letters indicate a significant difference among the N-cycling genes (P < 0.05 by the Tukey-Kramer HSD test).
nirK and nirS were used to estimate the numbers of denitrifers; nirK and nirS encode functionally equivalent but structurally different nitrite reductases—a copper and a cytochrome cd1-containing enzyme, respectively (28). nirK copies were estimated to range from 6.4 × 10⁷ to 7.4 × 10⁹ · g dry soil−1 (1.7 × 10⁹ · g dry soil−1 average) along the P gradient, while nirS copies ranged from 1.5 × 10⁸ to 4.9 × 10⁹ · g dry soil−1 (1.5 × 10⁹ · g dry soil−1 average) at all sites.
Nitrifiers were enumerated by the copy numbers of the amoA gene, encoding ammonia monooxygenase, in both ammonia-oxidizing archaea (AOA) and ammonia-oxidizing bacteria (AOB) (29). AOA amoA copies measured along the P gradient ranged from 1.0 × 10⁵ to 4.0 × 10⁸ · g dry soil−1 (5.0 × 10⁷ · g dry soil−1 average), which outnumbered AOB amoA copies, ranging from 1.5 × 10⁵ to 7.9 × 10⁶ · g dry soil−1 (1.7 × 10⁶ · g dry soil−1 average).
nrfA encodes a periplasmic nitrite reductase that catalyzes nitrite reduction using formate (30) and is used to estimate numbers of DNRA bacteria (bacteria with dissimilatory nitrate reduction to ammonia). nrfA copies measured along P gradients ranged from 6.5 × 10⁷ to 2.0 × 10⁹ · g dry soil−1 (6.8 × 10⁸ · g dry soil−1 average).
Most N-cycling genes enumerated exhibited an increasing trend with P enrichment, with a significant difference between P-impacted sites (F1 and F4) and the unimpacted site (U3) (P < 0.05 by Tukey-Kramer HSD test); however, the copy numbers of amoA did not show a significant difference between sites due to a large temporal variation.
Distribution of nifH genes and nifH transcripts.
The phylogeny of N2 fixers was determined using NifH protein sequences translated in silico from the nifH gene or transcript sequences detected in WCA-2A soils. A total of 826 NifH protein sequences translated from 204 nifH sequences and 622 nifH transcript sequences were collected from clone libraries constructed with the field and incubation soils (described below). A maximum likelihood (ML) tree was constructed using 287 OTUs that were defined at 5% identity of those NifH protein sequences (Fig. 2). The overall structure of the ML tree is in good agreement with the tree composed of the four main clusters reported by Mehta et al. (18): that is, cluster I, comprised of Alpha-, Beta-, and Gammaproteobacteria and Cyanobacteria; cluster II, comprised of methanogens and anfH (alternative nitrogenase-encoding gene) from bacteria; cluster III, comprised of diverse anaerobes; and cluster IV, comprised of divergent methanogens. However, our tree includes many newly created branches within each cluster (18, 22) due to the addition of new sequences from WCA-2A. The branches within each cluster were divided into an additional 4 to 10 subclades.
FIG 2.

Maximum likelihood (ML) tree showing phylogenetic affiliation of NifH OTUs defined from translated nifH and nifH transcript sequences obtained from WCA-2A soils. a,g-Proteobacteria, Alpha- and Gammaproteobacteria; e-Proteobacteria, Epsilonproteobacteria; g,b-Proteobacteria, Gamma- and Betaproteobacteria; d-Proteobacteria, Deltaproteobacteria.
The 134 NifH OTUs from in silico translation of the nifH gene obtained from the year 2009 samples were distributed across 22 subclades belonging to all clusters (Fig. 3). Statistical analyses revealed that the NifH assemblages were distinct at each of the sampling stations along the P gradient. Each of the assemblages was dominated by distinct subclades: i.e., F1 by subclade III-C (belonging to Chlorobi; 21%), F4 by IV-C (Methanomicrobiales; 26%), and U3 by III-A (Deltaproteobacteria and Chloroflexi; 22%) (Fig. 2). Significant differences between the assemblages were confirmed by P values of <0.05 for phylogeny and/or Unifrac significance tests based on phylogenetic distances between the assemblages (see Fig. S6 in the supplemental material). The assemblages were also differentiated by diversity. Chao1 richness estimates predicted the presence of 211, 130, and 311 NifH OTUs at sites F1, F4, and U3, respectively, with Shannon diversity indices between 3.6 and 3.9 (see Table S1 in the supplemental material). It is worth noting that all sites harbored methanogenic N2 fixers belonging to subclades III-G, IV-B, IV-C, IV-D, IV-E, and IV-G, which comprised a significant portion of the assemblages (6 to 44%).
FIG 3.

Composition and relatedness of N2-fixing assemblages determined using nifH or nifH transcript sequences obtained from WCA-2A soils. (A) Relative abundance of individual taxa within each sample. (B) Percentage of methanogen-like N2 fixers detected within individual samples. (C) PCoA biplot showing the relatedness between N2-fixing communities occurring from individual samples. The soil samples used for determination of nifH gene and nifH transcript sequences are denoted within each panel. a-, b-, d-, e-, and g-Prot., Alpha-, Beta-, Delta-, Epsilon-, and Gammaproteobacteria, respectively; Clost., Clostridia; Euryarch., Euryarchaeota; Verruco., Verrucomicrobia.
nifH gene transcripts were also detected in the field soils of WCA-2A. Eighty-four OTUs were identified out of the NifH proteins translated in silico from 286 nifH transcript sequences obtained from the 2011 and 2012 samples, which were subsequently affiliated with 16 distinct subclades over clusters I to IV (Fig. 3A). Each site was dominated by different subclades: I-A (Cyanobacteria) dominated F1_2011 (71%) and F4_2011 (35%) soils, I-E (Gamma- and Betaproteobacteria) dominated F1_2012 soils (31%), III-H (Chloroflexi) dominated F4_2012 soils (32%), and IV-C (Methanomicrobiales) dominated U3_2012 soils (47%). This difference was reflected in phylogeny and/or Unifrac significance tests (P < 0.05) (Fig. S6). PCoA showed that nifH transcriptomes were clearly separated from nifH assemblages (Fig. 3C), indicating that transcription is not highly correlated with the distribution of specific nifH gene sequences.
Archaeal N2 fixers (e.g., subclades IV-C, IV-D, and IV-G) were found to express nifH gene in field soils, accounting for up 2 to 49% of total nifH gene transcript sequences (Fig. 3B). The nifH gene transcript originating from methanogens comprised a low portion of total transcript in F1 and F4 soils (accounting for 2 to 8% of total) that were dominated by the transcript derived from photosynthetic Cyanobacteria (I-A) and/or aerobic Gamma- or Betaproteobacteria (I-E), while 49% of nifH gene transcripts in U3 soils clustered with methanogens.
N2 fixation and methanogenesis in soil incubations.
N2 fixation associated with methanogenesis was evaluated with laboratory incubations using WCA-2A soils under putative methanogenic conditions, for which two approaches were conducted: (i) addition of H2 and CO2 (H2+CO2; 80:20 [vol/vol]) or acetate as directly usable substrates and (ii) cellulose as an additional source of electrons.
(i) Incubation with H2+CO2 or acetate.
Supplemental H2+CO2 stimulated nitrogenase activity in soil incubations, as indicated by increases in acetylene reduction rates and 15N2 incorporation rates (Fig. 4). The acetylene reduction assay (ARA) is one of the most common approaches to measuring nitrogenase activity (31). In 11 days, 0.5 to 3.6 μmol of acetylene per g soil was reduced with H2+CO2 addition, which was >10 times higher than the concentration (0.05 to 0.18 μmol · g dry soil−1) observed in the incubation with no addition of H2+CO2 (controls). H2+CO2 addition concurrently increased 15N incorporation between 29 and 102‰, which is more than 20-fold greater than those of the controls (1.4 to 4.4‰). Along with the increases in nitrogenase activity, H2+CO2 addition led to much higher CH4 production (between 61 to 270 μmol · g dry soil−1) in 11 days than that of controls (7 to 46 μmol · g dry soil−1). The addition of acetate (4 mM) did not show an apparent increase in CH4 production or an increase in nitrogenase activity compared with controls.
FIG 4.
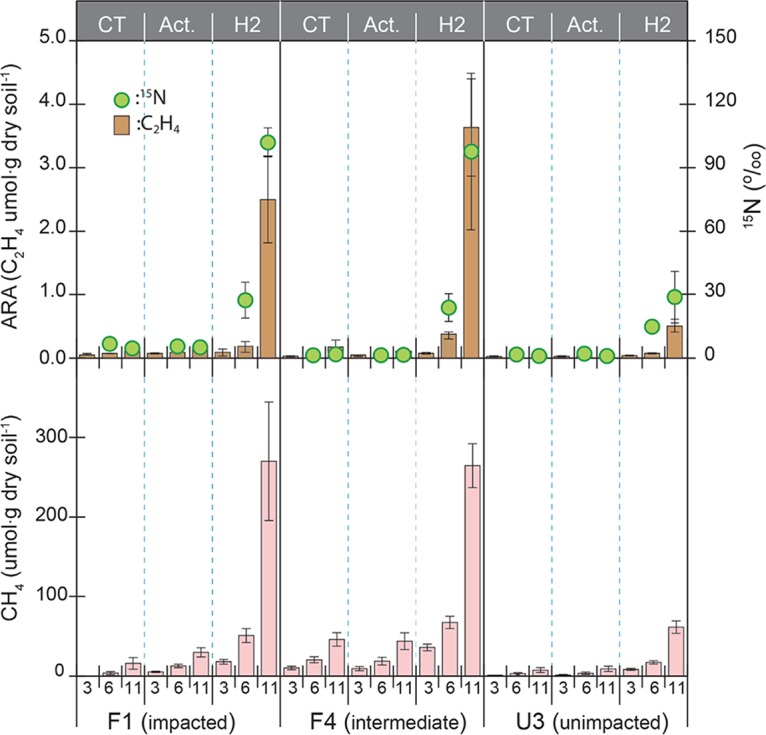
Nitrogenase activities (top) and methane production (bottom) in incubation with WCA-2A soils. The soil was supplemented with 4 mM acetate (Act.) or H2+CO2 (80:20 [vol/vol]) (H2) or was a control with no addition of substrate (CT). Soil used for this incubation was sampled in August 2012. The sampling days 3, 6, and 11 for determination of CH4 production and nitrogenase activities are denoted in the x axis of the bottom graph. Error bars represent ±1 standard deviation (SD) from three replicates.
In the H2+CO2 incubation study, relatively-high-P sites (F1 and F4) produced >3-fold higher rates of N2 fixation and CH4 production than the low-P site (U3), suggesting that P loading (with constant N) increases the demand for N2 fixation from methanogens, likely due to the increased population size and the increased competition for inorganic N.
nifH gene transcript was assessed on the 6th day of H2+CO2 incubation, at the point showing a sharp increase in nitrogenase activity and methane production. Twenty-five NifH protein sequences translated from 116 nifH gene transcript sequences were assigned to 11 distinct subclades, among which 7 were affiliated with methanogen branches: II-D, III-E, III-G, IV-C, IV-D, IV-E, and IV-G (Fig. 5). The methanogenic groups constituted 80%, 54%, and 14% of total sequences from F1, F4, and U3 soils, respectively. Subclade II-D appeared to be the most dominant group out of methanogenic clades in F1 (77%), with a decreasing trend in sites with less P loading: i.e., F4 (40%) and U3 (5%). This clade was related to the hydrogenotrophic methanogens belonging to the orders Methanosarcinales, Methanobacteriales, and Methanococcales.
FIG 5.

Composition and relatedness between nifH transcripts in the soil incubations. (A) Composition of nifH transcript in incubation with H2+CO2 or cellulose. (B) Percentage of methanogen-like nifH transcript sequences. (C) PCoA biplot representing relatedness between nifH transcript assemblages in incubations, which were also compared with those from field soils. For definitions of the abbreviations in panel A, see the legend to Fig. 3.
(ii) Incubation with cellulose.
The addition of cellulose increased the production rate of the fermentation products propionate and acetate, which accumulated up to 40 μmol · g dry soil−1 in 14 days of incubation (see Fig. S7 in the supplemental material). H2 was also formed as a fermentation product; however, its concentration did not exceed 1 μmol · g dry soil−1, perhaps due to a lower production rate compared with organic acids and/or rapid consumption by H2 consumers.
Cellulose (5 g · liter−1) incubations produced CH4, coincidently exhibiting a high nitrogenase activity at much higher level than controls (Fig. 6). Enrichments from F1 showed much higher CH4 production and acetylene reduction (168 and 15 μmol · g dry soil−1, respectively) than F4 (148 and 13 μmol · g dry soil−1, respectively) and U3 (11 and 1 μmol · g dry soil−1, respectively).
FIG 6.
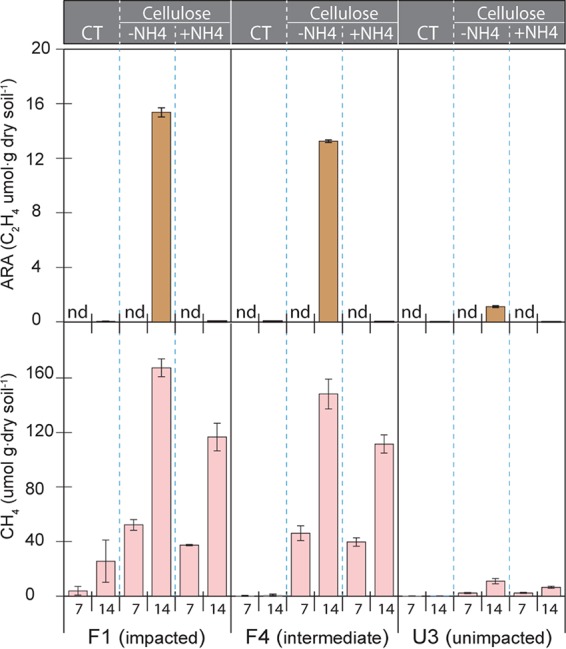
Nitrogenase activities (top) and methane production (bottom) in the incubation of WCA-2A soils sampled in January 2012. The soil incubation was supplemented with cellulose along with (+NH4+) or without (−NH4+) ammonium chloride (100 mM). The incubations without cellulose additions were used as the control treatment (CT). Methane concentrations and acetylene reduction (ARA) were determined for days 7 and 14 and are denoted on the x axis of the bottom graph. Error bars represent ±1 SD from three replicates. nd, not determined.
In order to assess CH4 production in the absence of N2 fixation, the cellulose incubation was conducted in parallel, with an addition of excessive NH4+ (100 mM). The NH4+ addition enhanced the production of propionate and acetate from cellulose fermentation by approximately double the levels observed in the cellulose incubation with no addition of NH4+. Nevertheless, this addition significantly reduced CH4 production by 25 to 40% lower than those with no added N and completely inhibited nitrogenase activity (Fig. 6). It should be noted that the NH4+ level added in these experiments is very high compared with NH4+ concentrations observed in WCA-2A field soils (≤1 mM). Preliminary experiments were conducted with a range of NH4+ concentrations (0, 1, 5, 50, 100, and 200 mM [data not shown]) to determine the optimum concentration of NH4+ required to inhibit nitrogen fixation. Both 50 and 100 mM NH4+ completely inhibited N2 fixation, and 100 mM NH4+ was selected to ensure complete inhibition.
nifH transcripts were analyzed from soil samples taken on the 7th day of cellulose incubation, when the nitrogenase activity and CH4 production sharply increased. Fifty-six NifH OTUs generated from 220 nifH transcript sequences were affiliated with 14 subclades in the ML tree, among which 3 OTUs belonged to the methanogen clusters II-D, III-G, and IV-G (Fig. 5A). Clade III-G was the most highly enriched group, constituting 43 to 82% of nifH gene transcript sequences detected. Most sequences (97%) within this clade were closely related to the obligatory acetotrophic species Methanothrix concilii (originally Methanosaeta concilii), and the rest (3%) were related to a facultative acetotrophic species, Methanosarcina acetivorans.
The PCoA plot in Fig. 5C illustrates the clear separation along axis PC2 (explaining 18.94% of the variation) of the nifH-expressing N2 fixer assemblages in cellulose incubations from those in the H2+CO2 incubations. Those assemblages were also distinguished along axis PC1, explaining 26.7% variation from the nifH-expressing populations in field soils. The assemblages detected in field samples were also separated by sampling time (2011 and 2012), indicating that nifH transcription is very sensitive to species of substrate availability and to spatial/temporal changes in environmental conditions.
DISCUSSION
Both N and P are essential nutrients for life and frequently limit primary productivity (32, 33). In recent decades, great progress has been made in determining how P limitation impacts methane production in WCA-2A (5, 6, 9, 27); however, little attention has been paid to the interactions between N and methane production in this wetland. The present study was intended to explore potential linkages between the N cycle and methane production from a variety of perspectives. In the Everglades, P loading resulted in increases in various steps of the N cycle: e.g., increasing rates of organic N mineralization (34, 35), N assimilation (36), denitrification (37), and N2 fixation (38). Although P loading has been reported to stimulate organic N mineralization, sites F1 and F4 were not enriched in NH4+ or NOx-N compared with U3 (Fig. S2). The lack of enrichment in inorganic N is likely due to increased removal of N via denitrification and by assimilation and is characteristic of the shift toward N limitation reported by Corstanje et al. (4) at these sites.
The response of microbes to P loading and N limitation within WCA-2A is reflected in the abundance of key N-cycling populations as determined by qPCR of corresponding gene markers (Fig. 1). The N2 fixers were the most numerous of these in all samples. N2-fixing populations were highly enriched in the nutrient-impacted sites, as expected from previous reports on P-driven N limitation in WCA-2A (4). Nitrifiers and denitrifiers were also observed in higher numbers at the high-P sites, which contribute to N limitation via removal of NH4+ and NOx-N. The activities of nitrifiers and denitrifiers were demonstrated in earlier studies conducted at these sites (37, 39). P enrichment was also associated with an enrichment of DNRA bacteria, as indicated by the increased copy numbers of nrfA at those sites. However, nrfA copy numbers were greatly outnumbered by denitrifying gene (nirK plus nirS) copy numbers, with a difference of ≥2 orders of magnitude. DNRA competes with denitrification for NO3− (40). The relative rates of DNRA and denitrification at this site are not known at this time.
Analysis of nifH gene sequences indicated that between 16 and 44% of nifH copies detected from WCA-2A sediments clustered with the methanogen-like lineages belonging to the orders Methanosarcinales (subclade III-G), Methanococcales (IV-B and IV-D), Methanomicrobiales (IV-C), and Methanobacteriales (IV-D and IV-G) (Fig. 2). Methanogens make up a relatively small proportion of the total WCA-2A microbes, of which 16S rRNA gene sequences clustering with methanogens constituted only 0.27% of the total number of 16S rRNA gene sequences. Similarly, the copy numbers of mcrA corresponded to only 0.26% of bacterial 16S rRNA gene copies (Fig. S4). The fact that the relatively high percentage of nifH gene sequences originated from such low-abundance lineages strongly suggests that methanogens make a very significant contribution to N2 fixation at these sites. High concentrations of methanogen nifH copies were also reported in hydrothermal vent fluids and deep-seawater, which constituted 20 to 100% of total nifH gene sequences detected (18). To the best of our knowledge, all of the 7 orders of methanogens possess the nifH gene; therefore, it is possible that methanogen nifH might be found in all environments where methanogens are present.
nifH transcript sequences have been used previously as an indicator of nitrogenase activity (41, 42). WCA-2A field soils were found to harbor divergent methanogenic archaea that transcribe nifH (Fig. 3). Among the methanogen clades (e.g., IV-C, IV-D, and IV-G), IV-C was found in all sites across the P gradient, making up between 2 and 49% of total nifH transcript sequences detected. This clade is affiliated with the hydrogenotrophic Methanomicrobiales, the dominant methanogenic order in WCA-2A soils (≥50% of total methanogens) (6). The high level of nifH transcript produced by IV-C strongly suggests that hydrogenotrophic methanogenesis is a major factor in N2 fixation in WCA-2A soils.
The functional linkage between N2 fixation and methanogenesis was evaluated in laboratory incubations of WCA-2A soils with different electron donors with and without supplemental N. The addition of H2+CO2 stimulated N2 fixation, coinciding with CH4 production (Fig. 4). N2 fixation coupled with methanogenesis is supported by high transcription of nifH from the hydrogenotrophic methanogens (clades II-D, III-E, III-G, IV-C, IV-D, IV-E, and IV-G) (Fig. 5). The transcription of nifH from a specific group of methanogens with nitrogenase activities suggests that that methanogen group carries out the N2 fixation coupled with methanogenesis because N2 fixation is an energy-intensive process and methanogenesis is the only known energy-generating process in methanogens. In contrast to the addition of H2+CO2, the addition of acetate did not significantly increase methanogenesis or N2 fixation. The simplest explanation is that acetate was rapidly depleted by other acetate-consuming microbes, such as sulfate-reducing bacteria, that have been reported to efficiently compete with acetotrophic methanogens in these soils (6).
The cellulose incubation was subsequently conducted such that fermentation would supply a variety of electron donors (e.g., a variety of organic acids and H2) for methane production and N2 fixation. The fermentation products could also be utilized by competing anaerobic processes, depleting alternative electron acceptors such as SO42− and Fe(III). The nifH transcripts were largely derived from obligatory acetotrophs belonging to Methanothrix (originally Methanosaeta) species (clade III-G) (Fig. 5), which indicates that the acetotrophs produced methane to gain energy for the N2 fixation in the cellulose incubation. Even though acetotrophic methanogens produced nifH transcripts under relatively artificial conditions, we did not detect Methanothrix nifH transcripts in field soils (Fig. 3). Methanothrix represents the majority of methanogens in WCA-2A, accounting for between 22 and 32% of total methanogens (6). It may be that those acetotrophs in the field rely on external N sources rather than N2 fixation.
When NH4+ (100 mM) was added to the cellulose incubations, nitrogenase activity was inhibited, likely through an ammonia switch-off regulation (43), and the CH4 production rate significantly decreased (Fig. 6). The increased CH4 production in the absence of supplemental NH4+ has been observed before in pure cultures (44) and is thought to be due to the additional energy required for N2 fixation. Few studies have been conducted on the energetics of CH4 production during N2 fixation, and most, if not all, of those were conducted on thermophilic methanogens in pure culture (44, 45). Fardeau et al. (44) compared the growth of the thermophilic hydrogenotrophs Methanobacterium thermautotrophicum and Methanococcus thermolithotrophicus on NH4+ and with N2 as a nitrogen source. The maintenance coefficients for both strains were significantly higher in continuous culture at similar gas flow rates during growth on N2 compared with NH4+. For example, the maintenance coefficient for M. thermoautotrophicum was 0.168 mol CH4 h−1 g−1 during growth on N2, compared with 0.065 mol CH4 h−1 g−1 for growth on NH4+, indicating that over twice as much CH4 was produced per cell during N2 fixation. At least some of the additional CH4 produced in those experiments was assumed to be due to the increased energy required for N2 fixation; however, some energy may be used to produce the carbon storage polymer glycogen during N limitation (46).
Peat N contents are largely dependent upon input from N2 fixation and atmospheric deposition. Larmola et al. (15) reported CH4 oxidation coupled with N2 fixation during N accumulation in peatlands. Vile et al. (47) found that methanotrophic aerobes substantially contribute to N2 fixation. Those studies shed light on the linkage between the N cycle and CH4 and, consequently, on regulation of the rates of CH4 emission in peatlands under aerobic conditions. Our study extends this concept to anoxic conditions, where methanogens regulate the rate of CH4 production, while aerobic methanotrophs degrade this compound.
In conclusion, numerous studies have described the distribution of methanogens capable of N2 fixation in diverse environments, and the genetics and biochemistry of N2 fixation in methanogens have been characterized (16, 17, 19) following its first report in 1984 (48, 49). The present study explored the distribution of nifH in the Everglades and found that methanogenic archaea are a key group harboring and expressing nifH. N2 fixation is central to the response of microbial communities to nutrient limitation in the Everglades wetlands and is tightly coupled with methane production. The rates of methane production in the Everglades may be a function of methanogenic N2 fixation, such that a complete understanding of methane production in wetlands should include the response of methanogens to N limitation. While this study has been conducted exclusively in the relatively-high-pH (circumneutral) regions of the Everglades, a subtropical peatland, it is likely that methanogenic nitrogen fixation is important in many temperate and tropical N-limited peatlands. The contribution of methanogenic N2 fixation to the N cycle in general methanogenic communities is not clear at this time and requires further study.
MATERIALS AND METHODS
Sampling and sample processing.
Triplicate soil cores were collected from sites F1 (26°21′39″ N, 80°22′10″W), F4 (26°18′59″N, 80°23′01″W) and U3 (26°17′15″N, 80°24′41″W) (see Fig. S1 in the supplemental material) in October 2009, April 2010, August 2011, and January, August, and December 2012. Plant roots and detritus (floc) covering soils were removed before slicing of the soil cores at 4-cm intervals. The top 4 cm of soil was mixed in a polyethylene ziplock bag. Subsamples (50 to 100 g) of mixed soil were immediately frozen on dry ice for transport to the laboratory, where they were stored at −80°C until isolation of nucleic acids. The remaining unfrozen soil was transported to the laboratory on the same date of sampling for use in the incubation study. In addition to the soils sampled, 10-liter surface water samples were collected from each site in precleaned carboys for incubation studies and stored at 4°C until use. The soil and water samples were used within 1 week of sampling.
Nucleotide isolation and cDNA preparation.
Soil samples were homogenized with a mortar and pestle under liquid nitrogen before isolation of nucleic acids. DNA was isolated from 0.2 g (wet weight) of soil samples using a Power Soil DNA isolation kit (MoBio Laboratories, Carlsbad, CA).
RNA was isolated from 2.0 g of wet soils using a PowerSoil total RNA isolation kit (MoBio Laboratories, Carlsbad, CA), followed by the removal of residual DNA from RNA extracts using an RTS DNase kit (MoBio Laboratories, Carlsbad, CA). cDNA was synthesized from RNA with the SuperScriptIII first-strand synthesis SuperMix, including random hexamers as reverse transcriptase PCR primers (Invitrogen, Carlsbad, CA).
The quality of DNA and RNA isolated was assessed by 1.5% ethidium bromide-stained agarose gel electrophoresis. All nucleic acids (DNA, RNA, and cDNA) were stored at −80°C until use.
Next-generation Illumina sequencing for the 16S rRNA gene.
Libraries for 16S rRNA gene sequencing were prepared from extracted DNA using the 16S rRNA metagenomic sequencing library preparation protocol from Illumina (https://support.illumina.com). Briefly, the V3-V4 region of the 16S rRNA genes was amplified using primers Bakt_341F and Bakt_805R (50), followed by the incorporation of Illumina adapter nucleotide sequences. A paired-end library was prepared using the Nextera XT Index kit (Illumina, San Diego, CA). Amplicons were cleaned using Agencourt AMPure XP beads (Beckman Coulter Genomics, Indianapolis, IN) and quantified using the Quant-iT PicoGreen double-stranded DNA (dsDNA) assay kit (Invitrogen/Life Technologies, Grand Island, NY) on a Spectra Max fluorescence microplate reader (Molecular Devices, Sunnyvale, CA). All samples were pooled in equimolar concentrations and delivered to the University of Florida Sequencing Core Laboratory (http://www.biotech.ufl.edu/) for sequencing on an Illumina MiSeq platform using the MiSeq V3 reagent kit (Illumina, San Diego, CA).
Quantitative Insights Into Microbial Ecology (QIIME) version 1.9.1 (51) was used for all the Illumina sequence analyses, unless otherwise noted. The paired-end 16S rRNA gene sequences, which were demultiplexed on the MiSeq instrument, were joined and quality filtered using default settings (phred q20) (52). Chimeric sequences were identified and removed with the usearch61 algorithm (53) using the RDP Gold database as reference. The OTU picking, which assigns the cleaned reads to OTUs, was performed using the Usearch16 algorithm against the Greengenes 16S rRNA database (54), clustered at 97% pairwise identity. The number of reads before and after the above trimming processes and the resulting OTU number for each sample are included in Table S1 in the supplemental material. Sequences were aligned to the Greengenes reference alignment using PyNAST (51), and a phylogenetic tree was constructed with FastTree according to the standard procedures within QIIME (55). OTU tables and tree files generated in the OTU-picking step served as the main inputs for the core diversity analyses at even sequence depth for all samples (23,505 reads per sample) under script “core_diversity_analyses.py,” which generates the taxonomy summary and the alpha and beta diversity analyses as output files.
Analysis of nifH and nifH transcript sequences.
nifH sequences were amplified from DNA or cDNA using primers nifH-F and nifH-R and the PCR conditions described by Mehta et al. (18). The PCR amplicons (∼400 bp) were cloned using a TOPO TA cloning kit for sequencing (Invitrogen, Carlsbad, CA), followed by transformation of the clone mixture into Escherichia coli TOP10 electrocompetent cells. The transformants were screened on LB plates containing 50 mg · liter−1 kanamycin after overnight incubation at 37°C. The randomly selected transformants were sent to the University of Florida Sequencing Core Laboratory (http://www.biotech.ufl.edu) for sequencing of the inserts.
The phylogeny of nifH was analyzed using the deduced amino acid sequences (NifH) with the reference sequences from the public database at the National Center for Biotechnology Information (http://www.ncbi.nlm.nih.gov). The sequences were aligned using ClustalX 2.0 (56) and edited in BioEdit v7.1.3 (57). OTUs were defined with a 5% cutoff in NifH protein sequences using the furthest-neighbor method in mothur v.1.32.1 (58). The use of OTUs based on deduced amino acid sequences increases the taxonomic resolution relative to nucleotide sequences, such that deduced amino acids are frequently used for assignment of the taxonomic affiliation of functional genes such as nifH. The phylogeny of representative OTUs was analyzed using the maximum likelihood method and MEGA v6.0 program (59) with bootstrap analysis (1,000 replications) and the nearest-neighbor-interchange method as a tree inference option.
The OTUs were used for determination of alpha (diversity within samples) and beta diversity (diversity between samples) using packages in the programs mothur (58) and Unifrac (60), respectively.
qPCR.
Estimation of gene copies was performed using a SYBR green I-based quantitative real-time PCR (qPCR) in a StepOnePlus real-time PCR system (Applied Biosystems, Foster City, CA). The PCR mixtures comprised 10 μl of iQ SYBR green supermix (Bio-Rad Laboratories, Hercules, CA), 1 μl each of forward and reverse primer from stock solutions (10 μM), and 2 μl of DNA template in a final volume of 20 μl.
Previously described primers and PCR conditions were employed for quantification of genes of bacterial 16S rRNA (61), amoA (29, 62), nirK (63) and nirS (64), nrfA (30, 65), nifH (18), and mcrA (25) (Table 1).
TABLE 1.
Primer set and their sequences used in this study
| Target gene | Primer name | Primer sequence (5′ to 3′) | Reference(s) |
|---|---|---|---|
| AOA | |||
| amoA | Crenamo A23f | ATGGTCTGGCTWAGACG | 62 |
| Crenamo A616r | GCCATCCATCTGTATGTCCA | ||
| AOB | |||
| amoA | amoA 1f | GGGGTTTCTACTGGTGGT | 29 |
| amoA 2r | CCCCTCKGSAAAGCCTTCTTC | ||
| nirK | nirK 876 | ATYGGCGGVCAYGGCGA | 63 |
| nirK 1040 | GCCTCGATCAGRTTRTGGTT | ||
| nirS | nirS Cd3aF | AACGYSAAGGARACSGG | 64 |
| nirS R3cd | GASTTCGGRTGSGTCTTSAYGAA | ||
| nrfA | nrfAF2aw | CARTGYCAYGTBGARTA | 30, 65 |
| nrfAR1 | TWNGGCATRTGRCARTC | ||
| nifH | nifH-F | GGHAARGGHGGHATHGGNAARTC | 18 |
| nifH-R | GGCATNGCRAANCCVCCRCANAC |
All qPCR runs were followed by an image capture step (15 s at 83°C) after a final extension step of each cycle. When the PCR amplification was completed, a melt curve analysis was conducted by increasing the temperature from 60 to 95°C in 0.5°C increments every 10 s. All sample DNAs and standard DNAs were assayed in triplicate. Every qPCR run included standard plasmid DNA carrying the gene fragment of interest in order to make a standard curve. Standard DNA plasmids were made by cloning the target gene fragment amplified from some of environmental soils as described previously (66, 67). Plasmid DNA was linearized using the endonuclease PstI (Thermo Fisher Scientific, Waltham, MA) according to the manufacturer's instructions, followed by purification with the QIAquick PCR purification kit (Qiagen, Valencia, CA).
The prepared standards were stored in aliquots at −80°C, and a separate standard was used for each qPCR run. Serial dilutions of the linearized plasmid DNA plasmid over 6 orders of magnitude were run during each qPCR to generate standard curves. The standard curve was made by plotting the relative fluorescence units at a threshold cycle (CT) value against the logarithm of the copy number of the standard plasmid DNA. The copy number in each reaction was calculated by the following formula: molecules (gene copies) of DNA = (mass [in g] × Avogadro's no.)/(avg mol mass of base × template length), where the average mass of a base pair was assumed to be 650 Da. The PCR efficiency (E) was calculated from the slope of the standard curve by using the formula E = 10−1/slope − 1. Under the given PCR conditions, all of the standards amplified with PCR efficiencies of between 78.3 and 98.7% and R2 values of >0.998 (Table S2), with sequences of each primer. Gene copies were determined per gram of sediment soil (dry weight).
Soil incubation experiments.
Soil incubations were conducted through two sets of separate experiments with different substrates. Each treatment was conducted in triplicate using 3 core soils sampled from each site. All incubations were performed at 28°C in the dark. Bottles were shaken by inversion a few times every day.
(i) Incubation with acetate or H2+CO2.
Five grams of soil (wet weight) sampled in August 2011 were mixed with 15 ml of a mineral salt medium (MSM) in a 60-ml serum bottle closed with a rubber stopper and aluminum seal. MSM has the same composition as BCYT-R (68), except for lacking peptone and yeast extract. The headspace gas of the bottles was exchanged by flushing N2 through syringe needles for 10 min. Methane production was measured in triplicate bottles supplemented with either 4 mM acetate or a mixture of H2+CO2 (80% + 20% [vol/vol]) to 50 kPa. Bottles with no substrate addition were used as controls. The CH4 concentrations were analyzed on days 3, 6, and 11, as described below.
ARAs were performed to measure the potential activity of nitrogenase in one set of triplicate bottles supplemented with substrate as described above. Acetylene, which was generated from CaC2+H2O, was introduced into the bottles to create an approximately 10% headspace concentration. The ethylene produced from acetylene was measured on days 3, 6, and 11, as described below.
15N2 incorporation was determined as a more direct measurement of assessing nitrogenase activity compared with ARA. Two sets of triplicate bottles (a total of 6 bottles for each site) were supplemented with substrates as described above. 15N2 was introduced into the bottles to amount to approximately 20% headspace. On days 6 and 11, triplicate bottles were placed at −80°C to stop the reaction and preserve them until analysis of 15N2 incorporation.
(ii) Incubation with cellulose.
Five grams of soil (wet weight) sampled in January 2012 was mixed with 15 ml of surface water collected from each site in 60-ml serum bottles closed with rubber stoppers and aluminum seals. To each of the bottles, 0.1 g of cellulose powder was added as the substrate with or without 100 mM NH4+. For soil from each site, three sets of triplicate bottles (a total of 9 bottles) were prepared for treatments: treatment A, no substrate addition; treatment B, cellulose without NH4+, and treatment C, cellulose with NH4+. On days 7, 14, and 21, methane concentrations were measured from triplicate bottles.
For ARAs, half of the incubated soils were transferred to a new 60-ml bottle on day 7 and closed with rubber stoppers and aluminum seals, followed by flushing the headspace with N2 for 10 min. After addition of acetylene to ∼10% of the headspace, the bottles were reincubated for 5 days and then analyzed for ethylene production.
Analytical methods.
The CH4 concentrations in soil incubation bottles were measured from the headspaces using a Shimadzu 8A gas chromatograph equipped with a Carboxen 1000 column (Supelco, Bellefonte, PA) and a flame ionization detector operating at 110°C as described previously (5). The CH4 concentrations in the aqueous phases were calculated using Henry's law constant for CH4 (69).
The H2 concentrations in incubation bottles were measured from the headspaces using a Peak Performer 1 gas analyzer (Peak Laboratories, Mountain View, CA) with a reducing compound photometer as described in our previous study (6).
Short-chain fatty acids (e.g., acetate, propionate, and butyrate) produced during cellulose incubation were measured from the incubation liquid using a high-pressure liquid chromatography system (Waters 2695; Waters Corp., Milford, MA) equipped with a Platinum EPS C8 column (1.6 by 250 mm; Alltech, Deerfield, IL) under a gradient profile composed of two mobile phases as described in our previous work (6, 70).
Ethylene (C2H4) formed from acetylene during the ARA was measured from the headspace of bottles using a Shimadzu 8A gas chromatograph equipped with a Poropak-N column (Supelco, Bellefonte, PA) and a flame ionization detector operating at 80°C as described previously (38).
The 15N2 incorporation to biomass was determined on dried, ground soil samples from incubation using a Finnigan MAT Delta Plus isotopic ratio mass spectrometer (Finning Corp., San Jose, CA) as previously described (71).
NOx-N and NH4+-N concentrations were determined by the UF Analytical Services Laboratory (http://soilslab.ifas.ufl.edu) according to EPA methods 353.2 (72) and 350.1 (73), respectively.
Statistical analyses.
Analyses of variance (ANOVA) were performed in JMP Pro 13 (SAS Institute, Inc., Cary, NC) to assess differences of geochemical parameters and gene copies between samples. All posttest comparisons of means were accomplished using a Tukey-Kramer HSD test, adjusted for the overall error rates. A P value of <0.05 was considered significant.
Accession number(s).
The GenBank accession numbers for the sequences determined in this study are KX458255 to KX458457 for the DNA nifH gene and KX496043 to KX496326, KX523486 to KX523601, and KX524984 to KX525203 for the nifH gene transcript. Small-subunit rRNA sequences obtained from Illumina MiSeq were deposited in the National Center for Biotechnology Information (NCBI) Sequence Read Archive (SRA) under accession no. PRJNA358013.
Supplementary Material
ACKNOWLEDGMENT
This research was supported by a grant from the National Science Foundation (DEB 0841596).
Footnotes
Supplemental material for this article may be found at https://doi.org/10.1128/AEM.02222-17.
REFERENCES
- 1.van Amstel A. 2012. Methane. A review. Integr Environ Sci 9:5–30. doi: 10.1080/1943815X.2012.694892. [DOI] [Google Scholar]
- 2.DeBusk WF, Reddy KR, Koch MS, Wang Y. 1994. Spatial distribution of soil nutrients in a northern Everglades marsh: Water Conservation Area 2A. Soil Sci Soc Am J 58:543–552. doi: 10.2136/sssaj1994.03615995005800020042x. [DOI] [Google Scholar]
- 3.Craft CB, Richardson CJ. 2008. Soil characteristics of the Everglades peatland, p 59–72. In Richardson CJ. (ed), The Everglades experiments: lessons for ecosystem restoration. Springer, New York, NY. [Google Scholar]
- 4.Corstanje R, Reddy KR, Prenger JP, Newman S, Ogram A. 2007. Soil microbial eco-physiological response to nutrient enrichment in a sub-tropical wetland. Ecol Indic 7:277–289. doi: 10.1016/j.ecolind.2006.02.002. [DOI] [Google Scholar]
- 5.Castro HF, Ogram A, Reddy KR. 2004. Phylogenetic characterization of methanogenic assemblages in eutrophic and oligotrophic areas of the Florida Everglades. Appl Environ Microbiol 70:6559–6568. doi: 10.1128/AEM.70.11.6559-6568.2004. [DOI] [PMC free article] [PubMed] [Google Scholar]
- 6.Bae H-S, Holmes E, Chanton J, Reddy KR, Ogram A. 2015. Distribution, activities, and interactions of methanogens and sulfate reducing prokaryotes in the Florida Everglades. Appl Environ Microbiol 81:7431–7442. doi: 10.1128/AEM.01583-15. [DOI] [PMC free article] [PubMed] [Google Scholar]
- 7.DeBusk WF, Reddy KR. 1998. Turnover of detrital organic carbon in a nutrient impacted Everglades marsh. Soil Sci Soc Am J 62:1460–1468. doi: 10.2136/sssaj1998.03615995006200050045x. [DOI] [Google Scholar]
- 8.Wright AL, Reddy KR. 2001. Heterotrophic microbial activities in northern Everglades wetland. Soil Sci Soc Am J 65:1856–1864. doi: 10.2136/sssaj2001.1856. [DOI] [Google Scholar]
- 9.Holmes ME, Chanton JP, Bae H-S, Ogram A. 2014. Effect of nutrient enrichment on δ13CH4 and the methane production pathway in the Florida Everglades. J Geophys Res Biogeosci 119:1267–1280. doi: 10.1002/jgrg.20122. [DOI] [Google Scholar]
- 10.Falkowski PG, Fenchel T, DeLong EF. 2008. The microbial engines that drive Earth's biogeochemical cycles. Science 320:1034–1039. doi: 10.1126/science.1153213. [DOI] [PubMed] [Google Scholar]
- 11.Thamdrup B. 2012. New pathways and processes in the global nitrogen cycle. Annu Rev Ecol Evol Syst 43:407–428. doi: 10.1146/annurev-ecolsys-102710-145048. [DOI] [Google Scholar]
- 12.Gärdenäs AI, Ågren GI, Bird JA, Clarholm M, Hallin S, Ineson P, Kätterer T, Knicker H, Nilsson SI, Näsholm T, Ogle S, Paustian K, Persson T, Stendahl J. 2011. Knowledge gaps in soil carbon and nitrogen interactions from molecular to global scale. Soil Biol Biochem 43:702–717. doi: 10.1016/j.soilbio.2010.04.006. [DOI] [Google Scholar]
- 13.Bodelier PLE, Steenbergh AK. 2014. Interactions between methane and the nitrogen cycle in light of climate change. Curr Opin Environ Sustain 9-10:26–36. [Google Scholar]
- 14.Zehr JP, Kudela RM. 2011. Nitrogen cycle of the open ocean: from genes to ecosystems. Annu Rev Mar Sci 3:197–225. doi: 10.1146/annurev-marine-120709-142819. [DOI] [PubMed] [Google Scholar]
- 15.Larmola T, Leppännen SM, Tuittila ES, Aarve M, Merilä P, Fritze H, Tiirola M. 2014. Methanotrophy induces nitrogen fixation during peatland development. Proc Natl Acad Sci U S A 111:734–739. doi: 10.1073/pnas.1314284111. [DOI] [PMC free article] [PubMed] [Google Scholar]
- 16.Zehr JP, Jenkins BD, Short SM, Steward GF. 2003. Nitrogenase gene diversity and microbial community structure: a cross-system comparison. Environ Microbiol 5:539–554. doi: 10.1046/j.1462-2920.2003.00451.x. [DOI] [PubMed] [Google Scholar]
- 17.Leigh JA. 2000. Nitrogen fixation in methanogens: the archaeal perspective. Curr Issues Mol Biol 2:125–131. [PubMed] [Google Scholar]
- 18.Mehta MP, Butterfield DA, Baross JA. 2003. Phylogenetic diversity of nitrogenase (nifH) genes in deep-sea and hydrothermal vent environments of the Juan de Fuca Ridge. Appl Environ Microbiol 69:960–970. doi: 10.1128/AEM.69.2.960-970.2003. [DOI] [PMC free article] [PubMed] [Google Scholar]
- 19.Mehta MP, Baross JA. 2006. Nitrogen fixation at 92°C by a hydrothermal vent archaeon. Science 314:1783–1786. doi: 10.1126/science.1134772. [DOI] [PubMed] [Google Scholar]
- 20.Man-Aharonovich D, Kress N, Zeev EB, Berman-Frank I, Beja O. 2007. Molecular ecology of nifH genes and transcripts in the eastern Mediterranean Sea. Environ Microbiol 9:2354–2363. doi: 10.1111/j.1462-2920.2007.01353.x. [DOI] [PubMed] [Google Scholar]
- 21.Dang HY, Luan XW, Zhao JY, Li J. 2009. Diverse and novel nifH and nifH-like gene sequences in the deep-sea methane seep sediments of the Okhotsk Sea. Appl Environ Microbiol 75:2238–2245. doi: 10.1128/AEM.02556-08. [DOI] [PMC free article] [PubMed] [Google Scholar]
- 22.Dang HY, Yang JY, Li J, Luan XW, Zhang YB, Gu G, Xue R, Zong M, Klotz MG. 2013. Environment-dependent distribution of sediment nifH-harboring microbiota in the northern South China Sea. Appl Environ Microbiol 79:121–132. doi: 10.1128/AEM.01889-12. [DOI] [PMC free article] [PubMed] [Google Scholar]
- 23.Galand PE, Fritze H, Yrjala K. 2003. Microsite-dependent changes in methanogenic populations in a boreal oligotrophic fen. Environ Microbiol 5:1133–1143. doi: 10.1046/j.1462-2920.2003.00520.x. [DOI] [PubMed] [Google Scholar]
- 24.Chin KJ, Lueders T, Friedrich MW, Klose M, Conrad R. 2004. Archaeal community structure and pathway of methane formation on rice roots. Microb Ecol 47:59–67. doi: 10.1007/s00248-003-2014-7. [DOI] [PubMed] [Google Scholar]
- 25.Steinberg LM, Regan JM. 2008. Phylogenetic comparison of the methanogenic communities from an acidic, oligotrophic fen and an anaerobic digester treating municipal wastewater sludge. Appl Environ Microbiol 74:6663–6671. doi: 10.1128/AEM.00553-08. [DOI] [PMC free article] [PubMed] [Google Scholar]
- 26.Reddy KR, White JR, Wright A, Chua T. 1999. Influence of phosphorus loading on microbial processes in the soil and water column of wetlands, p 249–273. In Reddy KR, O'Connor GA, Schelske CL (ed), Phosphorus biogeochemistry in subtropical ecosystems. CRC Press, Boca Raton, FL. [Google Scholar]
- 27.Chauhan A, Ogram A, Reddy KR. 2004. Syntrophic-methanogenic associations along a nutrient gradient in the Florida Everglades. Appl Environ Microbiol 70:3475–3484. doi: 10.1128/AEM.70.6.3475-3484.2004. [DOI] [PMC free article] [PubMed] [Google Scholar]
- 28.Zumft WG. 1997. Cell biology and molecular basis of denitrification. Microbiol Mol Biol Rev 61:533–616. [DOI] [PMC free article] [PubMed] [Google Scholar]
- 29.Rotthauwe JH, Witzel KP, Liesack W. 1997. The ammonia monooxygenase structural gene amoA as a functional marker: molecular fine-scale analysis of natural ammonia-oxidizing populations. Appl Environ Microbiol 63:4704–4712. [DOI] [PMC free article] [PubMed] [Google Scholar]
- 30.Mohan SB, Schmid MC, Jetten MSM, Cole JA. 2004. Detection and widespread distribution of the nrfA gene encoding nitrite reduction to ammonia, a short circuit in the biological nitrogen cycle that competes with denitrification. FEMS Microbiol Ecol 49:433–443. doi: 10.1016/j.femsec.2004.04.012. [DOI] [PubMed] [Google Scholar]
- 31.Hardy RWF, Holsten RD, Jackson EK, Burns RC. 1968. The acetylene-ethylene assay for N2 fixation: laboratory and field evaluation. Plant Physiol 43:1185–1207. doi: 10.1104/pp.43.8.1185. [DOI] [PMC free article] [PubMed] [Google Scholar]
- 32.Howarth RW. 1988. Nutrient limitation of net primary production in marine ecosystems. Annu Rev Ecol Syst 19:89–110. doi: 10.1146/annurev.es.19.110188.000513. [DOI] [Google Scholar]
- 33.Elser JJ, Sterner RW, Gorokhova E, Fagan WF, Markow TA, Cotner JB, Harrison JF, Hobbie SE, Odell GM, Weider LW. 2000. Biological stoichiometry from genes to ecosystems. Ecol Lett 3:540–550. doi: 10.1111/j.1461-0248.2000.00185.x. [DOI] [Google Scholar]
- 34.White JR, Reddy KR. 2000. Influence of phosphorus loading on organic nitrogen mineralization of northern Everglades soils. Soil Sci Soc Am J 64:1525–1534. doi: 10.2136/sssaj2000.6441525x. [DOI] [Google Scholar]
- 35.Newman S, Kumpf H, Laing JA, Kennedy WC. 2001. Decomposition responses to phosphorus enrichment in an Everglades (USA) slough. Biogeochemistry 54:229–250. doi: 10.1023/A:1010659016876. [DOI] [Google Scholar]
- 36.Inglett P, Rivera-Monroy V, Wozniak J. 2011. Biogeochemistry of nitrogen across the Everglades landscape. Crit Rev Env Sci Technol 41:187–216. doi: 10.1080/10643389.2010.530933. [DOI] [Google Scholar]
- 37.White JR, Reddy KR. 2003. Nitrification and denitrification rates of Everglades wetland soils along a phosphorous-impacted gradient. J Environ Qual 32:2436–2443. doi: 10.2134/jeq2003.2436. [DOI] [PubMed] [Google Scholar]
- 38.Inglett PW, D'Angelo EM, Reddy KR, McCormick PV, Hagerthey SE. 2009. Periphyton nitrogenase activity as an indicator of wetland eutrophication: spatial patterns and response to phosphorus dosing in a northern Everglades ecosystem. Wetl Ecol Manag 17:131–144. doi: 10.1007/s11273-008-9095-5. [DOI] [Google Scholar]
- 39.Kim H, Ogram A, Bae H-S. 2017. Nitrification, anammox and denitrification along a nutrient gradient in the Florida Everglades. Wetlands 37:391–399. doi: 10.1007/s13157-016-0857-1. [DOI] [Google Scholar]
- 40.Giblin AE, Tobias CR, Song B, Weston N, Banta GT, Rivera-Monroy VH. 2013. The importance of dissimilatory nitrate reduction to ammonium (DNRA) in the nitrogen cycle of coastal ecosystems. Oceanography 26:124–131. doi: 10.5670/oceanog.2013.54. [DOI] [Google Scholar]
- 41.Turk KA, Rees AP, Zehr JP, Pereira N, Swif P, Shelley R, Lohan M, Woodward EM, Gilbert J. 2011. Nitrogen fixation and nitrogenase (nifH) expression in tropical waters of the eastern North Atlantic. ISME J 5:1201–1212. doi: 10.1038/ismej.2010.205. [DOI] [PMC free article] [PubMed] [Google Scholar]
- 42.Halm H, Lam P, Ferdelman TG, Lavik G, Dittmar T, LaRoche J, D'Hondt S, Kuypers MM. 2012. Heterotrophic organisms dominate nitrogen fixation in the South Pacific Gyre. ISME J 6:1238–1249. doi: 10.1038/ismej.2011.182. [DOI] [PMC free article] [PubMed] [Google Scholar]
- 43.Dodsworth JA, Leigh JA. 2006. Regulation of nitrogenase by 2-oxoglutarate-reversible, direct binding of a PII-like nitrogen sensor protein to dinitrogenase. Proc Natl Acad Sci U S A 103:9779–9784. doi: 10.1073/pnas.0602278103. [DOI] [PMC free article] [PubMed] [Google Scholar]
- 44.Fardeau M-L, Peillex JP, Belaich JP. 1987. Energetics of the growth of Methanobacterium thermoautotrophicum and Methanococcus thermolithotrophicus on ammonium chloride and dinitrogen. Arch Microbiol 148:128–131. doi: 10.1007/BF00425360. [DOI] [Google Scholar]
- 45.Nishizawa M, Miyazaki J, Makabe A, Koba K, Takai K. 2014. Physiological and isotopic characteristics of nitrogen fixation by hyperthermophilic methanogens: key insights into nitrogen anabolism of the microbial communities in Archean hydrothermal systems. Geochim Cosmochim Acta 138:117–135. doi: 10.1016/j.gca.2014.04.021. [DOI] [Google Scholar]
- 46.DeMoll E. 1993. Nitrogen and phosphorus metabolism of methanogens, p 473–490. In Ferry JG. (ed) Methanogenesis: ecology, physiology, biochemistry, and genetics. Chapman & Hall, New York, NY. [Google Scholar]
- 47.Vile MA, Wieder RK, Zivkovic T, Scott KD, Vitt DH, Hartsock JA, Iosue CL, Quinn JC, Petix M, Fillingim HM, Popma JMA, Dynarski KA, Jackman TR, Albright CM, Wykoff DD. 2014. N2-fixation by methanotrophs sustains carbon and nitrogen accumulation in pristine peatlands. Biogeochemistry 121:317–328. doi: 10.1007/s10533-014-0019-6. [DOI] [Google Scholar]
- 48.Belay N, Sparling R, Daniels L. 1984. Dinitrogen fixation by a thermophilic methanogenic bacterium. Nature 312:286–288. doi: 10.1038/312286a0. [DOI] [PubMed] [Google Scholar]
- 49.Murray PA, Zinder SH. 1984. Nitrogen fixation by a methanogenic archaebacterium. Nature 312:284–286. doi: 10.1038/312284a0. [DOI] [Google Scholar]
- 50.Herlemann DPR, Labrenz M, Jürgens K, Bertilsson S, Waniek JJ, Andersson AF. 2011. Transitions in bacterial communities along the 2000 km salinity gradient of the Baltic Sea. ISME J 5:1571–1579. doi: 10.1038/ismej.2011.41. [DOI] [PMC free article] [PubMed] [Google Scholar]
- 51.Caporaso JG, Kuczynski J, Stombaugh J, Bittinger K, Bushman FD, Costello EK, Fiere N, Peña AG, Goodrich JK, Gordon JI, Huttley GA, Kelley ST, Knights D, Koenig JE, Ley RE, Lozupone CA, McDonald D, Muegge BD, Pirrung M, Reeder J, Sevinsky JR, Turnbaugh PJ, Walters WA, Widmann J, Yatsunenko T, Zaneveld J, Knight R. 2010. QIIME allows analysis of high-throughput community sequence data. Nat Methods 7:335–336. doi: 10.1038/nmeth.f.303. [DOI] [PMC free article] [PubMed] [Google Scholar]
- 52.Bokulich NA, Subramanian S, Faith JJ, Gevers D, Gordon JI, Knight R, Mills DA, Caporaso JG. 2013. Quality-filtering vastly improves diversity estimates from Illumina amplicon sequencing. Nat Methods 10:57–59. doi: 10.1038/nmeth.2276. [DOI] [PMC free article] [PubMed] [Google Scholar]
- 53.Edgar RC. 2010. Search and clustering orders of magnitude faster than BLAST. Bioinformatics 26:2460–2461. doi: 10.1093/bioinformatics/btq461. [DOI] [PubMed] [Google Scholar]
- 54.McDonald D, Price MN, Goodrich J, Nawrocki EP, DeSantis TZ, Probst A, Andersen GL, Knight R, Hugenholtz P. 2012. An improved Greengenes taxonomy with explicit ranks for ecological and evolutionary analyses of bacteria and archaea. ISME J 6:610–618. doi: 10.1038/ismej.2011.139. [DOI] [PMC free article] [PubMed] [Google Scholar]
- 55.Price MN, Dehal PS, Arkin AP. 2010. FastTree 2—approximately maximum-likelihood trees for large alignments. PLoS One 5:e9490. doi: 10.1371/journal.pone.0009490. [DOI] [PMC free article] [PubMed] [Google Scholar]
- 56.Thompson JD, Gibson TJ, Plewniak F, Jeanmougin F, Higgins DG. 1997. The ClustalX Windows interface: flexible strategies for multiple sequence alignment aided by quality analysis tools. Nucleic Acids Res 25:4876–4882. doi: 10.1093/nar/25.24.4876. [DOI] [PMC free article] [PubMed] [Google Scholar]
- 57.Hall TA. 1999. BioEdit: a user-friendly biological sequence alignment editor and analysis program for Windows 95/98/NT. Nucleic Acids Symp Ser (Oxf) 41:95–98. [Google Scholar]
- 58.Schloss PD, Westcott SL, Ryabin T, Hall JR, Hartmann M, Hollister EB, Lesniewski RA, Oakley BB, Parks DH, Robinson CJ, Sahl JW, Stres B, Thallinger GG, van Horn DJ, Weber CF. 2009. Introducing mothur: open-source, platform-independent, community-supported software for describing and comparing microbial communities. Appl Environ Microbiol 75:7537–7541. doi: 10.1128/AEM.01541-09. [DOI] [PMC free article] [PubMed] [Google Scholar]
- 59.Tamura K, Stecher G, Peterson D, Filipski A, Kumar S. 2013. MEGA6: Molecular Evolutionary Genetics Analysis version 6.0. Mol Biol Evol 30:2725–2729. doi: 10.1093/molbev/mst197. [DOI] [PMC free article] [PubMed] [Google Scholar]
- 60.Hamady M, Lozupone C, Knight R. 2010. Fast UniFrac: facilitating high-throughput phylogenetic analyses of microbial communities including analysis of pyrosequencing and PhyloChip data. ISME J 4:17–27. doi: 10.1038/ismej.2009.97. [DOI] [PMC free article] [PubMed] [Google Scholar]
- 61.Harms G, Layton AC, Dionisi HM, Gregory IR, Garrett VM, Hawkins SA, Robinson KG, Sayler DG. 2003. Real-time PCR quantification of nitrifying bacteria in a municipal wastewater treatment plant. Environ Sci Technol 37:343–351. doi: 10.1021/es0257164. [DOI] [PubMed] [Google Scholar]
- 62.Tourna M, Freitag TE, Nicol GW, Prosser JL. 2008. Growth, activity and temperature response of ammonia-oxidizing archaea and bacteria in soil microcosms. Environ Microbiol 10:1357–1364. doi: 10.1111/j.1462-2920.2007.01563.x. [DOI] [PubMed] [Google Scholar]
- 63.Henry S, Baudoin E, López-Gutiérrez JC, Martin-Laurent F, Brauman A, Philippot L. 2004. Quantification of denitrifying bacteria in soils by nirK gene targeted real-time PCR. J Microbiol Methods 59:327–335. doi: 10.1016/j.mimet.2004.07.002. [DOI] [PubMed] [Google Scholar]
- 64.Throbäck IN, Enwall K, Jarvis A, Hallin S. 2004. Reassessing PCR primers targeting nirS, nirK and nosZ genes for community surveys of denitrifying bacteria with DGGE. FEMS Microbiol Ecol 49:401–417. doi: 10.1016/j.femsec.2004.04.011. [DOI] [PubMed] [Google Scholar]
- 65.Welsh A, Chee-Sanford JC, Connor LM, Löffler FE, Sanford RA. 2014. Refined NrfA phylogeny improves PCR-based nrfA gene detection. Appl Environ Microbiol 80:2110–2119. doi: 10.1128/AEM.03443-13. [DOI] [PMC free article] [PubMed] [Google Scholar]
- 66.Bae H-S, Ogram AV. 2013. Molecular genetic analysis of wetland soils, p 349–372. In DeLaune RD, Reddy KR, Richardson CJ, Megonigal JP (ed), Methods in biogeochemistry of wetlands. SSSA Book Series 10. Soil Science Society of America, Madison, WI. [Google Scholar]
- 67.Kim H, Bae H-S, Reddy KR, Ogram A. 2016. Distributions, abundances and activities of microbes associated with the nitrogen cycle in riparian and stream sediments of a river tributary. Water Res 106:51–61. doi: 10.1016/j.watres.2016.09.048. [DOI] [PubMed] [Google Scholar]
- 68.Chauhan A, Ogram A. 2006. Fatty acid-oxidizing consortia along a nutrient gradient in the Florida Everglades. Appl Environ Microbiol 72:2400–2406. doi: 10.1128/AEM.72.4.2400-2406.2006. [DOI] [PMC free article] [PubMed] [Google Scholar]
- 69.Sanders R. 2015. Compilation of Henry's law constants (version 4.0) for water as solvent. Atmos Chem Phys 15:4399–4981. doi: 10.5194/acp-15-4399-2015. [DOI] [Google Scholar]
- 70.Albert DB, Martens CS. 1997. Determination of low-molecular weight organic acid concentrations in seawater and pore-water samples via HPLC. Mar Chem 56:27–37. doi: 10.1016/S0304-4203(96)00083-7. [DOI] [Google Scholar]
- 71.Inglett PW. 2013. Biological dinitrogen fixation, p 593–602. In DeLaune RD, Reddy KR, Richardson CJ, Megonigal JP (ed), Methods in biogeochemistry of wetlands. SSSA Book Series 10. Soil Science Society of America, Madison, WI. [Google Scholar]
- 72.US Environmental Protection Agency. 1993. Methods for the chemical analysis of water and wastes (MCAWW) (EPA/600/4-79/020). National Exposure Research Laboratory, US Environmental Protection Agency, Washington, DC. [Google Scholar]
- 73.US Environmental Protection Agency. 1983. Nitrogen, ammonia. Method 250.1 (colorimetric), p 350-1.1–350-1.4. In Methods for chemical analysis of water and wastes. EPA-600/4-79-020. US Environmental Protection Agency, Cincinnati, OH. [Google Scholar]
Associated Data
This section collects any data citations, data availability statements, or supplementary materials included in this article.