Abstract
Calorie restriction (CR; reducing calorie intake by ~40% below ad libitum) can increase glucose uptake by insulin-stimulated muscle. Because skeletal muscle is comprised of multiple, heterogeneous fiber types, our primary aim was to determine the effects of CR (initiated at 14 weeks old) and fiber type on insulin-stimulated glucose uptake by single fibers of diverse fiber types in 23–26-month-old rats. Isolated epitrochlearis muscles from AL and CR rats were incubated with [3H]-2-deoxyglucose ± insulin. Glucose uptake and fiber type were determined for single fibers dissected from the muscles. We also determined CR-effects on abundance of several key metabolic proteins in single fibers. CR resulted in: (a) significantly (p < .05 to .001) greater glucose uptake by insulin-stimulated type I, IIA, IIB, IIBX, and IIX fibers; (b) significantly (p < .05 to .001) reduced abundance of several mitochondrial electron transport chain (ETC) and oxidative phosphorylation (OxPhos) proteins in type I, IIA, and IIBX but not IIB and IIX fibers; and (c) unaltered hexokinase II abundance in each fiber type. These results demonstrate that CR can enhance glucose uptake in each fiber type of rat skeletal muscle in the absence of upregulation of the abundance of hexokinase II or key mitochondrial ETC and OxPhos proteins.
Keywords: Glucose transport, Insulin sensitivity, Insulin resistance, Mitochondria, Hexokinase II
The major tissue for whole body insulin-stimulated glucose disposal is skeletal muscle and insulin resistance in this tissue is crucial for the progression of many prevalent age-related pathologies, including metabolic syndrome, type 2 diabetes, and coronary artery disease (1–7). In this context, it would be valuable to identify and understand interventions that effectively oppose skeletal muscle insulin resistance during old age. Whole body insulin sensitivity can be substantially improved by calorie restriction (CR) (reducing calorie intake by ~20%–40% below ad libitum, AL, levels) in mice, rats, nonhuman primates and humans (8–11). This CR-induced outcome is largely attributable to greater insulin-stimulated glucose uptake by skeletal muscle (8,9,12–14).
Mammalian skeletal muscle includes multiple muscle fiber types with extremely diverse metabolic phenotypes (15). Determination of myosin heavy chain isoform (MHC) expression is the gold-standard technique for identifying skeletal muscle fiber type (16). Four MHC isoforms (type I, IIA, IIB, and IIX) are expressed in skeletal muscle of adult rats (17,18). In rat skeletal muscles, ~10%–30% of fibers are hybrid fibers that express multiple MHC isoforms. Given the heterogeneity of muscle, it should not be assumed that CR has a uniform influence on the metabolic phenotype of every fiber type.
The traditional approach for evaluating fiber type differences is to compare two or more muscles or regions of muscles with dissimilar fiber type compositions (13,19–21). Although conventional tissue analysis is useful, it cannot identify fiber type differences in glucose uptake at the cellular level because: (a) skeletal muscle is a heterogenous tissue containing multiple fiber types; (b) muscle fibers are not the only cell type responsible for glucose disposal by skeletal muscle tissue, which also includes vascular, neural, adipose, and other cell types; (c) glucose uptake by hybrid fibers cannot be assessed by conventional tissue analysis; and (d) although type IIX fibers can account for ~20%–45% of many rat muscles (18,22), there is apparently no report of an exemplar muscle in which IIX fibers account for more than 50% of the fibers. These limitations interfere with the full understanding of the cellular mechanisms that regulate muscle metabolism.
To address these limitations, we recently developed and validated the first approach that both quantifies glucose uptake and identifies MHC isoform expression in single rat skeletal muscle fibers (23). The primary aim of the current study was to determine the influence of long-term CR (initiated at 14 weeks old) in older rats (23–26 months old) on insulin-stimulated glucose uptake by single muscle fibers of different fiber types. Basal and insulin-stimulated glucose uptake were measured for slow-twitch (type I) fibers and fast-twitch (type IIA, IIB, IIX, and hybrid IIBX) fibers in which MHC isoform expression was also determined. We also assessed in muscle fibers the CR effects on the abundance of hexokinase II, a crucial enzyme that regulates glucose uptake and metabolism in skeletal muscle.
Under various physiological conditions, the level of muscle insulin sensitivity tracks along with the level of muscle mitochondrial content/capacity, although this association has not been universally observed (24–27). There has also been a substantial amount of published research devoted to the potential influence of CR on skeletal muscle mitochondria (28–34). However, remarkably little is known about the possible relationship between fiber type and CR’s effects on mitochondria. Therefore, a secondary aim of the current study was to determine long-term CR’s effects in older rats on the abundance of several key mitochondrial proteins in muscle fibers of different fiber types.
We previously reported striking fiber type differences in the abundance of cytochrome c oxidase subunit IV in type IIA, IIB, IIBX, and IIX single fibers from 25-month-old rats (35). However, this earlier investigation only evaluated a single mitochondrial protein and did not include slow-twitch type I fibers. Accordingly, the final aim of the current study was to analyze single fibers from older rats to assess possible fiber type differences for multiple mitochondrial proteins and hexokinase II abundance.
Methods
Materials
The reagents and apparatus for Sodium dodecyl sulfate polyacrylamide gel electrophoresis (SDS-PAGE) were from Bio-Rad (Hercules, CA). [3H]-2-deoxyglucose (NET328001MC) was from PerkinElmer (Waltham, MA). Tissue Protein Extraction Reagent, T-PER (PI78510) and SimplyBlue SafeStain (LC6065) were from ThermoFisher (Pittsburgh, PA). Collagenase type 2 (305 U/mg) was from Worthington Biochemical (LS004177, Lakewood, NJ). OXPHOS Rodent WB Antibody Cocktail (#ab110413) and anti-α-actin (#ab28052) were from Abcam (Cambridge, MA). The Total OXPHOS Rodent WB Antibody Cocktail includes antibodies against five mitochondrial proteins involved in the electron transport chain and oxidative phosphorylation: NADH dehydrogenase (ubiquinone) 1β subcomplex subunit 8 (NDUFB8, part of Complex I); succinate dehydrogenase complex subunit 8 (SDHB, part of Complex II); ubiquinol-cytochrome-c reductase complex core protein 2 (UQCRC2, part of Complex III), Cytochrome c oxidase subunit I (MTCO1, part of Complex IV); and mitochondrial membrane ATP synthase (ATP5A, part of Complex V). Anti-hexokinase II (#2867) and anti-rabbit IgG horseradish peroxidase conjugate (#7074) were from Cell Signaling Technology (Danvers, MA). Anti-mouse IgG (#sc-2060) and anti-mouse IgM (#sc-2973) horseradish peroxidase were from Santa Cruz Biotechnology (Santa Cruz, CA).
Animal Treatment
Procedures for animal care were approved by the University of Michigan Committee on Use and Care of Animals. Male Fischer-344 × Brown Norway (FBN) rats (CR and AL controls) were transferred to the University of Michigan animal facility at ~19 months old from National Institute of Aging (NIA) Calorie Restricted Rodent Colony. In the NIA facility, the reduced calorie diet for CR rats was initiated at 14 weeks old (10% restriction at 14 weeks) with 25% restriction at 15 weeks, and 40% restriction at 16 weeks. In the University of Michigan animal facility, animals were maintained on the same diets as in the CR colony (NIH31 chow for AL, and NIH31/NIA fortified chow for CR rats at ~60–65% of AL consumption). Rats were individually housed in shoebox cages and maintained on a 12–12-hour light–dark cycle (lights out at 17:00 h) in specific pathogen-free conditions for ~4–7 months prior to the muscle experiments.
On the experimental days, AL (n = 15) and CR (n = 18) rats were weighed and anesthetized (intraperitoneal sodium pentobarbital, 50 mg/kg weight). Both of their epitrochlearis muscles were removed to be used for single fiber MHC fiber type identification, glucose uptake analysis, and immunoblotting. In addition, epididymal fat pads were removed and weighed.
Muscle Ex Vivo Incubations for Single Fiber Glucose Uptake
Isolated muscles were incubated in glass vials gassed (95% O2 and 5% CO2) in a temperature controlled bath during all of the four-step process (35°C during steps 1, 2, and 4; and step 3 was on ice). For step 1 (30 minutes), one muscle from each rat was placed in a vial containing 2 mL of media 1 (Krebs Henseleit Buffer, KHB, supplemented with 0.1% bovine serum albumin, BSA, 2 mM sodium pyruvate and 6 mM mannitol). The contralateral muscle was incubated with media 1 that was supplemented with 1.8 nM insulin. For step 2 (60 minutes), each muscle was transferred to a vial containing 2 mL of media 2 (KHB supplemented with 0.1% BSA, 0.1 mM 2-DG [13.5 µCi/ml [3H]-2-DG], 2 mM sodium pyruvate and 6 mM mannitol) and the same insulin concentration as the preceding step. For step 3, muscles underwent three washes (5 minutes/wash with shaking at 115 revolutions/min) in ice-cold wash media (Ca2+-free KHB supplemented with 0.1% BSA and 8 mM glucose) to rinse [3H]-2-DG from the extracellular space. For step 4 (60–75 minutes), muscles were incubated in vials containing collagenase media (wash media supplemented with 8 mM glucose and 1.5% type 2 collagenase) for enzymatic digestion of muscle collagen (collagenase-treated muscles are hereafter referred to as fiber bundles).
Isolation, Imaging, and Processing of Single Fibers for Glucose Uptake and MHC Isoform Identification
After incubation step 4, fiber bundles were removed from collagenase media, and transferred to a petri dish containing wash media at room temperature. Under a dissecting microscope (EZ4D; Leica, Buffalo Grove, IL), intact single fibers (~36 fibers per muscle) were gently teased from the fiber bundle using Dumont forceps (Roboz; Gaithersburg, MD). After isolation, each fiber was imaged using a camera-enabled microscope with Leica Application Suite EZ software. The original single fiber method assessed the fiber images using Image J software (National Institutes of Health) to estimate fiber volume on the basis of fiber length and width (23). We recently compared the original fiber volume method to the calculation of fiber area based on measuring fiber perimeter using Image J software and found that when two experienced researchers independently analyzed the same set of fiber images, there was greater reproducibility for fiber area compared to fiber volume (36). Accordingly, 2-[3H]-DG accumulation was expressed in this experiment based on fiber area (picomoles × mm−2). After being imaged, each fiber was transferred using a pipette with 20 μl of wash media into a SnapStrip II PCR tube (Research Products International; Mount Prospect, IL). Lysis buffer (30 μl; T-PER supplemented with 1% Triton X-100, 1 mM Na3VO4, 1 mM EDTA, 1 mM EGTA, 2.5 mM sodium pyrophosphate tetrabasic decahydrate, 1 mM β-glycerophosphate, 1 μg/ml leupeptin, and 1 mM phenylmethylsulfonyl fluoride) and 2× Laemmli buffer (50 μl) were pipetted into each tube. Tubes were next vortexed and heated (10 minutes at 95–100°C) before being cooled and stored at −20°C until subsequent analyses were performed.
Single Fiber Glucose Uptake
An aliquot of each lysed single fiber and an aliquot of scintillation cocktail were pipetted into a scintillation vial and subjected to liquid scintillation counting. The 2-[3H]-DG disintegrations per minute (dpm) determined from each fiber and the dpm from the 2-[3H]-DG in the media (dpm per picomole) were then used to calculate 2-[3H]-DG accumulation and expressed relative to fiber area (picomoles × mm−2). Delta (∆) insulin 2-DG uptake was calculated by subtracting the mean value without insulin from the mean value with insulin for fibers of the same fiber type from each rat.
MHC Isoform Identification
MHC isoforms in aliquots from the lysates of each fiber were separated and identified by SDS-PAGE essentially as previously described (37). MHC isoform expression was identified by comparing the migration of MHC protein band(s) from the fiber with a MHC isoform standard (6 μg protein of a 3:2 mixture of homogenized rat extensor digitorum longus [EDL] and soleus muscles, E+S) that contained all four MHC isoforms (I, IIA, IIB, and IIX).
Immunoblotting
Aliquots of single fiber lysates were separated by SDS-PAGE using 4%–20% TGX gradient gels (#456–1096: Bio-Rad, Hercules, CA) or 10% gels and then transferred to polyvinyl difluoride membranes. In addition to the experimental samples, each gel included a standard curve that was prepared by loading increasing amounts of a pooled standard of muscle fibers. After transfer, the membranes were blocked with 3% BSA in TBST (Tris-buffered saline, pH 7.5 plus 0.1% Tween-20) for 30 minutes at room temperature, then incubated with primary antibody in TBST with 3% BSA overnight at 4°C. Next, membranes were washed 3 × 5 minutes with TBST before being incubated with appropriate secondary antibody for 3 hours at room temperature. Membranes were then washed 3 × 5 minutes with TBST, followed by washing 3 × 5 minutes with TBS. Proteins were detected using enhanced chemiluminescence (Luminata Forte Western HRP Substrate; #WBLUF0100; Millipore) and quantified by densitometry (FluoroChem E Imager, AlphaView software; ProteinSimple, San Leandro, CA). The loading control was α-actin. Values for abundance of immunodetected proteins for single fibers were calculated based on linear regression from the standard curve that was included on each immunoblot and the calculated value for each sample was expressed relative to the sample’s loading control (α-actin). The single fiber lysates from the AL and CR rats were heated to 95–100°C (10 minutes). We determined if heating samples altered the immunoblotting results by comparing replicate aliquots of another set of single fiber lysates that had been incubated at room temperature, 50°C or 95–100°C prior to loading on the gel. Only MTCO1 values were reduced after incubation at 95–100°C, with no effect of temperature on ATP5A, UQCR2, SDHB, NDUF88, or hexokinase II. Accordingly, the MTCO1 data from AL and CR samples were not included in the results.
Statistics
Statistical analysis was performed using SigmaPlot (San Rafael, CA) version 12.5. For each rat, the mean value for 2-DG uptake or protein abundance was determined for all of the single fibers that had the same fiber type (ie, type I, IIA, IIB, IIBX, or IIX), and this mean value was used for statistical analyses (ie, n values represent the number of rats, not the number of individual fibers). A two tailed t test was used to compare AL versus CR for protein abundance of the same fiber type, ∆ insulin 2-DG uptake, body mass, epididymal fat pad mass, and fat pad/body mass ratio. If transformation failed to normalize the data, a Mann–Whitney Rank Sum test was used to compare two groups. The 2-DG uptake data were analyzed using two-way repeated measures Analysis of Variance (ANOVA). One-way ANOVA was used to assess fiber type differences in protein abundance in the AL rats. The Fisher LSD test was used for post hoc analysis to identify the source of significant variance for two-way and one-way ANOVA. Mathematical transformations were performed when the data failed tests for normality or equal variance. Data were expressed as means ± SEM. A p value ≤0.05 was considered statistically significant.
Results
As expected, the CR rats compared to AL rats had significantly (p < .001) lower values for body mass (AL = 562.8 ± 12.8 g; CR = 339.9 ± 1.8 g), epididymal fat pad mass (AL = 12.31 ± 0.49 g; CR = 5.55 ± 0.21 g), and fat pad/body mass ratio (AL = 0.0219 ± 0.0007; CR = 0.0163 ± 0.0006). MHC isoforms were identified for each fiber. Approximately 36 fibers were isolated from each muscle. In the AL group, the numbers of fibers for each fiber type (no insulin/insulin) used for both MHC isoform and glucose uptake determination were: type I (13/16), IIA (41/22), IIB (298/360), IIBX (89/62), and IIX (78/76). In the CR group, the numbers of fibers for each fiber type were: type I (21/33), IIA (33/46), IIB (428/431), IIBX (55/72), and IIX (93/80).
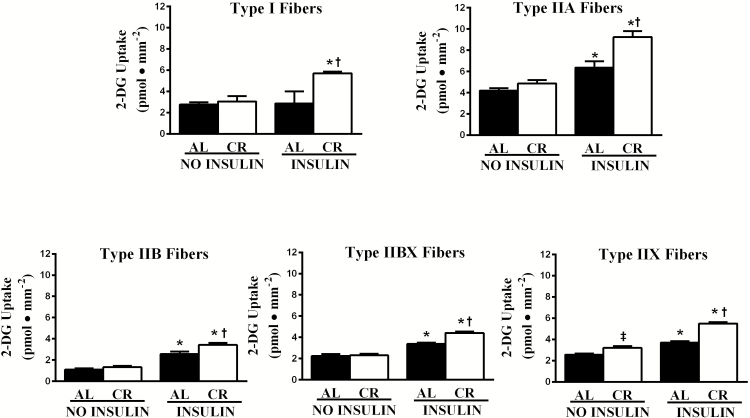
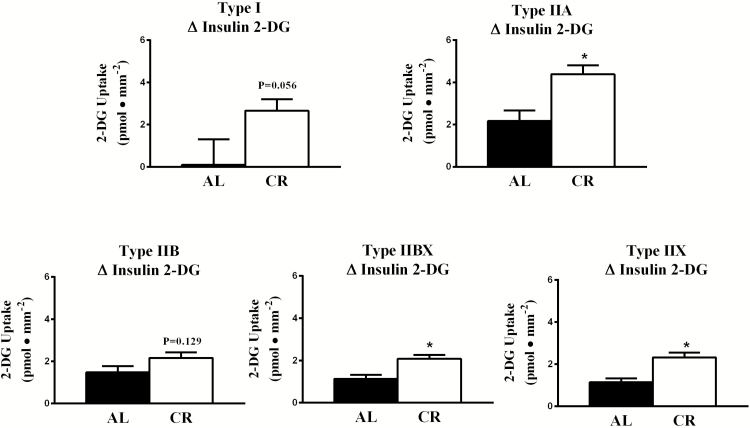
For 2-DG uptake, there was a significant main effect of insulin (insulin > no insulin) in each fiber type (I, p < .05; IIA, p < .001; IIB, p < .001; IIBX, p < .001; IIX, p < .001; Figure 1). There was also a significant main effect of diet (CR > AL) for 2-DG uptake in each fiber type (I, p < .05; IIA, p < .05; IIB, p < .01; IIBX, p < .05; IIX, p < .001). In addition, there was a significant Insulin × Diet interaction for 2-DG uptake of type IIA (p < .05), IIBX (p < .001), and IIX (p < .001) fibers, and a trend for an insulin x diet interaction in type I fibers (p = .056). Post hoc analysis indicated that 2-DG uptake with insulin significantly (p < .001) exceeded values with no insulin for type IIA, IIB, IIBX, and IIX fibers in each diet group. For type I fibers, post hoc analysis detected a significantly (p < .01) greater 2-DG uptake with insulin versus no insulin of CR but not AL rats. The 2-DG uptake for insulin-stimulated fibers from CR rats significantly exceeded values for AL rats in each fiber type: I (p < .01), IIA (p < .01), IIB (p < .01), IIBX (p < .001), and IIX (p < .001). Only for type IIX fibers from muscles incubated without insulin, CR values significantly (p < .01) exceeded AL values. The ∆ insulin 2-DG uptake value for CR rats significantly (p < .01) exceeded AL values for type IIA, IIBX, and IIX fibers (Figure 2) and there was a non-significant trend for CR values to exceed AL values for type I (p = .056) and IIB (p = .129) fibers.
Figure 1.
Effects of insulin and diet on glucose uptake in different fiber types. In each fiber type, there was a significant main effect of insulin (I, p < .05; IIA, p < .001; IIB, p < .001; IIBX, p < .001; IIX, p < .001) and a significant main effect of diet (I, p < .05; IIA, p < .05; IIB, p < .01; IIBX, p < .05; IIX, p < .001). There was a significant Insulin × Diet interaction for type IIA (p < .05), IIBX (p < .001), and IIX (p < .001) fibers and a trend for an Insulin × Diet interaction in type I fibers (p = .056). *Fisher LSD post hoc analysis revealed that insulin-stimulated values significantly (p < .001) exceeded the values without insulin in type IIA, IIB, IIBX, and IIX fibers regardless of diet, and for type I, insulin-stimulated values exceed values without insulin only for the CR group (p < .01). †Post hoc analysis indicated that insulin-stimulated values were greater for CR versus AL in type I (p < .01), IIA (p < .01), IIB (p < .01), IIBX (p < .001), and IIX (p < .001) fibers. ‡Post hoc analysis indicated that in IIX fibers without insulin, values were greater for CR versus AL (p < .01). Values are means ± SEM. AL = Ad libitum; CR = Calorie restriction.
Figure 2.
Effects of diet on ∆ insulin 2-DG uptake in different fiber types. *CR significantly (p < .01) exceeded AL values in type IIA, IBX, and IIX fibers and CR tended to exceed AL values in type I (p = .056) and IIB (p = .129) fibers. Values are means ± SEM. AL = Ad libitum; CR = Calorie restriction.
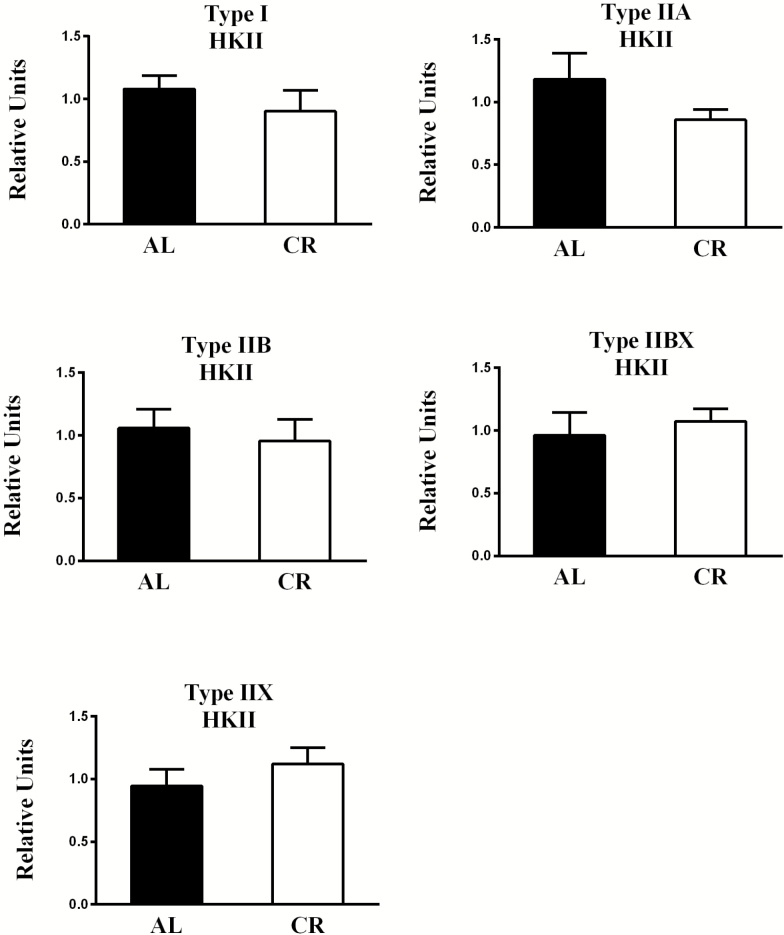
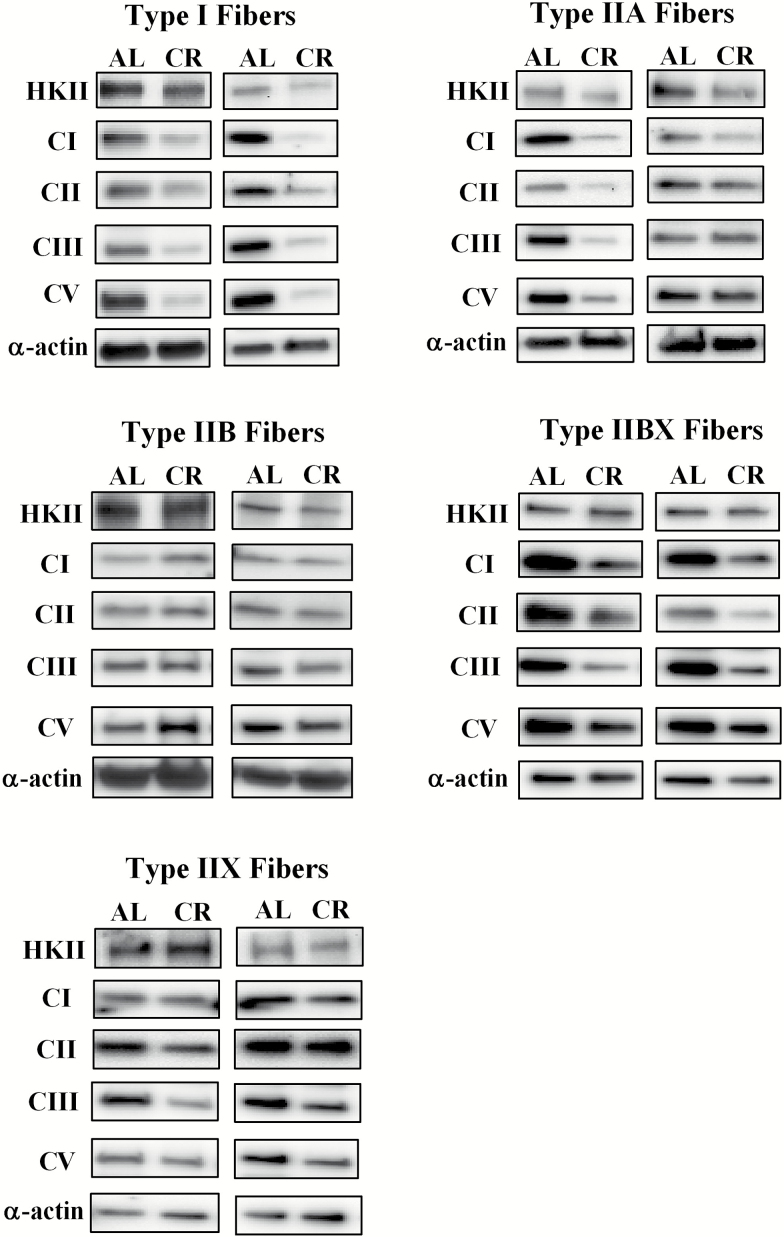
There was no significant diet-related difference in hexokinase II abundance for any of the fiber types (Figures 3 and 8). Regarding fiber type effects in AL rats, there were no significant differences for hexokinase II abundance (Supplementary Figure 1).
Figure 3.
Effect of diet on hexokinase II (HKII) abundance. There were no significant diet-related differences in HKII abundance for any fiber type. Values are means ± SEM. AL = Ad libitum; CR = Calorie restriction.
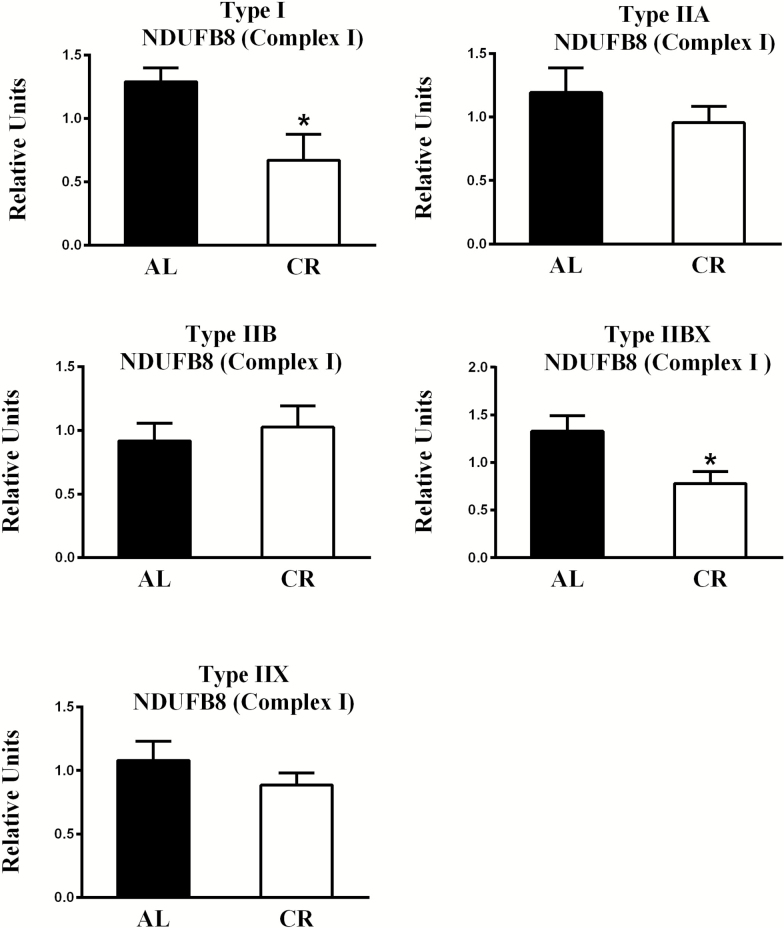
Regarding diet-effects, the AL values significantly exceeded CR values for NDUFB8 abundance in type I (p < .05) and IIBX (p < .05) fibers (Figures 4 and 8). With respect to fiber type effects in AL rats, NDUFB8 abundance was significantly greater for type IIA (p < .01), IIBX (p < .05), and IIX (p < .05) fibers compared to type IIB fibers (Supplementary Figure 2).
Figure 4.
Effect of diet on NDUFB8 (part of Complex I) abundance. *AL values exceeded CR values for type I (p < .05) and IIBX (p < .05) fibers. Values are means ± SEM. AL = Ad libitum; CR = Calorie restriction.
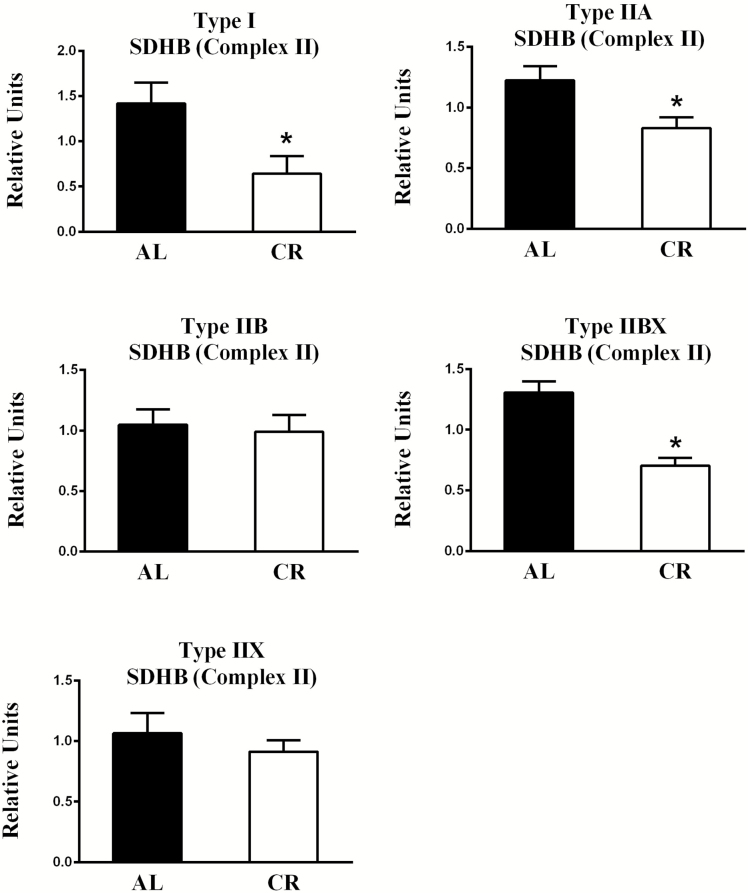
Related to diet-effects, the AL values significantly exceeded CR values for SDHB abundance in type I (p < .05), IIA (p < .05), and IIBX (p < .001) fibers (Figures 5 and 8). Concerning fiber type effects in AL rats, there were no significant fiber type effects on SDHB abundance (Supplementary Figure 3).
Figure 5.
Effect of diet on succinate dehydrogenase complex subunit 8 (part of Complex II) abundance. *AL values exceeded CR values for type I (p < .05), IIA (p < .05), and IIBX (p < .001) fibers. Values are means ± SEM. AL = Ad libitum; CR = Calorie restriction.
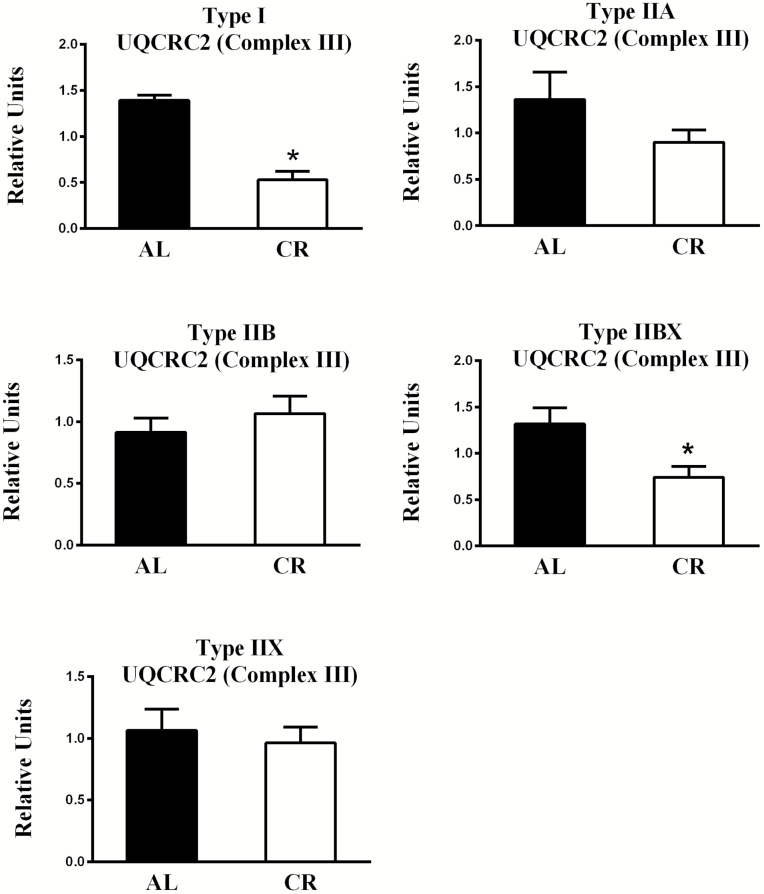
With respect to diet-effects, the AL values significantly exceeded CR values for UQCRC2 abundance in type I (p < .001) and IIBX (p < .05) fibers, and AL values tended (p = .18) to be greater than CR values for IIA fibers (Figures 6 and 8). Pertaining to fiber type effects in AL rats, UQCRC2 abundance was significantly greater for type I (p < .05), IIA (p < .01), and IIX (p < .01) fibers compared to type IIB fibers (Supplementary Figure 4).
Figure 6.
Effect of diet on UQCRC2 (part of Complex III) abundance. *AL values exceeded CR values for type I (p < .001) and IIBX (p < .05) fibers. Values are means ± SEM. AL = Ad libitum; CR = Calorie restriction.
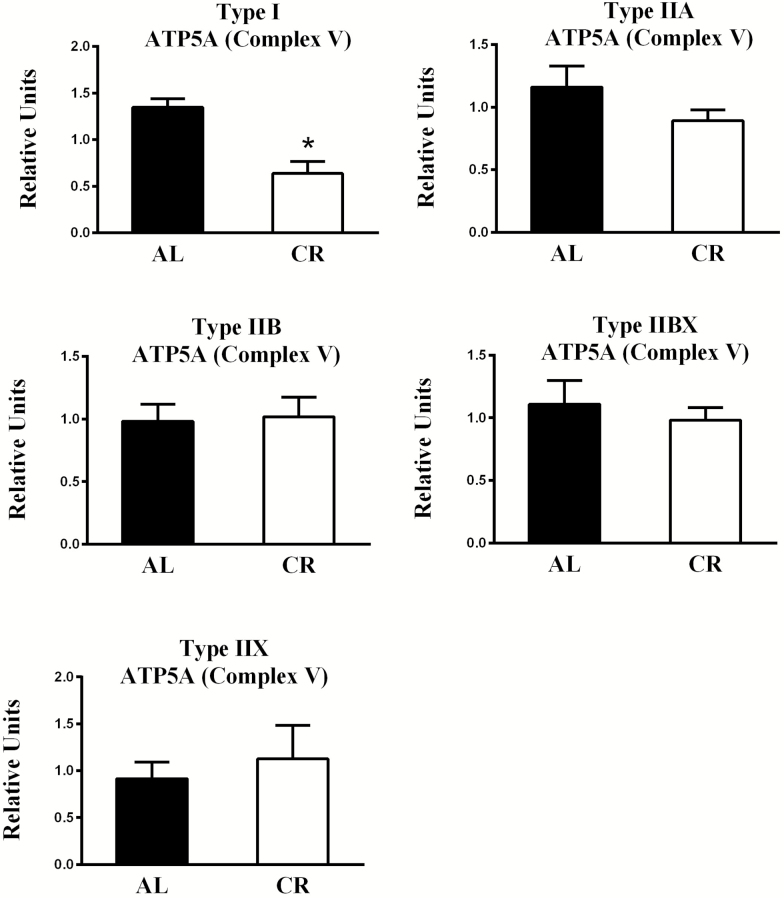
Pertaining to diet-effects, the AL values significantly exceeded CR values for ATP5A abundance in type I fibers (p < .01; Figures 7 and 8). Concerning fiber type effects in AL rats, ATP5A abundance was significantly greater for type I (p < .01), IIA (p < .01), and IIX (p < .05) compared to type IIB fibers (Supplementary Figure 5).
Figure 7.
Effect of diet on ATP5A (part of Complex V) abundance. *AL values exceeded CR values for type I (p < .01) fibers. Values are means ± SEM. AL = Ad libitum; CR = Calorie restriction.
Figure 8.
Representative immunoblots for each of the proteins in Figures 2–7. The loading control was α-actin. AL = Ad libitum; CR = Calorie restriction.
Discussion
The analysis of single muscle fibers together with identification of MHC isoform expression enabled novel insights at the cellular level that would have been impossible using conventional tissue analysis. The most important new findings include that long-term CR by older (23–26 months old) rats resulted in: (a) greater 2-DG uptake by insulin-stimulated type I, IIA, IIB, IIBX, and IIX fibers; (b) greater delta insulin 2-DG values calculated in type IIA, IIBX and IIX fibers and a trend for greater values in type I and IIB fibers; (c) reduced abundance of multiple mitochondrial proteins in type I (NDFUB8, SDHB, UQCRC2, and ATP5A), IIA (SDHB), and IIBX (NDFUB8, SDHB, and UQCRC2) but not IIB and IIX fibers; and (d) unaltered hexokinase II abundance for each fiber type. In addition, the current study revealed new information at the single fiber level about fiber type differences in skeletal muscle from older rats, including that: (a) the abundance of several mitochondrial proteins was greater for type IIA compared to type IIB fibers (NDFUB8, UQCRC2, and ATP5A); (b) type I fibers exceeded IIB fibers for UQCRC2 and ATP5A abundance; (c) type IIX fibers exceeded IIB fibers for NDUFB8, UQCRC2, and ATP5A abundance; and (d) type IIBX fibers exceeded IIB fibers for NDFU88.
Single fiber analysis provides unique information, but it is also essential to put single fiber results into the context of earlier research that assessed long-term CR’s effects on insulin-stimulated glucose uptake by muscle tissue with different fiber type profiles. Using a euglycemic-hyperinsulinemic clamp in 24-month-old Wistar rats with submaximally effective plasma insulin levels (1.5–2.1 nM), Escriva and colleagues (38) found that CR resulted in elevated whole body glucose disposal rate and glucose uptake by the soleus (predominantly type I (22)) and quadriceps (predominantly type IIB (39)) muscles. In 22–30-month-old FBN rats, insulin-stimulated (0.6–1.2 nM) glucose uptake by isolated epitrochlearis (predominantly type IIB and IIX (35)) and soleus muscles (predominantly type I (22)) was greater for CR versus AL controls (40–42). Thus, earlier research demonstrated that that CR could elevate in vivo insulin-stimulated glucose uptake in muscles with differing fiber type profiles in older rats, and a CR-induced increase was also observed in ex vivo muscle tissue preparations, indicating CR effects were, at least in part, inherent to the muscle itself. However, these results do not eliminate the possible added roles of systemic regulating elements (eg, muscle blood flow, endocrine factors, circulating metabolites, etc.) for CR effects on glucose disposal by muscle. The earlier research in isolated soleus muscles suggested that type I fibers are susceptible for the inherent muscle adaptations to CR, but they could not discern the possible CR effects on glucose uptake by type IIA, IIB, IIX, or IIBX fibers. Therefore, it was important that the current results clearly demonstrated a CR-induced improvement in glucose uptake by insulin-stimulated type I, IIA, IIB, IIBX, and IIX fibers. The ability of CR to enhance glucose uptake in each of these fiber types in the rat epitrochlearis does not establish that the same effect will be found in all fiber types in all muscles. However, the current results provide the proof-of-concept that CR can elevate glucose uptake across fiber types from insulin-stimulated rat skeletal muscles.
A substantial amount of research has aimed to identify mechanisms for the benefits of CR on insulin sensitivity in muscle tissue. Although many studies have indicated that CR can elevate insulin sensitivity without increasing the total abundance of GLUT4 transporter protein in skeletal muscle (40–43), the CR-related increase in insulin-stimulated glucose uptake in rat epitrochlearis muscle is accompanied by greater GLUT4 translocation to cell surface membranes (44). It would be valuable for future research to determine the influence of CR on GLUT4 abundance and GLUT4 translocation in skeletal muscle at the single fiber level.
After glucose transport into the cell, glucose phosphorylation by hexokinase II is the next key step for muscle glucose metabolism. However, the lack of a significant effect of CR on hexokinase II abundance for any of the fiber types indicates that enhanced hexokinase II expression does not explain for the CR-related improvement in insulin-stimulated glucose uptake. Although hexokinase II protein abundance is a crucial determinant of its functional capacity, it remains possible that its enzyme activity or subcellular localization is responsive to CR effects.
We previously demonstrated that insulin-stimulated glucose uptake was not significantly different for single fibers from 9-month-old versus 25-month-old FBN rats (35). In the earlier study, we used a maximally effective insulin dose (12 nM), whereas the current study used a submaximally effective insulin dose (1.8 nM). This difference is notable because another earlier study using whole epitrochlearis muscles from 23-month-old rats found that CR caused greater glucose uptake with the submaximally effective insulin dose but not the maximally effective insulin dose (43). Furthermore, the previous study included type IIA, IIB, IIBX, and IIX fibers, but not type I fibers (35). We previously found in epitrochlearis muscle tissue from 9-month-old versus 25-month-old FBN rats no significant difference in glucose uptake (with 1.2 or 30 nM insulin). However, in the soleus muscle tissue (~90% type I) from the same rats, we found glucose uptake was lower for the older group with 30 nM insulin and tended (p = .07) to be lower with 1.2 nM insulin. Thus, it is uncertain if age-related insulin resistance occurs in type I epitrochlearis fibers from 9-month-old versus 25-month-old FBN rats.
Recent reviews have summarized and interpreted the research evaluating CR’s influence on multiple aspects of mitochondrial structure and function (28,29). Some of the CR-related outcomes have been consistently described in multiple studies, eg, reduced mitochondrial reactive oxygen species (28). However, there have also been discrepancies, some of which are likely related to the differences in experimental design and methods, including differences in the age of subjects, species, tissues, dietary protocol (dietary composition, age of onset, duration, and extent of CR), and specific techniques used to assess mitochondrial structure and function. The current investigation provided new information about CR effects on mitochondria because it focused on the abundance of several key proteins involved in the electron transport chain and oxidative phosphorylation in single fibers that were also characterized for MHC isoform expression.
The current results for mitochondrial proteins should also be interpreted in the context of earlier studies that included similar measurements in muscle tissue from CR and AL animals. Hancock and colleagues (30) reported that in ~4-month-old Wistar rats, there was no significant CR-effect on the abundance of several mitochondrial proteins (long chain acyl CoA dehydrogenase, citrate synthase, NADH ubiquinone oxidoreductase, cytochrome c, cytochrome oxidase I, cytochrome oxidase IV, and ATP synthase subunit α) in the predominantly type IIB triceps muscle. Similarly, Lanza and colleagues (31) found in the quadriceps muscles (in which type IIB fibers are abundant) of 24-month-old CR mice, there was no significant CR-effect on abundance of several mitochondrial proteins (NDUFB8, SDHB, UQCRC2, MTCO1, and ATP5A). These results in skeletal muscle tissue enriched with type IIB fibers are similar to the lack of a significant CR-effect on NDUFB8, SDHB, UQCRC2, and ATP5A in the type IIB fibers in the current study.
Although the results for type IIB fibers appear consistent with earlier results for muscles with a large amount of type IIB fibers, only a few studies have probed possible fiber type differences in CR effects on muscle mitochondria. In tissue samples from several skeletal muscles with differing fiber type profiles (red gastrocnemius, white gastrocnemius, mixed gastrocnemius, soleus, or plantaris), neither complex IV activity nor citrate synthase activity differed between 35-month-old AL versus age-matched CR FBN rats (45). Based on electron microscopic analysis of mitochondrial morphometry of single fibers from mouse tibialis anterior (TA) and extensor digitorum longus (EDL) muscles, Finley and colleagues reported a nonuniform CR-effect on mitochondria localized in white versus red muscle fibers (32). They found a significant CR-induced reduction in mitochondrial number, but unaltered mitochondrial size in white fibers. Conversely, in red fibers they found that CR did not alter mitochondrial number but resulted in greater mitochondrial size. The current study provided additional evidence that CR has fiber type-selective changes on mitochondria. Muscles from CR compared to AL rats had significantly lower abundance of several mitochondrial proteins in type I, IIA, and IIBX fibers, with no diet-effect in IIB and IIX fibers. The results of Finley et al (32) indicated that CR led to greater mitochondrial density in red fibers from mouse EDL and TA, which may have been type I and/or IIA fibers (they did not specify the method for differentiating between red and white fibers, and MHC isoform expression was not reported), whereas the current results indicated reduced abundance of mitochondrial proteins in rat epitrochlearis fibers identified as type I and IIA based on MHC expression. The many differences between the current research and the investigation by Finley et al. (32) (species and age of animals, duration of CR, muscles studied, specific mitochondrial parameters assessed, method for classifying fibers, etc.) confound a simple and direct comparison between the two studies. However, a notable similarity between the studies was that CR did not uniformly alter mitochondrial characteristics in all muscle fibers.
A number of earlier studies have found that various conditions associated with a high level of markers of skeletal muscle mitochondrial content or function are also characterized by a high level of muscle insulin sensitivity (eg, individuals after chronic exercise training) and vice-versa (eg, individuals who are obese and/or have type 2 diabetes) (26,33). However, this relationship is not universally observed, and when observed, the relationship does not establish causality. Previous studies have documented that CR leading to improved insulin sensitivity in humans was not accompanied by greater mitochondrial content in muscle measured by electron microscopy or activity of mitochondrial enzymes (33,34). In a recent review, Gouspillou and Hepple (28) noted that although some studies have suggested that CR might increase mitochondrial biogenesis, the results of many other studies do not support this idea. Importantly, Miller and colleagues (46) found that there was no effect of CR on mitochondrial protein synthesis in rat skeletal muscle. The current study did not directly assess mitochondrial content or function but the significant increase in glucose uptake by fibers from insulin-stimulated muscle across fiber types was not accompanied by any evidence of greater abundance of key mitochondrial proteins that would be expected to be relevant for mitochondrial oxidative capacity. These data do not support the idea that the CR-induced improvement in insulin sensitivity is closely linked upregulation of mitochondrial protein content.
We previously noted that for the epitrochlearis muscle of 25-month-old male FBN rats, the fiber type hierarchy for cytochrome c oxidase subunit IV abundance was IIA > IIX > IIBX ≈ IIB fibers (35). Based on the immunohistochemical analysis, Gouspillou and colleagues (47) observed that the fiber type hierarchy for SDH content among fibers from the plantaris muscle of 8–10-month-old male FBN rats was IIA > I > IIX > IIB fibers. The results for the four mitochondrial proteins analyzed in this study were generally similar to the results of these previous investigations (high abundance in IIA, intermediate to high abundance in I and IIX, and low abundance in IIB), although no significant differences were detected between type I and IIA fibers in this study.
How do the specific results of this study inform the greater understanding of CR-related effects on muscle metabolism? CR presents a major systemic challenge to the entire organism and it causes a myriad of striking adaptations in multiple organs and tissues. It seems likely that the initial events that trigger the CR-induced adaptations in skeletal muscle originated outside of the myocyte. Various approaches have been previously used to elucidate the nature of the extracellular factors that initiate CR’s effects on various cell types, including the incubation of cultured cells with sera from CR or AL animals or incubation of isolated muscles with concentrations of glucose and/or insulin that approximate CR or AL levels (48,49). In addition to the putative roles of systemic and extracellular regulatory factors, it also seems reasonable to expect that the susceptibility to the CR-induced adaptations is influenced by the particular properties of individual cells and cell types. For example, much attention has focused on elucidating the roles of nutrient-sensing in both aging and CR (50). Rather than probing the specific extracellular or intracellular regulators of CR’s effects, the current study assessed the effects of CR on selective fiber types. The results demonstrated that complexity of CR effects, even when evaluating a single skeletal muscle. CR caused significant reductions in the abundance of several mitochondrial proteins in some, but not all fiber types. In contrast, in the same muscles, hexokinase II abundance was unaffected by CR regardless of fiber type, and CR resulted in greater glucose uptake by insulin-stimulated fibers of each fiber type. The lack of a uniform CR effect on all outcomes in every fiber type is not surprising given the magnitude of phenotypic heterogeneity among the different fiber types. Because the fiber type composition can vary markedly among individuals in some species, including humans, this heterogeneity may influence the individual variability in some of the metabolic consequences of CR.
In conclusion, the results provided the proof-of-concept that CR can enhance glucose uptake in each fiber type of skeletal muscle from old rats. In addition, the results offered compelling evidence at the myocellular level that CR-induced improvements in glucose uptake by insulin-stimulated muscles were not attributable to enhanced hexokinase II abundance. Furthermore, the data argue against the idea that CR’s enhancement of muscle insulin sensitivity is closely linked to upregulation of key mitochondrial proteins for oxidative metabolism.
Supplementary Material
Supplementary data are available at The Journals of Gerontology, Series A: Biological Sciences and Medical Sciences online.
Funding
This work was supported by a grant from the National Institute on Aging at the National Institutes of Health (grant number AG10026) to G.D.C.
Conflicts of Interest
No conflicts of interest, financial or otherwise, are declared by the authors.
Supplementary Material
Acknowledgments
The authors thank Mark W. Pataky, Yilin Nie, and Kallisse R. Dent for their excellent technical assistance. Anthony R.P. Verkerke is currently at East Carolina University.
References
- 1. DeFronzo RA, Jacot E, Jequier E, Maeder E, Wahren J, Felber JP. The effect of insulin on the disposal of intravenous glucose. Results from indirect calorimetry and hepatic and femoral venous catheterization. Diabetes. 1981;30:1000–1007. [DOI] [PubMed] [Google Scholar]
- 2. Samuel VT, Petersen KF, Shulman GI. Lipid-induced insulin resistance: unravelling the mechanism. Lancet. 2010;375:2267–2277. doi:S0140-6736(10)60408-4 [pii]10.1016/S0140-6736(10)60408-4 [DOI] [PMC free article] [PubMed] [Google Scholar]
- 3. Karlsson HK, Zierath JR. Insulin signaling and glucose transport in insulin resistant human skeletal muscle. Cell Biochem Biophys. 2007;48:103–113. [DOI] [PubMed] [Google Scholar]
- 4. Facchini FS, Hua N, Abbasi F, Reaven GM. Insulin resistance as a predictor of age-related diseases. J Clin Endocrinol Metab. 2001;86:3574–3578. [DOI] [PubMed] [Google Scholar]
- 5. Haffner SM. Epidemiology of insulin resistance and its relation to coronary artery disease. Am J Cardiol. 1999;84:11J–14J. [DOI] [PubMed] [Google Scholar]
- 6. Cartee GD, Hepple RT, Bamman MM, Zierath JR. Exercise Promotes Healthy Aging of Skeletal Muscle. Cell Metab. 2016;23:1034–1047. doi:10.1016/j.cmet.2016.05.007 [DOI] [PMC free article] [PubMed] [Google Scholar]
- 7. Abdul-Ghani MA, DeFronzo RA. Pathogenesis of insulin resistance in skeletal muscle. J Biomed Biotechnol. 2010;2010:476279. doi:10.1155/2010/476279 [DOI] [PMC free article] [PubMed] [Google Scholar]
- 8. Petersen KF, Dufour S, Morino K, Yoo PS, Cline GW, Shulman GI. Reversal of muscle insulin resistance by weight reduction in young, lean, insulin-resistant offspring of parents with type 2 diabetes. Proc Natl Acad Sci USA. 2012;109:8236–8240. doi: 10.1073/pnas.1205675109 [DOI] [PMC free article] [PubMed] [Google Scholar]
- 9. Schenk S, McCurdy CE, Philp A et al. Sirt1 enhances skeletal muscle insulin sensitivity in mice during caloric restriction. J Clin Invest. 2011;121:4281–4288. doi:10.1172/JCI58554 [DOI] [PMC free article] [PubMed] [Google Scholar]
- 10. Sharma N, Castorena CM, Cartee GD. Tissue-specific responses of IGF-1/insulin and mTOR signaling in calorie restricted rats. PLoS One. 2012;7:e38835. doi:10.1371/journal.pone.0038835 [DOI] [PMC free article] [PubMed] [Google Scholar]
- 11. Wang ZQ, Floyd ZE, Qin J et al. Modulation of skeletal muscle insulin signaling with chronic caloric restriction in cynomolgus monkeys. Diabetes. 2009;58:1488–1498. doi: 10.2337/db08-0977 [DOI] [PMC free article] [PubMed] [Google Scholar]
- 12. McCurdy CE, Cartee GD. Akt2 is essential for the full effect of calorie restriction on insulin-stimulated glucose uptake in skeletal muscle. Diabetes. 2005;54:1349–1356. [DOI] [PubMed] [Google Scholar]
- 13. Sharma N, Arias EB, Bhat AD et al. Mechanisms for increased insulin-stimulated Akt phosphorylation and glucose uptake in fast- and slow-twitch skeletal muscles of calorie-restricted rats. Am J Physiol Endocrinol Metab. 2011;300:E966–E978. doi:10.1152/ajpendo.00659.2010 [DOI] [PMC free article] [PubMed] [Google Scholar]
- 14. Sharma N, Arias EB, Sequea DA, Cartee GD. Preventing the calorie restriction-induced increase in insulin-stimulated Akt2 phosphorylation eliminates calorie restriction’s effect on glucose uptake in skeletal muscle. Biochim Biophys Acta. 2012;1822:1735–1740. doi:10.1016/j.bbadis.2012.07.012 [DOI] [PMC free article] [PubMed] [Google Scholar]
- 15. Zierath JR, Hawley JA. Skeletal muscle fiber type: influence on contractile and metabolic properties. PLoS Biol. 2004;2:e348. doi:10.1371/journal.pbio.0020348 [DOI] [PMC free article] [PubMed] [Google Scholar]
- 16. Pandorf CE, Caiozzo VJ, Haddad F, Baldwin KM. A rationale for SDS-PAGE of MHC isoforms as a gold standard for determining contractile phenotype. J Appl Physiol (1985). 2010;108:222; author reply 226. doi:10.1152/japplphysiol.01233.2009 [DOI] [PubMed] [Google Scholar]
- 17. Hämäläinen N, Pette D. Patterns of myosin isoforms in mammalian skeletal muscle fibres. Microsc Res Tech. 1995;30:381–389. doi:10.1002/jemt.1070300505 [DOI] [PubMed] [Google Scholar]
- 18. Bloemberg D, Quadrilatero J. Rapid determination of myosin heavy chain expression in rat, mouse, and human skeletal muscle using multicolor immunofluorescence analysis. PLoS One. 2012;7:e35273. doi:10.1371/journal.pone.0035273 [DOI] [PMC free article] [PubMed] [Google Scholar]
- 19. Henriksen EJ, Bourey RE, Rodnick KJ, Koranyi L, Permutt MA, Holloszy JO. Glucose transporter protein content and glucose transport capacity in rat skeletal muscles. Am J Physiol. 1990;259:E593–E598. [DOI] [PubMed] [Google Scholar]
- 20. Sharma N, Arias EB, Sajan MP et al. Insulin resistance for glucose uptake and Akt2 phosphorylation in the soleus, but not epitrochlearis, muscles of old vs. adult rats. J Appl Physiol (1985). 2010;108:1631–1640. doi:japplphysiol.01412.2009 [pii]10.1152/japplphysiol.01412.2009 [DOI] [PMC free article] [PubMed] [Google Scholar]
- 21. Holloszy JO, Chen M, Cartee GD, Young JC. Skeletal muscle atrophy in old rats: differential changes in the three fiber types. Mech Ageing Dev. 1991;60:199–213. [DOI] [PubMed] [Google Scholar]
- 22. Castorena CM, Mackrell JG, Bogan JS, Kanzaki M, Cartee GD. Clustering of GLUT4, TUG, and RUVBL2 protein levels correlate with myosin heavy chain isoform pattern in skeletal muscles, but AS160 and TBC1D1 levels do not. J Appl Physiol (1985). 2011;111:1106–1117. doi:10.1152/japplphysiol.00631.2011 [DOI] [PMC free article] [PubMed] [Google Scholar]
- 23. Mackrell JG, Cartee GD. A novel method to measure glucose uptake and myosin heavy chain isoform expression of single fibers from rat skeletal muscle. Diabetes. 2012;61:995–1003. doi: 10.2337/db11-1299 [DOI] [PMC free article] [PubMed] [Google Scholar]
- 24. Karakelides H, Irving BA, Short KR, O’Brien P, Nair KS. Age, obesity, and sex effects on insulin sensitivity and skeletal muscle mitochondrial function. Diabetes. 2010;59:89–97. doi: 10.2337/db09-0591 [DOI] [PMC free article] [PubMed] [Google Scholar]
- 25. Affourtit C. Mitochondrial involvement in skeletal muscle insulin resistance: A case of imbalanced bioenergetics. Biochim Biophys Acta. 2016;1857:1678–1693. doi: 10.1016/j.bbabio.2016.07.008 [DOI] [PubMed] [Google Scholar]
- 26. Hesselink MK, Schrauwen-Hinderling V, Schrauwen P. Skeletal muscle mitochondria as a target to prevent or treat type 2 diabetes mellitus. Nat Rev Endocrinol. 2016;12:633–645. doi: 10.1038/nrendo.2016.104 [DOI] [PubMed] [Google Scholar]
- 27. Pagel-Langenickel I, Bao J, Pang L, Sack MN. The role of mitochondria in the pathophysiology of skeletal muscle insulin resistance. Endocr Rev. 2010;31:25–51. doi:10.1210/er.2009-0003 [DOI] [PMC free article] [PubMed] [Google Scholar]
- 28. Gouspillou G, Hepple RT. Facts and controversies in our understanding of how caloric restriction impacts the mitochondrion. Exp Gerontol. 2013;48:1075–1084. doi: 10.1016/j.exger.2013.03.004 [DOI] [PubMed] [Google Scholar]
- 29. Martin-Montalvo A, de Cabo R. Mitochondrial metabolic reprogramming induced by calorie restriction. Antioxid Redox Signal. 2013;19:310–320. doi:10.1089/ars.2012.4866 [DOI] [PMC free article] [PubMed] [Google Scholar]
- 30. Hancock CR, Han DH, Higashida K, Kim SH, Holloszy JO. Does calorie restriction induce mitochondrial biogenesis? A reevaluation. FASEB J. 2011;25:785–791. doi:10.1096/fj.10-170415 [DOI] [PMC free article] [PubMed] [Google Scholar]
- 31. Lanza IR, Zabielski P, Klaus KA et al. Chronic caloric restriction preserves mitochondrial function in senescence without increasing mitochondrial biogenesis. Cell Metab. 2012;16:777–788. doi:10.1016/j.cmet.2012.11.003 [DOI] [PMC free article] [PubMed] [Google Scholar]
- 32. Finley LW, Lee J, Souza A et al. Skeletal muscle transcriptional coactivator PGC-1α mediates mitochondrial, but not metabolic, changes during calorie restriction. Proc Natl Acad Sci USA. 2012;109:2931–2936. doi:10.1073/pnas.1115813109 [DOI] [PMC free article] [PubMed] [Google Scholar]
- 33. Menshikova EV, Ritov VB, Dube JJ et al. Calorie restriction-induced weight loss and exercise have differential effects on skeletal muscle mitochondria despite similar effects on insulin sensitivity. J Gerontol A Biol Sci Med Sci. 2017 Feb 2. doi: 10.1093/gerona/glw328. [Epub ahead of print]. [DOI] [PMC free article] [PubMed] [Google Scholar]
- 34. Toledo FG, Menshikova EV, Azuma K et al. Mitochondrial capacity in skeletal muscle is not stimulated by weight loss despite increases in insulin action and decreases in intramyocellular lipid content. Diabetes. 2008;57:987–994. doi:10.2337/db07-1429 [DOI] [PubMed] [Google Scholar]
- 35. Mackrell JG, Arias EB, Cartee GD. Fiber type-specific differences in glucose uptake by single fibers from skeletal muscles of 9- and 25-month-old rats. J Gerontol A Biol Sci Med Sci. 2012;67:1286–1294. doi:10.1093/gerona/gls194 [DOI] [PMC free article] [PubMed] [Google Scholar]
- 36. Cartee GD, Arias EB, Yu CS, Pataky MW. Novel single skeletal muscle fiber analysis reveals a fiber type-selective effect of acute exercise on glucose uptake. Am J Physiol Endocrinol Metab. 2016;311:E818–E824. doi:10.1152/ajpendo.00289.2016 [DOI] [PMC free article] [PubMed] [Google Scholar]
- 37. Castorena CM, Arias EB, Sharma N, Bogan JS, Cartee GD. Fiber type effects on contraction-stimulated glucose uptake and GLUT4 abundance in single fibers from rat skeletal muscle. Am J Physiol Endocrinol Metab. 2015;308:E223–E230. doi: 10.1152/ajpendo.00466.2014 [DOI] [PMC free article] [PubMed] [Google Scholar]
- 38. Escrivá F, Gavete ML, Fermín Y et al. Effect of age and moderate food restriction on insulin sensitivity in Wistar rats: role of adiposity. J Endocrinol. 2007;194:131–141. doi: 10.1677/joe.1.07043 [DOI] [PubMed] [Google Scholar]
- 39. Delp MD, Duan C. Composition and size of type I, IIA, IID/X, and IIB fibers and citrate synthase activity of rat muscle. J Appl Physiol (1985). 1996;80:261–270. [DOI] [PubMed] [Google Scholar]
- 40. Sequea DA, Sharma N, Arias EB, Cartee GD. Calorie restriction enhances insulin-stimulated glucose uptake and Akt phosphorylation in both fast-twitch and slow-twitch skeletal muscle of 24-month-old rats. J Gerontol A Biol Sci Med Sci. 2012;67:1279–1285. doi:10.1093/gerona/gls085 [DOI] [PMC free article] [PubMed] [Google Scholar]
- 41. Sharma N, Wang H, Arias EB, Castorena CM, Cartee GD. Mechanisms for independent and combined effects of calorie restriction and acute exercise on insulin-stimulated glucose uptake by skeletal muscle of old rats. Am J Physiol Endocrinol Metab. 2015;308:E603–E612. doi:10.1152/ajpendo.00618.2014 [DOI] [PMC free article] [PubMed] [Google Scholar]
- 42. Wang H, Sharma N, Arias EB, Cartee GD. Insulin signaling and glucose uptake in the soleus muscle of 30-month-old rats after calorie restriction with or without acute exercise. J Gerontol A Biol Sci Med Sci. 2016;71:323–332. doi:10.1093/gerona/glv142 [DOI] [PMC free article] [PubMed] [Google Scholar]
- 43. Cartee GD, Kietzke EW, Briggs-Tung C. Adaptation of muscle glucose transport with caloric restriction in adult, middle-aged, and old rats. Am J Physiol. 1994;266:R1443–R1447. [DOI] [PubMed] [Google Scholar]
- 44. Dean DJ, Brozinick JT Jr, Cushman SW, Cartee GD. Calorie restriction increases cell surface GLUT-4 in insulin-stimulated skeletal muscle. Am J Physiol. 1998;275:E957–E964. [DOI] [PubMed] [Google Scholar]
- 45. Hepple RT, Baker DJ, McConkey M, Murynka T, Norris R. Caloric restriction protects mitochondrial function with aging in skeletal and cardiac muscles. Rejuvenation Res. 2006;9:219–222. doi:10.1089/rej.2006.9.219 [DOI] [PubMed] [Google Scholar]
- 46. Miller BF, Robinson MM, Bruss MD, Hellerstein M, Hamilton KL. A comprehensive assessment of mitochondrial protein synthesis and cellular proliferation with age and caloric restriction. Aging Cell. 2012;11:150–161. doi:10.1111/j.1474-9726.2011.00769.x [DOI] [PMC free article] [PubMed] [Google Scholar]
- 47. Gouspillou G, Sgarioto N, Norris B et al. The relationship between muscle fiber type-specific PGC-1α content and mitochondrial content varies between rodent models and humans. PLoS One. 2014;9:e103044. doi:10.1371/journal.pone.0103044 [DOI] [PMC free article] [PubMed] [Google Scholar]
- 48. Arias EB, Cartee GD. In vitro simulation of calorie restriction-induced decline in glucose and insulin leads to increased insulin-stimulated glucose transport in rat skeletal muscle. Am J Physiol Endocrinol Metab. 2007;293:E1782–E1788. [DOI] [PubMed] [Google Scholar]
- 49. de Cabo R, Fürer-Galbán S, Anson RM, Gilman C, Gorospe M, Lane MA. An in vitro model of caloric restriction. Exp Gerontol. 2003;38:631–639. [DOI] [PubMed] [Google Scholar]
- 50. Fontana L, Partridge L, Longo VD. Extending healthy life span–from yeast to humans. Science. 2010;328:321–326. doi: 10.1126/science.1172539 [DOI] [PMC free article] [PubMed] [Google Scholar]
Associated Data
This section collects any data citations, data availability statements, or supplementary materials included in this article.


