

Abstract
Gray matter (GM) atrophy and brain glucose hypometabolism are already detected in the predementia stages of Alzheimer’s disease (AD), but the regional and longitudinal associations between the two are not well understood. Here, we analyzed the patterns of longitudinal atrophy (magnetic resonance imaging [MRI]) and 18F-Fluorodeoxyglucose–positron emission tomography ([18F]FDG-PET) metabolism decline in 40 cognitively healthy control (HC) and 52 mildly impaired (mild cognitive impairment [MCI]) subjects during 3 years. Based on cerebrospinal fluid and brain amyloid-PET, the subjects were divided into amyloid-beta (Aβ)− and Aβ+ subgroups. In voxel-based and region of interest analyses, we compared the 3-year rates of change in GM and glucose metabolism between Aβ-subgroups, within each diagnostic group. In joint–independent component analyses, we assessed the patterns of covariation between longitudinal change in GM volume and glucose metabolism. MCI-Aβ+ showed faster atrophy than MCI-Aβ− within the temporal, medial temporal, and medial parietal lobes. HC-Aβ+ showed faster atrophy within the precuneus than HC-Aβ−. For FDG-PET metabolism, MCI-Aβ+ exhibited faster decline than MCI-Aβ in temporoparietal regions, whereas no differences between HC subgroups were observed. Joint–independent component analysis showed that accelerated atrophy and metabolism decline correlated across distant brain regions for MCI-Aβ+. In conclusion, abnormally increased levels of Aβ in nondemented subjects were associated with accelerated decline in both GM and glucose metabolism, where both types of neurodegeneration progress in spatially divergent patterns.
Keywords: Longitudinal, Neurodegeneration, Alzheimer’s, Neuroimaging, Multivariate, Multimodal
1. Introduction
In Alzheimer’s disease (AD), pathological brain changes precede the onset of clinical symptoms by many years.
Cross-sectional analysis of cerebrospinal fluid (CSF) and amyloid positron emission tomography (PET)-based biomarker studies have suggested that abnormal biomarker levels of amyloid-β (Aβ) can be observed already about 15–20 years before the onset of dementia symptoms in familial AD (Bateman et al., 2012) and sporadic AD (Villemagne et al., 2013). In cognitively healthy control (HC) subjects, global amyloid-PET uptake is abnormally increased in an age-dependent manner ranging from 18% in HC subjects 60–69 years old to over 65% in subjects >80 years (Rowe et al., 2010). In mild cognitive impairment (MCI), most of the subjects show abnormally increased global amyloid-PET uptake (Klunk, 2011).
Results from a large number of studies including magnetic resonance imaging (MRI) and 18F-Fluorodeoxyglucose-PET ([18F] FDG-PET) suggest that increased levels of Aβ in the brain are associated with increased neurodegeneration in the asymptomatic and prodromal phase of AD: results from cross-sectional studies in preclinical AD (HC with abnormal biomarkers of Aβ) showed reduced gray matter (GM) volume (atrophy) in the medial-temporal lobe and the posterior cingulate (Bourgeat et al., 2010; Oh et al., 2011) suggesting that neurodegeneration has already begun in these asymptomatic HC. Results of longitudinal MRI studies in preclinical AD suggest that over the course of 3–4 years, accelerated GM atrophy is confined to the medial-temporal lobe (Nosheny et al., 2015) and the posterior cingulate (Villemagne et al., 2013).
For FDG-PET, cross-sectional studies showed that Aβ-associated reductions in brain metabolism are present in the prodromal stage of AD but have only inconsistently been reported in preclinical AD [(Cohen et al., 2009; Jagust and Landau, 2012; Oh et al., 2014), reviewed in (Ewers et al., 2011)]. Longitudinal studies have shown an acceleration of FDG-PET metabolism decline in subjects with prodromal AD. In preclinical AD, FDG-PET changes over a short follow-up period of 1–2 years have been reported to be independent of Aβ (Ewers et al., 2012; Knopman et al., 2013). It has been proposed that increased levels of Aβ are not associated with FDG-PET in AD once apolipoprotein E (ApoE) genotype differences are accounted for (Jagust and Landau, 2012).
Results from cross-sectional studies in AD dementia patients suggest that the level of FDG-PET hypometabolism exceeds GM atrophy in the posterior parietal cortex, but GM atrophy exceeds FDG-PET hypometabolism within the hippocampal area (La Joie et al., 2012). However, it is currently unclear how the spatial evolution of GM atrophy differs from that of FDG-PET throughout the early amyloid-positive stages of AD. In the present longitudinal 3-year study of combined MRI and FDG-PET, we asked the question whether in non-demented subjects with increased levels of brain Aβ, the spatial spreading of FDG-PET hypometabolism differs from that of MRI-assessed GM atrophy. The specific aims were (1) to compare the region-dependent effects of Aβ on GM change versus FDG-PET metabolism and (2) to assess the regional association between changes in GM and changes in FDG-PET in nondemented subjects.
2. Materials and methods
2.1. Subjects
The present study included 40 HC subjects and 52 subjects with MCI from the Alzheimer’s Disease Neuroimaging Initiative (ADNI) study [(Mueller et al., 2005) and www.adni-info.org]. ADNI I includes 819 subjects, of which only a subset (see Fig. 1) met the inclusion criteria for the present study: (1) yearly follow-up structural MRI and FDG-PET scans for 3 years after baseline and (2) available CSF Aβ1–42 measurements at baseline or amyloid-PET (11C-Pittsburgh Compund-B-PET [PiB-PET] or 18F-AV45 PET) images available at any time point. Because of the study design of the first phase of ADNI, subjects diagnosed with AD dementia at the initial visit were followed up no longer than 2 years and were thus not included in the current sample.
Fig. 1.
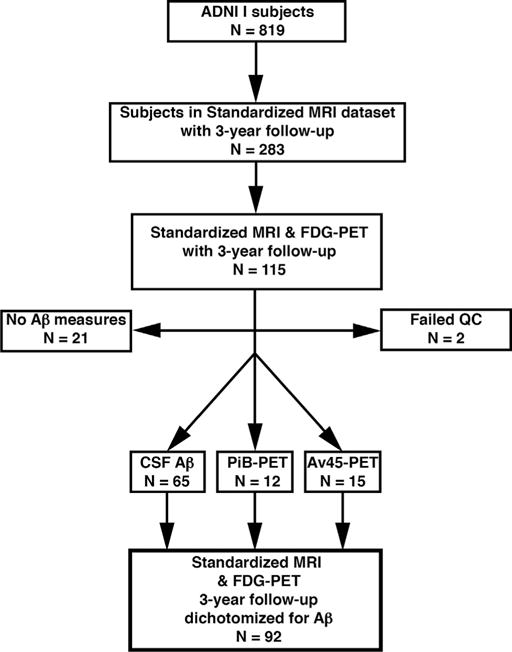
Flowchart for subject inclusion. Abbreviations: Aβ, amyloid-beta; ADNI, Alzheimer’s Disease Neuroimaging Initative; CSF, cerebrospinal fluid; FDG, Fluorodeoxyglucose; MRI, magnetic resonance imaging; PET, positron emission tomography; QC, quality-control.
According to the ADNI diagnostic criteria, subjects were classified as HC at baseline if they showed a clinical dementia rating of 0 and Mini-Mental State Examination scores between 24 and 30 (inclusive) and an absence of memory complaints or impaired memory function. Normal memory function was defined with respect to scoring by the delayed Paragraph Recall subscale of the Wechsler Memory Scaled–Revised, corrected for years of education as follows: score ≥9 for 16 or more years of education, ≥5 for 8–15 years of education and ≥3 for 0–7 years of education (Petersen et al., 2010).
MCI was diagnosed according to subjective memory complaints verified by a study partner, clinical dementia rating = 0.5 and delayed paragraph recall scores corrected for years of education as follows: score ≤8 for 16 or more years of education, ≤4 for 8–15 years of education, and ≤2 for 0–7 years of education. See the ADNI Procedures Manual for further details on diagnostic criteria and neuropsychological assessments (available at the ADNI study Web site http://adni.loni.usc.edu/wp-content/uploads/2010/09/ADNI_GeneralProceduresManual.pdf).
The ADNI was launched in 2003 by the National Institute on Aging, the National Institute of Biomedical Imaging and Bioengineering, the Food and Drug Administration, private pharmaceutical companies, and nonprofit organizations as a $60 million, 5-year public-private partnership. The primary goal of ADNI has been to test whether serial MRI, PET, other biological markers, and clinical and neuropsychological assessment can be combined to measure the progression of MCI and early AD. Determination of sensitive and specific markers of very early AD progression is intended to aid researchers and clinicians to develop new treatments and monitor their effectiveness, as well as lessen the time and cost of clinical trials.
The principal investigator of this initiative is Michael W. Weiner, MD, VA Medical Center and University of California–San Francisco. ADNI is the result of efforts of many coinvestigators from a broad range of academic institutions and private corporations, and subjects have been recruited from >50 sites across the United States and Canada. The initial goal of ADNI was to recruit 800 subjects but ADNI has been followed by ADNI-GO and ADNI-2. To date, these 3 protocols have recruited >1500 adults, ages 55–90 years, to participate in the research, consisting of cognitively normal older individuals, people with early or late MCI, and people with early AD. The follow-up duration of each group is specified in the protocols for ADNI-1, ADNI-2, and ADNI-GO. Subjects originally recruited for ADNI-1 and ADNI-GO had the option to be followed in ADNI-2. For up-to-date information, see www.adni-info.org.
2.2. CSF measurement of Aβ levels
CSF samples were acquired at the ADNI clinical centers, frozen at −80 °C and shipped for analysis to the ADNI Biomarker Core at the University of Pennsylvania. The concentration of CSF Aβ was measured at baseline with the multiplex xMAP Luminex platform (Luminex Corp, Austin, TX, USA). For a detailed description of protocols and procedure see Shaw et al. (2009).
2.3. PiB-PET measurement of Aβ levels
PiB-PET scans consisted of 4 × 300 seconds frames measured 50 minutes after injection of 15 ± 1.5 mCi of PiB. Correction for attenuation was performed with the aid of computed tomography or transmission scans, and the scans were preprocessed to result in standard orientation, voxel size, and resolution across subjects. In this study, we used global standardized uptake value ratios (SUVR) PiB-PET values obtained as the average of 14 different representative regions of interest (ROIs) throughout the brain: anterior cingulate, frontal cortex, lateral temporal cortex, parietal cortex, precuneus cortex, mesial temporal cortex, occipital cortex, occipital pole, pons, anterior ventral striatum, cerebellum, sensory motor cortex, subcortical white matter (WM), and thalamus. The cerebellum was taken as reference region. These preprocessing and analysis steps of the PiB-PET scans were performed by the PET Facility of the University of Pittsburgh and the methodology and results of the analyses are available at the ADNI study Web site (http://adni.loni.usc.edu/methods/pet-analysis/).
2.4. AV45-PET measurement of Aβ levels
AV45-PET scans consisted of 4 × 300 seconds frames measured 50 minutes after injection of 10 ± 1.0 mCi of Florbetapir (18F). Similar to the PiB-PET case, we used SUVR AV45-PET values obtained as the average of image values within several representative ROIs for images with standard orientation, voxel size, and resolution. The cerebellum was taken as the reference region. The preprocessed images a methodology overview and the result analyses are available at the ADNI study Web site (http://adni.loni.usc.edu/methods/pet-analysis/).
2.5. Three-dimensional T1-weighted MRI
The MRI scans were obtained from a standardized MRI data set in ADNI I, which passed image quality criteria established by the ADNI MRI core. The standard data set has been proposed by Wyman et al. (Wyman et al., 2013) in order to unify selection criteria for MRI scans among researchers working with ADNI data. For the present study, only subjects with yearly follow-up visits for a total of 3 years were included. All of these scans underwent field-gradient correction, B1-calibration correction and N3 correction of residual intensity inhomogeneities by the ADNI MRI core unit (http://adni.loni.usc.edu/data-samples/mri/).
2.6. FDG-PET
FDG-PET scans consisted of 6 × 300 seconds frames measured 30 minutes after injection of 5 ± 0.5 mCi of [18F]FDG. All the scans were attenuation-corrected, preprocessed images with standard orientation, voxel size, and resolution (http://adni.loni.usc.edu/data-samples/pet/). To correct for possible differences in global levels of FDG-PET, each voxel value within the spatially-normalized FDG-PET images (see the following the section) were scaled to their average value within the pons and vermis.
2.7. Longitudinal preprocessing of MRI scans
For each subject, the MRI scans of each of the 4 time points (baseline and 3 annual follow-up scans) were rigidly aligned between time points. An intrasubject mean image was obtained by averaging the realigned scans. The rigidly-aligned MRI scans were segmented into 3 tissue classes: GM, WM, and CSF (Ashburner and Friston, 2005). To estimate the spatial normalization parameters, the intrasubject mean image was normalized to the Montreal Neurological Institute T1-weighted MRI template via nonlinear diffeomorphic transformation [DARTEL tool in SPM8 (Ashburner, 2007)]. Subsequently, the estimated spatial normalization parameters were applied to all image segments (GM, WM, CSF) at each time point. The longitudinal preprocessing was performed with the VBM8 toolbox [http://dbm.neuro.uni-jena.de/vbm/ (Luders et al., 2004)] of SPM8 (http://www.fil.ion.ucl.ac.uk/spm/). The quality of the preprocessed scans was assessed visually, resulting in 2 subjects being excluded because of the presence of artifacts in their GM segmentations. For the statistical analysis (see the following section) a GM mask was generated. All of the spatially normalized GM segments were averaged across subjects and time points and scaled to a maximum value of 1. The average image was binarized, applying a threshold of >0.3.
2.8. Longitudinal preprocessing of FDG-PET scans
The FDG-PET scans were coregistered to the MRI intrasubject mean image via affine transformations, for each time point separately. Afterward, the normalization to MNI-space of the FDG-PET scans was computed by applying the normalization parameters estimated for the average image in the MRI pipeline to the FDG-PET scans at each time point.
We accounted for atrophy effects on FDG-PET SUVR values as explained in the Section 2.11. In addition, we performed partial volume effects (PVE) corrections with 2 alternative methods for cross-validation purposes: the ROI-based Geometric Transfer Matrix (GTM) method (Rousset et al., 1998) and the voxel-based Müller-Gärtner method (Muller-Gartner et al., 1992).
2.9. ROI value extraction and analysis
We complemented our main voxel-based analysis with an ROI-based assessment of changes in GM volume and FDG-PET metabolism. In particular, we focused on 2 regions commonly investigated in the literature as biomarkers for AD progression: the hippocampus and a composite ROI based on a meta-analysis of regions that show decreased FDG-PET uptake in AD (Landau et al., 2011), such as the posterior cingulate, and the lateral temporoparietal cortex (we refer to it as the temporoparietal ROI in the remainder). We extracted GM and FDG-PET values within both ROIs from the MNI-normalized, unsmoothed GM segments, and the MNI-normalized, unsmoothed FDG-PET images scaled to the pons and/or vermis, for each subject and time point separately. For the hippocampus ROI, the extraction was performed using the Automatic Anatomical Labeling atlas (Tzourio-Mazoyer et al., 2002), averaging the values for the left and right hippocampi. The temporoparietal ROI is available at http://adni.loni.usc.edu/methods/research-tools/.
2.10. Dichotomization of diagnostic groups based on Aβ biomarker measurements
We dichotomized each diagnostic group (HC and MCI) into subgroups of abnormally high Aβ levels (HC Aβ+ or MCI Aβ+) and normal Aβ levels (HC Aβ− or MCI Aβ−) based on CSF Aβ1–42 concentration (N = 65) and global brain levels of PiB-PET (N = 12) or AV45-PET (N = 15).
Previous studies have shown good correspondence between the different measures CSF and molecular PET for determining normal versus abnormal Aβ levels (Ewers et al., 2012; Fagan et al., 2006). We applied previously established cutoff values for each measure, that is, for CSF Aβ values, subjects with [AβCSF] ≤ 192 pg/mL were classified as Aβ+ (Shaw et al., 2009) and for PiB-PET and AV45-PET imaging, subjects with global SUVR values ≥1.5 and ≥1.13, respectively were classified as Aβ+ (Jagust et al., 2010; Landau et al., 2013). These cutoff values provided a clear separation of our subjects into normal and abnormal Aβ levels within each modality as the distribution of CSF Aβ and amyloid-PET SUVR values has been shown to follow a bimodal distribution within the ADNI cohort (Ewers et al., 2012; Landau et al., 2013).
For subjects without a CSF Aβ measurement at baseline, the Aβ status was estimated based on global PiB-PET or AV45-PET binding. In the ADNI I study, amyloid-PET scanning was introduced only after the baseline assessment had been done. The PiB-PET scans were obtained between 12 and 48 months after baseline, whereas AV45-PET was obtained between 48 and 72 months after baseline. The change of global levels of amyloid-PET binding is relatively slow. For a time span as covered in the present study (maximum of 6 years), a linear extrapolation of the change seems appropriate and has been applied in previous studies (Mattsson et al., 2014). To estimate the Aβ status (Aβ+ vs. Aβ−) at baseline, we computed linear regressions with interval duration between visits as the predictor and global brain PiB-PET or AV45-PET SUVR as the dependent variable for each subject lacking CSF Aβ. The intercepts of the regressions were taken as the PiB-PET and AV45-PET SUVRs at baseline. All subjects with a PiB-PET scan (N = 12) had at least 1 follow-up scan, and thus, the baseline SUVRs could be estimated from the linear regressions alone. For subjects with only a single AV45-PET (2 of 15) scan, a subject with SUVR <1.13 (i.e., below cutoff) was considered Aβ− at baseline because Aβ deposition is expected to have increased rather than declined at a post-baseline assessment (Villemagne et al., 2013). For SUVR ≥1.13, we extrapolated the SUVR to baseline-based on a regression coefficient (yearly change in AV45-PET SUVR) that was estimated on the basis of a linear regression applied to longitudinal AV45-PET scans in the whole ADNI cohort.
2.11. Statistical analyses
2.11.1. Voxelwise group comparisons of rates of change in GM and FDG-PET
At the subject level of analysis, the voxelwise rates of change in GM volume, and FDG-PET metabolism were computed in linear regression models for each subject, with time t as the only independent variable:
| (1) |
where, Y(t) represents the voxel value for either GM volume or FDG-PET SUVR, B the corresponding rate of change, and c a constant term.
The time point t = 0 was defined as baseline, t = 1 as the first-year follow-up as, and so on until year 3. An intercept at t = 0 was included in the regression analysis to control for the baseline differences in GM volume and FDG-PET metabolism between subjects. The first level analysis resulted in 1 image per subject, B, representing voxel by voxel the slope of the regression, that is, the rate of change throughout the 3-year span from baseline to the last visit. Finally, the images were smoothed with an isotropic Gaussian kernel of full-width at half-maximum (FWHM) = 8 mm.
At the group level of analysis, the images containing the slopes B (rates of change) in GM and FDG-PET were subjected to an analysis of covariance for group comparison, separately for each imaging modality. The main independent variable was a group factor with 4 levels: HC Aβ+, MCI Aβ+, HC Aβ−, and MCI Aβ−. The analyses were corrected for age, gender, years of education, and ApoE genotype (ε4 carrier vs. noncarrier). Because we were interested in local brain changes, the global mean value of each slope image (computed within the GM mask described previously) was included as a covariate to correct for global brain changes. Unless specified otherwise, we applied a familywise error (FWE) corrected cluster-extent threshold at a significance level of α = 0.05 (with the voxel-level threshold of α = 0.001) (Woo et al., 2014). We also computed maps of the effect size [Cohen’s d (Cohen, 1992)] of the group comparisons to represent group differences unbiased by sample size. The voxel-based statistical analyses were performed with the flexible-factorial tool of SPM8 (http://www.fil.ion.ucl.ac.uk/spm/).
To control for the influence of GM changes onto FDG-PET changes, we repeated the voxelwise regression analysis at the subject level, this time including the voxel-values of GM volume as covariates in the regression model used to estimate the individual rates of change in FDG-PET metabolism:
| (2) |
where, YFDG(t) represents the voxel value of FDG-PET SUVR, GM(t) the GM voxel-value for each time point, and all other terms are as in Eq. (1). In this manner, the individual rates of change in FDG-PET were corrected by both average amount and longitudinal changes of GM volume. The second level analysis was repeated as previously mentioned, now including the slopes of FDG-PET changes controlled for changes in GM, B′. The voxelwise correction for GM volume of the FDG-PET scans as per Eq. (2) was performed with the robust biological parametric mapping toolbox of Matlab (http://www.nitrc.org/projects/rbpm/).
2.11.2. ROI statistical analysis
For each ROI, each modality and each time point, we transformed the subject ROI values into z-scores, based on the mean value and the standard deviation of the HC Aβ-group at baseline (see Supplementary Table 1 for these values). This allowed for cross-sectional and longitudinal comparisons between modalities as well as between groups. We computed the differences between the rates of change in GM volume and FDG-PET metabolism and between Aβ groups through linear mixed-effects models (Ewers et al., 2012). The random-effect term accounted for longitudinal changes at the subject level. The fixed effects were Aβ-status, time, and an interaction term Aβ-status × time. Similar to our voxel-based analyses, we interpreted significant interaction terms as significant differences in the rate of change in GM volume or FDG-PET metabolism between Aβ groups. Post hoc analyses of the main Aβ effects were used to assess which Aβ group showed a faster rate of change. Cross-sectional analyses at baseline and year 3 were performed with robust linear regression, with Aβ-status as main predictor. All longitudinal and cross-sectional analyses included age, gender, years of education, and ApoE genotype as covariates and were performed with the packages nlme (longitudinal) and MASS (cross-sectional) of the statistical software R, version 3.0.2 (http://www.r-project.org).
2.11.3. Joint ICA
To investigate joint patterns of changes in GM volume and FDG-PET metabolism, we performed a joint independent component analysis (jICA) analysis. Briefly, ICA decomposes the signal (i.e., here maps of estimated rates of change in FDG-PET and GM) into stochastically independent spatial components (Calhoun et al., 2009). In jICA, the ICA is applied to the concatenated matrix of maps of rates of change in GM and FDG-PET, thus determining spatial components of joint GM and FDG-PET changes. The first step in the jICA analysis involved an estimation of the number of independent components to be computed, based on the minimum description length algorithm (Calhoun et al., 2009). Ten components were estimated for the HCs and 14 for the MCIs. Group differences in the expression of these joint components were determined by comparing the mixing coefficients of the jICA components between the Aβ groups (2-sample t test per component, false-discovery rate [FDR] corrected across components). The jICA analysis was computed with the Fusion ICA Toolbox (http://mialab.mrn.org/software/fit/).
3. Results
3.1. Sample description
Subjects’ characteristics for each group are displayed in Table 1. MCI Aβ+ subjects were cognitively more impaired than MCI Aβ− (p < 0.05) as assessed by the cognitive subscale of the Alzheimer ’s Disease Assessment Scale (ADAS) battery (ADAS–cognitive sub-scale [Cog]). The difference in ADAS-Cog between HC groups was not significant, although HC Aβ+ subjects showed slightly worse cognitive performance than HC Aβ− (p = 0.06). The proportion of ApoE carriers was significantly larger in Aβ+ subjects both in HC (p < 0.05) and MCI when compared with Aβ− (p < 0.001). The proportion of converters to a diagnosis of either MCI or AD dementia was significantly larger in HC Aβ+ than in HC Aβ− after 3 years of follow-up (p < 0.05), and 50% of the HC Aβ+ subjects had converted after 7 years when compared to only 17% of the HC Aβ− (p < 0.05). The percentage of converters from MCI to a diagnosis of AD dementia within 3 years was only slightly larger (p = 0.06) in MCI Aβ+ (47%) than in MCI Aβ− subjects (18%), but the differences were nonsignificant after 7 years.
Table 1.
Subject characteristics at baseline
| Group | HC Aβ+ | HC Aβ− | MCI Aβ+ | MCI Aβ− |
|---|---|---|---|---|
| N | 14 | 26 | 36 | 16 |
| Gender (female/male) | 3/11 | 13/13 | 12/24 | 2/14 |
| Agea | 74.5 (5.3) | 75.5 (4.3) | 74.0 (7.0) | 75.6 (7.6) |
| Years of educationa | 15.7 (3.2) | 15.9 (3.0) | 16.2 (2.6) | 16.6 (2.9) |
| ADAS-Coga | 8.8 (3.2) | 6.6 (2.9) | 11.2 (4.0)* | 8.9 (3.9) |
| ApoE (ε4+/ε4−) | 8/6* | 5/21 | 26/10** | 1/15 |
| Converters after 3/after 7 yb | 4*/7* | 1/3 | 17/23 | 3/6 |
p < 0.05.
p < 0.001.
The comparisons were done between Aβ groups within each diagnostic group.
Key: Aβ, amyloid-beta; AD, Alzheimer’s disease; ADAS-Cog, Alzheimer’s Disease Assessment Scale Cognitive subscale; ApoE, apolipoprotein E; HC, healthy control; MCI, mild cognitive impairment.
Values are mean (standard deviation).
Number of subjects who converted from HC to MCI or AD, or from MCI to AD within 3 and/or within 7 y after the initial visit.
3.2. Effect of high Aβ levels on the rates of regional GM atrophy
In MCI Aβ+ subjects, we observed faster rates of GM atrophy when compared to MCI Aβ-subjects, with peaks located within medial brain areas (anterior cingulum, hippocampal area), the lateral temporal, and ventral prefrontal cortex (Fig. 2A, Table 2). Beyond those areas of statistically significant group differences, visual inspection of the map of the voxelwise effect sizes (unthresholded, Fig. 2B) suggested a subtle, yet statistically nonsignificant, acceleration of GM atrophy rates in wider areas of the prefrontal and temporal lobes in MCI Aβ+ subjects.
Fig. 2.

For the rates of GM atrophy, the t-map of the group difference between MCI Aβ+ versus MCI Aβ− (A) and HC Aβ+ versus HC Aβ− (C) are superimposed onto axial brain slices. The t-map of the group differences within the MCI subjects (A) is thresholded at α = 0.001 at the voxel-level and α = 0.05 (FWE-corrected) at the cluster-level. The t-map of the group differences within the HC subjects (B) is thresholded at α = 0.01 at the voxel-level and α = 0.05 (familywise error corrected) at the cluster-level. The unthresholded maps of the effect size d of the group differences between MCI Aβ+ versus MCI Aβ− (B) and HC Aβ+ versus HC Aβ− (D) are shown. Red represents faster decline in MCI Aβ+ (B) and HC Aβ+ (D) compared to the corresponding Aβ− groups, whereas blue represent Aβ-group differences in the opposite direction. Abbreviations: Aβ, amyloid-beta; GM, gray matter; HC, healthy control; MCI, mild cognitive impairment. (For interpretation of the references to color in this figure legend, the reader is referred to the Web version of this article.)
Table 2.
Results for voxelwise group comparison of rates of decline in GM and FDG-PET
| Modality | Comparison | Label (AAL atlas) | Size (voxels) | Size (mm3) | p (FWE) | p (unc.) | T | (x, y, z) (mm) |
|---|---|---|---|---|---|---|---|---|
| GM atrophy rates | MCI Aβ+ > MCI Aβ− | Middle temporal gyrus | 49,019 | 1.7 × 10⁵ | <0.001 | <0.001 | 7.9 | (−63, −4, −15) |
| HC Aβ+ > HC Aβ− | Middle cingulate gyrus | 3082 | 1.0 × 10⁴ | 0.033 | 0.001 | 4.1 | (4, −54, 31) | |
| FDG-PET decline rates | MCI Aβ+ > MCI Aβ− | Precuneus | 16,826 | 5.7 × 10⁴ | <0.001 | 0.001 | 5.1 | (−3, −75, 49) |
| Inferior temporal gyrus | 4333 | 1.5 × 10⁴ | 0.013 | <0.001 | 5.0 | (68, −40, −15) | ||
| Angular gyrus | 6908 | 2.0 × 10⁴ | 0.002 | <0.001 | 6.0 | (−46, −66, 33) | ||
| Atrophy-corrected FDG-PET decline rates | MCI Aβ+ > MCI Aβ− | Angular Gyrus | 13,491 | 4.6 × 10⁴ | <0.001 | <0.001 | 6.0 | (−46, −66, 33) |
| Posterior cingulum | 3187 | 5.2 × 10⁴ | 0.003 | <0.001 | 4.5 | (−3, −39, 22) | ||
| Angular gyrus | 1534 | 1.1 × 10⁴ | 0.043 | <0.001 | 3.9 | (48, −66, 36) |
Key: AAL, Automated Anatomic Labeling; Aβ, amyloid-beta; FDG, Fluorodeoxyglucose; FWE, familywise error corrected; GM, gray matter; MCI, mild cognitive impairment; PET, positron emission tomography; unc., uncorrected.
In HCs, the comparison of GM atrophy rates between Aβ-groups yielded no significant results after correcting for multiple comparisons at the cluster level. Because in HC subjects smaller Aβ-related effects were expected, we lowered the voxel-level significance threshold to α = 0.01 keeping the FWE-corrected cluster-level threshold at α = 0.05. At this level, HC Aβ+ subjects exhibit faster rates of GM atrophy within a single cluster encompassing the precuneus, the cuneus, and the posterior cingulum (see Table 2). Group differences in the opposite direction (HC Aβ− > HC Aβ+) were not significant. In Fig. 2D the effect size map for the comparison of decline rates between HC groups is shown. Beyond the posterior parietal cortex, where the group effects were statistically significant, the ventral prefrontal cortex, medial-temporal lobe, and medial-parietal brain regions showed the largest, yet statistically nonsignificant, effect sizes of group differences between HC Aβ+ and HC Aβ−.
3.3. Effect of high Aβ levels on the rates of regional FDG-PET metabolism decline
In MCI Aβ+, significantly larger rates of decline in FDG-PET metabolism were observed when compared with MCI Aβ− subjects, with peaks located within the temporal and parietal brain regions (Fig. 3A, Table 2). The effect sizes for this group comparison are shown in Fig. 3B, which confirms that the largest effect sizes were confined predominantly within the medial and lateral temporal lobe, posterior cingulum region, and lateral parietal cortex.
Fig. 3.

For the rates of decline in FDG-PET metabolism, the t-map of the group difference between MCI Aβ+ versus MCI Aβ− is superimposed onto axial brain slices in (A) for FDG-PET changes uncorrected for atrophy and in (C) for corrected FDG-PET. The t-maps are thresholded at α = 0.001 at the voxel-level and α = 0.05 (familywise error corrected) at the cluster level. The unthresholded maps of the effect size d of the group differences between MCI Aβ+ versus MCI Aβ− are shown in B and D for uncorrected and corrected FDG-PET, respectively. Red represents faster decline for MCI Aβ+ whereas blue represent differences in the opposite direction. Abbreviations: Aβ, amyloid-beta; FDG, Fluorodeoxyglucose; MCI, mild cognitive impairment; PET, positron emission tomography. (For interpretation of the references to color in this figure legend, the reader is referred to the Web version of this article.)
After controlling for decline in GM volume voxel by voxel at the subject level [Eq. (2)], significant faster decline of FDG-PET metabolism for MCI Aβ+ remained in most brain regions (Fig. 3C), although the effect sizes were reduced on average (Fig. 3D). The results of the GTM method for PVE correction confirmed significantly increased decline in FDG-PET metabolism within parietal brain regions in MCI Aβ+ subjects (Supplementary Fig. 1). For the Müller-Gärtner method, significantly faster FDG-PET decline in MCI Aβ+ subjects was not observed. Instead, an increase in FDG-PET within the medial-temporal lobe in the MCI Aβ+ group was observed (Supplementary Fig. 2). However, we did not find any increases in FDG-PET metabolism, neither with the GTM method nor when correcting for GM atrophy at the subject level (Fig. 3).
There were no significant group differences between HC subgroups, even not at the more lenient significance threshold (0.01 voxelwise, with cluster-level [FWE-corrected] α = 0.05). The unthresholded effect size maps for the HC Aβ+ versus HC Aβ− group comparison are presented in Supplementary Fig. 3.
3.4. ROI-based analysis of longitudinal changes in GM volume and FDG-PET metabolism
To test whether Aβ group differences in the decline were present in a piori hypothesized brain areas (hippocampus and temporoparietal lobe), we conducted an ROI analysis.
Within the hippocampus ROI, GM volume declined faster in MCI Aβ+ (compared with MCI Aβ−) and in HC Aβ+ (compared with HC Aβ−; Fig. 4A, Table 3). The decline in FDG-PET metabolism within the hippocampus ROI (Fig. 4B) was not significantly different between Aβ groups, neither for MCI nor for HC.
Fig. 4.

The GM volume and FDG-PET metabolism within the hippocampus and the temporoparietal regions of interest are displayed as z-scores for each time point (in years) and group. The error bars represent the standard error around the mean z-score. A linear regression line is shown for each group separately. Abbreviations: Aβ, amyloid-beta; FDG, Fluorodeoxyglucose; GM, gray matter; HC, healthy control; MCI, mild cognitive impairment; PET, positron emission tomography.
Table 3.
Results for ROI group comparison of rates of change in GM and FDG-PET
| ROI | Modality | Group | Rate of change | Group difference in rates of change |
|---|---|---|---|---|
| Hippocampus | MRI | HC Aβ+ | −0.28 (0.06)** | −0.13 (0.05)* |
| HC Aβ− | −0.15 (0.02)** | |||
| MCI Aβ+ | −0.38 (0.03)** | −0.19 (0.06)** | ||
| MCI Aβ− | −0.19 (0.07)* | |||
| FDG-PET | HC Aβ+ | n.s. | n.s. | |
| HC Aβ− | n.s. | |||
| MCI Aβ+ | −0.15 (0.02)** | n.s. | ||
| MCI Aβ− | −0.18 (0.05)* | |||
| Temporoparietal | MRI | HC Aβ+ | −0.09 (0.03)* | n.s. |
| HC Aβ− | n.s. | |||
| MCI Aβ+ | −0.11 (0.02)** | n.s. | ||
| MCI Aβ− | n.s. | |||
| FDG-PET | HC Aβ+ | 0.08 (0.05)+ | n.s. | |
| HC Aβ− | n.s. | |||
| MCI Aβ | −0.15 (0.03)** | 0.11 (0.06)+ | ||
| MCI Aβ− | n.s. |
p ~0.1 (trend-level association).
p < 0.05.
p < 0.001.
Average rates of change (standard error) are shown. The p-values refer to the difference of the rates of change compared to 0 within each group (column “rates of change”) or to the difference in the rates of changes between 2 groups (column “Group difference in rates of change”).
Key: Aβ, amyloid-beta; FDG, Fluorodeoxyglucose; GM, gray matter; HC, healthy control; MCI, mild cognitive impairment; MRI, magnetic resonance imaging; n.s., not significant; PET, positron emission tomography; ROI, region of interest.
In the temporoparietal ROI, GM volume was not significantly different between Aβ groups, neither for MCI nor for HC (Fig. 4C). Decline of FDG-PET metabolism within the temporoparietal ROI was marginally faster in MCI Aβ+ compared with MCI Aβ− but did not differ between HC groups (Fig. 4D).
Cross-sectional analysis at baseline and at year 3 yielded no significant Aβ group differences. The untransformed GM volume (cm3) and FDG-PET SUVR are provided in Supplementary Fig. 4.
3.5. Covariation patterns of the rates of GM atrophy and FDG-PET metabolism decline
To assess group differences for the joint changes in GM and FDG-PET, we conducted a jICA analysis in each diagnostic group. MCI Aβ+ differed from MCI Aβ− subjects on 1 jICA component [p(FDR) < 0.01, Fig. 5]. The component showed a pattern of GM atrophy within the medial-temporal and parietal lobes covarying with decline in FDG-PET metabolism within the hippocampus and the parietal cortex. This pattern was more strongly expressed in the MCI Aβ+ subjects compared with the MCI Aβ− subjects, suggesting faster joint GM and FDG-PET decline within the medial-temporal and parietal brain areas in the MCI Aβ+. There were no components with significant differences between HC Aβ+ and HC Aβ−.
Fig. 5.

Joint–independent component analysis component maps of joint group differences in GM atrophy rates (left panel A) and FDG-PET rates of decline (right panel B) of MCI subjects. The pattern of joint GM and FDG-PET changes was stronger expressed in MCI Aβ+ than MCI Aβ− subjects [p(FDR) < 0.01] The z-score-transformed maps of the component were thresholded at |z| > 2.4. Abbreviations: FDG, Fluorodeoxyglucose; MCI, mild cognitive impairment; PET, positron emission tomography.
4. Discussion
Our first major finding was that, Aβ had a differential effect on the rates of GM atrophy and FDG-PET hypometabolism across the preclinical stage and prodromal stages of AD: longitudinal GM changes within the medial-temporal and posterior parietal cortices were present at both stages (taking together ROI and voxel-based analyses in HC Aβ+), while prefrontal GM changes and FDG-PET changes within the temporal, medial, and lateral parietal cortices could be detected only in prodromal AD. Secondly, jICA showed joint increased rates of GM atrophy of the medial-temporal lobe and FDG-PET hypometabolism in the parietal cortex, suggesting that GM and metabolic brain changes are associated despite affecting spatially divergent brain regions.
For our first finding, we observed significantly faster rates of GM volume decline in HC Aβ+ subjects in the precuneus and posterior cingulum (voxel-based) and in the hippocampus (ROI-based), which are a subset of the brain regions affected in MCI Aβ+ subjects. Our findings are consistent with previous reports of significantly faster GM atrophy in the precuneus of presymptomatic subjects with autosomal dominantly inherited AD (Benzinger et al., 2013) as well as preclinical sporadic AD (HC Aβ+) subjects (Chetelat et al., 2012; Mattsson et al., 2014; Nosheny et al., 2015). Moreover, Aβ-related longitudinal atrophy of the medial-temporal lobe (MTL) in HC subjects has been reported previously (Dickerson et al., 2011; Knopman et al., 2013; Villemagne et al., 2013). Together, these results are consistent with the view that Aβ-related atrophy starts within the temporal and the medial-parietal cortex at the pre-symptomatic stage of AD (HC Aβ+), expanding within the temporal, frontal, and cingulate cortices at the prodromal stage (MCI Aβ+) (Benzinger et al., 2013).
Compared to the findings in GM atrophy, the analysis of the rates of decline in FDG-PET metabolism yielded markedly different results. No significant Aβ-group differences were detected, in HC subjects, in either voxel-based or ROI-based analyses. In MCI, Aβ+ subjects showed a faster decline in FDG-PET metabolism within regions centered within the temporoparietal cortex, consistent with previous studies in MCI (Ewers et al., 2012; Landau et al., 2012). Regions affected by accelerated atrophy, such as the medial-frontal and medial-temporal lobes, were largely spared by hypometabolism, but in contrast, the posterior cingulate cortex, showed reductions in both GM and FDG-PET for MCI Aβ+ subjects. FDG-PET hypometabolism was however present even after accounting for GM atrophy, suggesting that hypometabolism was not solely attributable to GM atrophy in our MCI Aβ+ sample.
Previous studies have shown subtle but significant associations between amyloid burden and faster FDG-PET hypometabolism in healthy elderly subjects (Jack et al., 2013), (Lowe et al., 2014), both cross-sectionally and longitudinally. Although we did not find such an associations longitudinally, cross-sectionally HC Aβ+ showed lower temporoparietal FDG-PET metabolism (Fig. 4D) when compared to HC Aβ− at trend level. However, other studies have suggested that Aβ effects on FDG-PET metabolism in HC subjects can be explained by higher ApoE ε4 allele frequency in Aβ subjects (Jagust and Landau, 2012; Knopman et al., 2014). Because we controlled for ApoE genotype status as a possible confounding factor in all of our analyses and because HC ApoE genotype was a significant predictor of FDG-PET hypometabolism in the temporoparietal ROI for HC cross-sectionally (also reported by Jagust and Landau, 2012), it is possible that ApoE ε4 partially accounts for changes in FDG-PET metabolism. Overall, previous results suggest that FDG-PET decline may start early, possibly earlier than GM atrophy, but that it progresses at a low rate, having accumulated by the preclinical stage of AD. Our results would be consistent with this view because HC Aβ+ showed lower cross-sectional FDG-PET uptake (at trend level, see Fig. 4) than HC Aβ−. If FDG-PET uptake does indeed decline at a slow rate, cross-sectional studies may be more sensitive to cumulative FDG-PET hypometabolism, whereas longitudinal studies may require larger sample sizes to detect such low rates of hypometabolism progression (in contrast to GM atrophy), and to further disentangle the effect of amyloid burden from ApoE-related effects. Finally, it is possible also that the lower spatial resolution of FDG-PET when compared with structural MRI renders FDG-PET simply a less sensitive way to assess brain changes over time, especially in voxel-based analyses.
Our second major finding was the presence of correlated patterns of GM atrophy and FDG-PET metabolism decline in MCI Aβ+ subjects. Regions with faster GM atrophy in MCI Aβ+ subjects (medial-temporal lobe, parietal, and medial-parietal cortices) were correlated with regions affected by faster FDG-PET metabolism decline (the temporal and parietal cortices). Similar to many previous studies of MCI subjects, these results support the view that prodromal AD is characterized by joint longitudinal atrophy and hypometabolism. Our jICA results expand on our voxel-based analysis by showing that Aβ not only influences the rate of decline in GM atrophy and FDG-PET hypometabolism but also that Aβ is related to correlations between such changes by the time the first cognitive symptoms appear. This implies that, MCI Aβ+ subjects showing accelerated GM atrophy also show accelerated FDG-PET metabolism although the patterns of decline do not overlap. The absence of joint patterns of decline of GM atrophy and FDG-PET metabolism in HCs may be due to the absence of significant differences in FDG-PET metabolism decline rates within that group. Results from recent combined cross-sectional MRI and FDG-PET biomarker studies suggest that jICA patterns may improve the clinical prediction of conversion from MCI to AD when compared to either MRI or FDG-PET alone (Shaffer et al., 2013), suggesting the clinical utility of such cross-modal brain differences.
A caveat of the present study is that, FDG-PET changes could be driven by the relatively strong GM changes due to PVE. Thus, the rates of declining FDG-PET metabolism may be overestimated in those brain areas where the rates GM atrophy are large or at the GM and/or WM boundaries. However, we took several measures to control for this important potential confound. First, we used a GM mask in all our analysis which ensured that most voxels at risk for PVE are excluded, in particular, those at the GM WM boundary. Second, we partialled out GM volume in the estimation of the rates of change in FDG-PET. The observed faster FDG-PET decline in MCI Aβ+ compared with MCI Aβ− was still present after this correction. Third, we performed PVE correction with the GTM method, which yielded results consistent with the correction for GM volume changes as per Eq. (2). The increase in the rates of PVE-corrected FDG-PET metabolism observed in MCI Aβ+ only with the Müller-Gärtner method may be have been a product of overcorrection and thus method-driven. It is thus unlikely that the results reflect compensatory hypermetabolism as suggested by a few other studies in HC (Jack et al., 2013) or MCI (Cohen et al., 2009) subjects.
Another caveat of our study is the definition of preclinical AD, based solely on amyloid burden as recommended by recent consensus group criteria. It should be mentioned that, high amyloid burden may be accompanied by increased tau pathology (Braak et al., 2011). In particular, the early pattern of GM atrophy presented in this and other studies resembles the Braak stages of neurofibrillary tangle deposition (Braak et al., 2011), which start in the medial-temporal cortex and expand to other medial structures such as the precuneus. In contrast, preclinical Aβ deposition is relatively lower in the medial-temporal lobe when compared with the rest of the forebrain. It is, therefore, possible that the observed Aβ-status effects on GM atrophy are partially due to concomitant tau pathology. Future studies will need to assess jointly the effect of Aβ and tau pathology on the rates of change in neurodegeneration.
Finally, it should be mentioned that a substantial proportion of Aβ-negative HC and MCI subjects may develop signs of neurodegeneration, which has been defined as suspected nonamyloid pathology subjects (Caroli et al., 2015; Petersen et al., 2013). Recent studies show that the etiology of those subjects is varied and they can “resemble AD clinically” (hence the presence of HC Aβ− and MCI Aβ− converters in Table 1), although it remains unclear what the exact underlying pathology is. An investigation of neurodegenerative profiles of suspected nonamyloid pathology subjects were however beyond the scope of this study, in particular, because of the low number of MCI Aβ−. In relation to this, it should also be noted that the clinical development of the Aβ+ subjects in the HC and MCI groups remains uncertain. Half of the HC Aβ+ subjects within our sample went on to develop MCI or AD over the course of 7 years after baseline, suggesting that the patterns of ongoing GM atrophy reported in this study may herald the development of later cognitive symptoms. However, owing to the low total number of converters and nonconverters in our sample, we could not directly assess whether such patterns are predictors of cognitive decline, which remains to be determined in future studies.
5. Conclusion
Our results demonstrate that, in cognitively healthy individuals, the patterns of subtle, Aβ-related changes in the pace of GM atrophy resemble those of mildly impaired subjects. Atrophy progressed at a faster pace than FDG-PET hypometabolism throughout the early stages of AD and both kinds of neurodegeneration became associated across distant brain regions by the time the first cognitive symptoms started to arise.
Supplementary Material
Acknowledgments
Dr. Ewers received support for this work from LMUexcellent and the European Commission (PCIG12-GA-2012-334259). Dr. Dichgans received support from the Alzheimer Forschung Initiative (AFI; grant number 12821). Dr. Weiner received support for his work from the following grants; 2U01AG024904 (NIH/NIA), W81XWH-13-1-0259 (DOD), W81XWH-12-2-0012 (DOD), R01 AG010897 (NIA/NIH), P01 AG19724 (NIH/NIA), R01A G038791 (NIA/NIH), ADNI 2-12-233036 (Alzheimer’s Association), R01 MH098062-01 (NIH/NIMH), 1I01CX000798-01A2 (Veterans Administration), W81XWH-14-1-0462 (DOD), W81XWH-09-2-0044 (DOD), 12-12004 (CA Department of Public Health), 5U19AG010482-23 (NIH/NIA), P50 AG23501 (NIH/NIA).
Appendix A. Supplementary data
Supplementary data associated with this article can be found, in the online version, http://dx.doi.org/10.1016/j.neurobiolaging.2015.08.007.
Footnotes
Disclosure statement
The authors have no conflicts of interest to disclose.
References
- Ashburner J. A fast diffeomorphic image registration algorithm. Neuroimage. 2007;38:95–113. doi: 10.1016/j.neuroimage.2007.07.007. [DOI] [PubMed] [Google Scholar]
- Ashburner J, Friston KJ. Unified segmentation. Neuroimage. 2005;26:839–851. doi: 10.1016/j.neuroimage.2005.02.018. [DOI] [PubMed] [Google Scholar]
- Bateman RJ, Xiong C, Benzinger TL, Fagan AM, Goate A, Fox NC, Marcus DS, Cairns NJ, Xie X, Blazey TM, Holtzman DM, Santacruz A, Buckles V, Oliver A, Moulder K, Aisen PS, Ghetti B, Klunk WE, McDade E, Martins RN, Masters CL, Mayeux R, Ringman JM, Rossor MN, Schofield PR, Sperling RA, Salloway S, Morris JC. Clinical and biomarker changes in dominantly inherited Alzheimer’s disease. N Engl J Med. 2012;367:795–804. doi: 10.1056/NEJMoa1202753. [DOI] [PMC free article] [PubMed] [Google Scholar]
- Benzinger TL, Blazey T, Jack CR, Jr, Koeppe RA, Su Y, Xiong C, Raichle ME, Snyder AZ, Ances BM, Bateman RJ, Cairns NJ, Fagan AM, Goate A, Marcus DS, Aisen PS, Christensen JJ, Ercole L, Hornbeck RC, Farrar AM, Aldea P, Jasielec MS, Owen CJ, Xie X, Mayeux R, Brickman A, McDade E, Klunk W, Mathis CA, Ringman J, Thompson PM, Ghetti B, Saykin AJ, Sperling RA, Johnson KA, Salloway S, Correia S, Schofield PR, Masters CL, Rowe C, Villemagne VL, Martins R, Ourselin S, Rossor MN, Fox NC, Cash DM, Weiner MW, Holtzman DM, Buckles VD, Moulder K, Morris JC. Regional variability of imaging biomarkers in autosomal dominant Alzheimer’s disease. Proc Natl Acad Sci U S A. 2013;110:E4502–E4509. doi: 10.1073/pnas.1317918110. [DOI] [PMC free article] [PubMed] [Google Scholar]
- Bourgeat P, Chetelat G, Villemagne VL, Fripp J, Raniga P, Pike K, Acosta O, Szoeke C, Ourselin S, Ames D, Ellis KA, Martins RN, Masters CL, Rowe CC, Salvado O, Group, A.R. Beta-amyloid burden in the temporal neocortex is related to hippocampal atrophy in elderly subjects without dementia. Neurology. 2010;74:121–127. doi: 10.1212/WNL.0b013e3181c918b5. [DOI] [PubMed] [Google Scholar]
- Braak H, Thal DR, Ghebremedhin E, Del Tredici K. Stages of the pathologic process in Alzheimer disease: age categories from 1 to 100 years. J Neuropathol Exp Neurol. 2011;70:960–969. doi: 10.1097/NEN.0b013e318232a379. [DOI] [PubMed] [Google Scholar]
- Calhoun VD, Liu J, Adali T. A review of group ICA for fMRI data and ICA for joint inference of imaging, genetic, and ERP data. Neuroimage. 2009;45:S163–S172. doi: 10.1016/j.neuroimage.2008.10.057. [DOI] [PMC free article] [PubMed] [Google Scholar]
- Caroli A, Prestia A, Galluzzi S, Ferrari C, van der Flier WM, Ossenkoppele R, Van Berckel B, Barkhof F, Teunissen C, Wall AE, Carter SF, Scholl M, Choo IH, Grimmer T, Redolfi A, Nordberg A, Scheltens P, Drzezga A, Frisoni GB. Mild cognitive impairment with suspected nonamyloid pathology (SNAP): prediction of progression. Neurology. 2015;84:508–515. doi: 10.1212/WNL.0000000000001209. [DOI] [PMC free article] [PubMed] [Google Scholar]
- Chetelat G, Villemagne VL, Villain N, Jones G, Ellis KA, Ames D, Martins RN, Masters CL, Rowe CC, Grp AR. Accelerated cortical atrophy in cognitively normal elderly with high beta-amyloid deposition. Neurology. 2012;78:477–484. doi: 10.1212/WNL.0b013e318246d67a. [DOI] [PubMed] [Google Scholar]
- Cohen AD, Price JC, Weissfeld LA, James J, Rosario BL, Bi W, Nebes RD, Saxton JA, Snitz BE, Aizenstein HA, Wolk DA, Dekosky ST, Mathis CA, Klunk WE. Basal cerebral metabolism may modulate the cognitive effects of A{beta} in mild cognitive impairment: an example of brain reserve. J Neurosci. 2009;29:14770–14778. doi: 10.1523/JNEUROSCI.3669-09.2009. [DOI] [PMC free article] [PubMed] [Google Scholar]
- Cohen J. A power primer. Psychol Bull. 1992;112:155–159. doi: 10.1037//0033-2909.112.1.155. [DOI] [PubMed] [Google Scholar]
- Dickerson BC, Stoub TR, Shah RC, Sperling RA, Killiany RJ, Albert MS, Hyman BT, Blacker D, Detoledo-Morrell L. Alzheimer-signature MRI biomarker predicts AD dementia in cognitively normal adults. Neurology. 2011;76:1395–1402. doi: 10.1212/WNL.0b013e3182166e96. [DOI] [PMC free article] [PubMed] [Google Scholar]
- Ewers M, Insel P, Jagust WJ, Shaw L, Trojanowski JJ, Aisen P, Petersen RC, Schuff N, Weiner MW. CSF biomarker and PIB-PET-derived beta-amyloid signature predicts metabolic, Gray matter, and cognitive changes in nondemented subjects. Cereb Cortex. 2012;22:1993–2004. doi: 10.1093/cercor/bhr271. [DOI] [PMC free article] [PubMed] [Google Scholar]
- Ewers M, Sperling RA, Klunk WE, Weiner MW, Hampel H. Neuroimaging markers for the prediction and early diagnosis of Alzheimer’s disease dementia. Trends Neurosci. 2011;34:430–442. doi: 10.1016/j.tins.2011.05.005. [DOI] [PMC free article] [PubMed] [Google Scholar]
- Fagan AM, Mintun MA, Mach RH, Lee SY, Dence CS, Shah AR, LaRossa GN, Spinner ML, Klunk WE, Mathis CA, DeKosky ST, Morris JC, Holtzman DM. Inverse relation between in vivo amyloid imaging load and cerebrospinal fluid Abeta42 in humans. Ann Neurol. 2006;59:512–519. doi: 10.1002/ana.20730. [DOI] [PubMed] [Google Scholar]
- Jack CR, Jr, Wiste HJ, Weigand SD, Knopman DS, Lowe V, Vemuri P, Mielke MM, Jones DT, Senjem ML, Gunter JL, Gregg BE, Pankratz VS, Petersen RC. Amyloid-first and neurodegeneration-first profiles characterize incident amyloid PET positivity. Neurology. 2013;81:1732–1740. doi: 10.1212/01.wnl.0000435556.21319.e4. [DOI] [PMC free article] [PubMed] [Google Scholar]
- Jagust WJ, Bandy D, Chen K, Foster NL, Landau SM, Mathis CA, Price JC, Reiman EM, Skovronsky D, Koeppe RA. The Alzheimer’s Disease Neuroimaging Initiative positron emission tomography core. Alzheimers Dement. 2010;6:221–229. doi: 10.1016/j.jalz.2010.03.003. [DOI] [PMC free article] [PubMed] [Google Scholar]
- Jagust WJ, Landau SM, Alzheimer’s Disease Neuroimaging Initiative Apolipoprotein E, not fibrillar beta-amyloid, reduces cerebral glucose metabolism in normal aging. J Neurosci. 2012;32:18227–18233. doi: 10.1523/JNEUROSCI.3266-12.2012. [DOI] [PMC free article] [PubMed] [Google Scholar]
- Klunk WE. Amyloid imaging as a biomarker for cerebral beta-amyloidosis and risk prediction for Alzheimer dementia. Neurobiol Aging. 2011;32(Suppl 1):S20–S36. doi: 10.1016/j.neurobiolaging.2011.09.006. [DOI] [PMC free article] [PubMed] [Google Scholar]
- Knopman DS, Jack CR, Jr, Wiste HJ. Selective worsening of brain injury biomarker abnormalities in cognitively normal elderly persons with β-amyloidosis. JAMA Neurol. 2013;70:1030–1038. doi: 10.1001/jamaneurol.2013.182. [DOI] [PMC free article] [PubMed] [Google Scholar]
- Knopman DS, Jack CR, Jr, Wiste HJ, Lundt ES, Weigand SD, Vemuri P, Lowe VJ, Kantarci K, Gunter JL, Senjem ML, Mielke MM, Roberts RO, Boeve BF, Petersen RC. 18F-fluorodeoxyglucose positron emission tomography, aging, and apolipoprotein E genotype in cognitively normal persons. Neurobiol Aging. 2014;35:2096–2106. doi: 10.1016/j.neurobiolaging.2014.03.006. [DOI] [PMC free article] [PubMed] [Google Scholar]
- La Joie R, Perrotin A, Barre L, Hommet C, Mezenge F, Ibazizene M, Camus V, Abbas A, Landeau B, Guilloteau D, de La Sayette V, Eustache F, Desgranges B, Chetelat G. Region-specific hierarchy between atrophy, hypometabolism, and beta-amyloid (Abeta) load in Alzheimer’s disease dementia. J Neurosci. 2012;32:16265–16273. doi: 10.1523/JNEUROSCI.2170-12.2012. [DOI] [PMC free article] [PubMed] [Google Scholar]
- Landau SM, Breault C, Joshi AD, Pontecorvo M, Mathis CA, Jagust WJ, Mintun MA, Alzheimer’s Disease Neuroimaging Initiative Amyloid-beta imaging with Pittsburgh compound B and florbetapir: comparing radiotracers and quantification methods. J Nucl Med. 2013;54:70–77. doi: 10.2967/jnumed.112.109009. [DOI] [PMC free article] [PubMed] [Google Scholar]
- Landau SM, Harvey D, Madison CM, Koeppe RA, Reiman EM, Foster NL, Weiner MW, Jagust WJ, Alzheimer’s Disease Neuroimaging Initiative Associations between cognitive, functional, and FDG-PET measures of decline in AD and MCI. Neurobiol Aging. 2011;32:1207–1218. doi: 10.1016/j.neurobiolaging.2009.07.002. [DOI] [PMC free article] [PubMed] [Google Scholar]
- Landau SM, Mintun MA, Joshi AD, Koeppe RA, Petersen RC, Aisen PS, Weiner MW, Jagust WJ, Alzheimer’s Disease Neuroimaging Initiative Amyloid deposition, hypometabolism, and longitudinal cognitive decline. Ann Neurol. 2012;72:578–586. doi: 10.1002/ana.23650. [DOI] [PMC free article] [PubMed] [Google Scholar]
- Lowe VJ, Weigand SD, Senjem ML, Vemuri P, Jordan L, Kantarci K, Boeve B, Jack CR, Jr, Knopman D, Petersen RC. Association of hypometabolism and amyloid levels in aging, normal subjects. Neurology. 2014;82:1959–1967. doi: 10.1212/WNL.0000000000000467. [DOI] [PMC free article] [PubMed] [Google Scholar]
- Luders E, Gaser C, Jancke L, Schlaug G. A voxel-based approach to gray matter asymmetries. Neuroimage. 2004;22:656–664. doi: 10.1016/j.neuroimage.2004.01.032. [DOI] [PubMed] [Google Scholar]
- Mattsson N, Insel PS, Nosheny R, Tosun D, Trojanowski JQ, Shaw LM, Jack CR, Jr, Donohue MC, Weiner MW, Alzheimer’s Disease Neuroimaging Initiative Emerging beta-amyloid pathology and accelerated cortical atrophy. JAMA Neurol. 2014;71:725–734. doi: 10.1001/jamaneurol.2014.446. [DOI] [PMC free article] [PubMed] [Google Scholar]
- Mueller SG, Weiner MW, Thal LJ, Petersen RC, Jack C, Jagust W, Trojanowski JQ, Toga AW, Beckett L. The Alzheimer’s disease neuroimaging initiative. Neuroimaging Clin N Am. 2005;15:869–877. xi–xii. doi: 10.1016/j.nic.2005.09.008. [DOI] [PMC free article] [PubMed] [Google Scholar]
- Muller-Gartner HW, Links JM, Prince JL, Bryan RN, McVeigh E, Leal JP, Davatzikos C, Frost JJ. Measurement of radiotracer concentration in brain gray matter using positron emission tomography: MRI-based correction for partial volume effects. J Cereb Blood Flow Metab. 1992;12:571–583. doi: 10.1038/jcbfm.1992.81. [DOI] [PubMed] [Google Scholar]
- Nosheny RL, Insel PS, Truran D, Schuff N, Jack CR, Jr, Aisen PS, Shaw LM, Trojanowski JQ, Weiner MW. Variables associated with hippocampal atrophy rate in normal aging and mild cognitive impairment. Neurobiol Aging. 2015;36:273–282. doi: 10.1016/j.neurobiolaging.2014.07.036. [DOI] [PMC free article] [PubMed] [Google Scholar]
- Oh H, Habeck C, Madison C, Jagust W. Covarying alterations in Abeta deposition, glucose metabolism, and gray matter volume in cognitively normal elderly. Hum Brain Mapp. 2014;35:297–308. doi: 10.1002/hbm.22173. [DOI] [PMC free article] [PubMed] [Google Scholar]
- Oh H, Mormino EC, Madison C, Hayenga A, Smiljic A, Jagust WJ. β-Amyloid affects frontal and posterior brain networks in normal aging. Neuroimage. 2011;54:1887–1895. doi: 10.1016/j.neuroimage.2010.10.027. [DOI] [PMC free article] [PubMed] [Google Scholar]
- Petersen RC, Aisen P, Boeve BF, Geda YE, Ivnik RJ, Knopman DS, Mielke M, Pankratz VS, Roberts R, Rocca WA, Weigand S, Weiner M, Wiste H, Jack CR., Jr Mild cognitive impairment due to Alzheimer disease in the community. Ann Neurol. 2013;74:199–208. doi: 10.1002/ana.23931. [DOI] [PMC free article] [PubMed] [Google Scholar]
- Petersen RC, Aisen PS, Beckett LA, Donohue MC, Gamst AC, Harvey DJ, Jack CR, Jr, Jagust WJ, Shaw LM, Toga AW, Trojanowski JQ, Weiner MW. Alzheimer’s disease neuroimaging initiative (ADNI): clinical characterization. Neurology. 2010;74:201–209. doi: 10.1212/WNL.0b013e3181cb3e25. [DOI] [PMC free article] [PubMed] [Google Scholar]
- Rousset OG, Ma Y, Evans AC. Correction for partial volume effects in PET: principle and validation. J Nucl Med. 1998;39:904–911. [PubMed] [Google Scholar]
- Rowe CC, Ellis KA, Rimajova M, Bourgeat P, Pike KE, Jones G, Fripp J, Tochon-Danguy H, Morandeau L, O’Keefe G, Price R, Raniga P, Robins P, Acosta O, Lenzo N, Szoeke C, Salvado O, Head R, Martins R, Masters CL, Ames D, Villemagne VL. Amyloid imaging results from the Australian Imaging, Biomarkers and Lifestyle (AIBL) study of aging. Neurobiol Aging. 2010;31:1275–1283. doi: 10.1016/j.neurobiolaging.2010.04.007. [DOI] [PubMed] [Google Scholar]
- Shaffer JL, Petrella JR, Sheldon FC, Choudhury KR, Calhoun VD, Coleman RE, Doraiswamy PM. Predicting cognitive decline in subjects at risk for Alzheimer disease by using combined cerebrospinal fluid, MR imaging, and PET biomarkers. Radiology. 2013;266:583–591. doi: 10.1148/radiol.12120010. [DOI] [PMC free article] [PubMed] [Google Scholar]
- Shaw LM, Vanderstichele H, Knapik-Czajka M, Clark CM, Aisen PS, Petersen RC, Blennow K, Soares H, Simon A, Lewczuk P, Dean R, Siemers E, Potter W, Lee VM, Trojanowski JQ. Cerebrospinal fluid biomarker signature in Alzheimer’s disease neuroimaging initiative subjects. Ann Neurol. 2009;65:403–413. doi: 10.1002/ana.21610. [DOI] [PMC free article] [PubMed] [Google Scholar]
- Tzourio-Mazoyer N, Landeau B, Papathanassiou D, Crivello F, Etard O, Delcroix N, Mazoyer B, Joliot M. Automated anatomical labeling of activations in SPM using a macroscopic anatomical parcellation of the MNI MRI single-subject brain. Neuroimage. 2002;15:273–289. doi: 10.1006/nimg.2001.0978. [DOI] [PubMed] [Google Scholar]
- Villemagne VL, Burnham S, Bourgeat P, Brown B, Ellis KA, Salvado O, Szoeke C, Macaulay SL, Martins R, Maruff P, Ames D, Rowe CC, Masters CL. Amyloid β deposition, neurodegeneration, and cognitive decline in sporadic Alzheimer’s disease: a prospective cohort study. Lancet Neurol. 2013;12:357–367. doi: 10.1016/S1474-4422(13)70044-9. [DOI] [PubMed] [Google Scholar]
- Woo CW, Krishnan A, Wager TD. Cluster-extent based thresholding in fMRI analyses: pitfalls and recommendations. Neuroimage. 2014;91:412–419. doi: 10.1016/j.neuroimage.2013.12.058. [DOI] [PMC free article] [PubMed] [Google Scholar]
- Wyman BT, Harvey DJ, Crawford K, Bernstein MA, Carmichael O, Cole PE, Crane PK, DeCarli C, Fox NC, Gunter JL, Hill D, Killiany RJ, Pachai C, Schwarz AJ, Schuff N, Senjem ML, Suhy J, Thompson PM, Weiner M, Jack CR., Jr Standardization of analysis sets for reporting results from ADNI MRI data. Alzheimers Dement. 2013;9:332–337. doi: 10.1016/j.jalz.2012.06.004. [DOI] [PMC free article] [PubMed] [Google Scholar]
Associated Data
This section collects any data citations, data availability statements, or supplementary materials included in this article.