Abstract
A sensitive indirect competitive nanobody-based enzyme linked immunosorbent assay (Nb-ELISA) for ochratoxin A (OTA) with high resistance to cereal matrix interference was developed. Nanobodies against OTA (Nb15, Nb28, Nb32, Nb36) were expressed in E. coli cells and their thermal stabilities were compared with that of an OTA-specific monoclonal antibody 6H8. All nanobodies could still retain their antigen-binding activity after exposure to temperature 95 °C for 5 min or to 90 °C for 75 min. Nb28 that exhibited the highest sensitivity in ELISA was selected for further research. An indirect competitive ELISA based on Nb28 was developed for OTA, with an IC50 of 0.64 ng/mL and a linear range (IC20-IC80) of 0.27–1.47 ng/mL. Cereal samples were analyzed following a 2.5 fold dilution of sample extracts, showing the good resistance to matrix interference of the Nb-ELSIA. The recovery of spiked cereal samples (rice, oats, barley) ranged from 80% to 105% and the Nb-ELISA results of OTA content in naturally contamined samples were in good agreement with those determined by a commercial ELISA kit. The results indicated the reliablity of nanobody as a promising immunoassay reagent for detection of mycotoxins in food matrix and its potential in biosensor development.
Keywords: nanobody, ochratoxin A, immunoassay, cereal, matrix interference
Introduction
To date, various immuoassays for food contaminants analysis have been reported that are mainly based on monoclonal antibodies [1] and polyclonal antibodies [2]. With the advances in molecular cloning and phage display techniques, numerous recombinant antibodies have been produced, which are also known as genetically modified antibodies [3]. Recombinant antibodies such as fragment of antigen-binding (Fab) and single-chain variable fragment (scFv) have been developed and applied to various assays of mycotoxins [4, 5]. However, the low expression yield and poor stability of these recombinant antibodies limit their development [6, 7].
It was reported that camelids contained a kind of naturally occurring antibody devoid of light chains, which was known as heavy chain antibody (HCAb) [8]. The HCAb still retains excellent antigen-binding activity associated with the variable domain of the heavy chain (VHH) and antigen-specific VHHs are readily obtained after immunization of a camelid, cloning the VHH repertoire from peripheral blood lymphocytes and panning by phage display [9]. Recombinant expression of VHH can produce single domain antibody (sdAb) with dimensions in the nanometer range, which is also known as nanobody (Nb). High expression yield of Nbs can be obtained in various expression systems, such as bacteria, fungi and plants [10–12].
Nbs exhibit good antigen-binding capacity and high physical and thermal stability because of their single domain nature. Compared to the conventional antibody fragments, the evolution of hydrophilic amino acids within framwork 2 of the heavy chain variable domain contributes to the high water solubility of nanobodies [9]. Due to their unique properties, more and more nanobodies for toxic and harmful substances were isolated and used as the detection reagent of immunoassays in food analysis [13, 14]. In addition, Nbs are readily genetically manipulated to construct fusions with green fluorescence protein and alkaline phosphatase [15–17], thus expanding their applications in immunoassay. Since the matrix interference is a very common problem for the immunoassay and conventional antibodies often show a low resistance to matrix interference[18], it will be very interesting to study the resistance to matrix interference of Nbs that has not been reported.
In this study, ochratoxin A (OTA) was selected as model analyte, which is a toxic fungal secondary metabolite mainly produced by several Aspergillus and Penicillium species [19–21]. Four nanobodies against OTA [22] were expressed and we aimed to further evaluate the properties of OTA-specific nanobodies in an immunoassay for food matrix. To explore their potential in biosensors, we also evaluated the physical-chemical properties of nanobodies and compared them with a conventional monoclonal antibody.
Experimental sections
Chemicals and reagents
T4 DNA ligase and restriction enzyme Nco I and Not I were purchased from New England Biolabs, Inc. (Beverly, MA). PfuTurbo Cx Hotstart DNA Polymerase was from Agilent Technologies Inc. (Santa Clara, CA). Chemically competent cells of E. coli DH5α strain and E. coli BL21(DE3)plysS strain, B-PER bacterial protein extraction reagent, HisPur Ni-NTA resin, NuPAGE 12% Bis-Tris gel, and SYPRO Ruby protein gel stain were purchased from Thermo Fisher Scientific Inc. (Waltham, MA). The mouse anti-ochratoxin A monoclonal antibody 6H8 was previously prepared in our laboratory. The rabbit anti-6×his tag polyclonal antibody-HRP conjugate was from Abcam (Cambridge, MA). Ochratoxin A, aflatoxin B1, zearalenone, deoxynivalenol, isopropyl-β-D-1-thiogalactopyranoside (IPTG), 3,3,5,5-teramethylbenzidine (TMB) were from Sigma (St. Louis, MO). Ochratoxin B (OTB) was from Bioaustralis (Smithfield, NSW, Australia). TMB membrane peroxidase substrate was from KPL Inc. (Gaithersburg, MD). The vector pET-25b(+) used for protein expression was purchased from EMD Millipore (Billerica, MA).
Construction of prokaryotic expression vector for nanobodies
The recombinant E. coli TG1 strain containing the pHEN1-VHH plasmid (VHH-15, VHH-28, VHH-32, and VHH-36) was inculated into Luria-Bertani broth with 50 μg/mL carbenicillin, and incubated at 37 °C with shaking at 220 rpm overnight. The harvested bacteria from the culture was used to extract plasmids with a Qiagen miniprep kit (Cat. No.: 27104, Qiagen, Germany). The recombinant plasmid encoding nanobody was constructed according to our previous work [23]. Briefly, the pHEN1-VHH plasmid and pET25b(+) vector were digested with both Nco I and Not I restriction enzymes at 37 °C for 5 h and recovered with a QIAqucik gel extraction kit (Cat. No.: 28704, Qiagen, Germany). VHH fragment was ligated into the pET25b(+) vector at 3:1 molar ratio using T4 DNA Ligase, and then the ligation products were transformed into E. coli DH5α chemically competent cells by heat shock (42 °C, 90 s). The transformed bacteria were spread on Luria-Bertani agar plates containing 50 μg/mL carbenicillin and incubated at 37 °C overnight. The carbenicillin-resistant clones were identified by colony PCR. The recombinant plasmid was extracted as described above, and then subjected to DNA sequencing.
Expression, identification and purification of the nanobodies
Constructed recombinant plasmids were first transformed into the E. coli BL21(DE3)plysS strain. Subsequently, the colonies were cultured in Luria-Bertani medium with 50 μg/mL carbenicillin at 37 °C until the OD600 reached approximately 0.6. The T7 promoter was induced with 0.25 mM IPTG at 30 °C by shaking (250 rpm) overnight. Bacteria cells were harvested from the culture by centrifugation at 5000 g for 10 min, and were resuspended in B-PER Bacterial Protein Extraction Reagent (adding 4 mL of B-PER Reagent per gram of cell pellet) containing DNase I and EDTA-free protease inhibitors. After incubation for 10 min at room temperature, the lysate was centrifuged (15000g, 5 min) to separate supernatant containing the soluble proteins. The presence of nanobodies was detected by both sodium dodecyl sulfate-polyacrylamide gel electrophoresis (SDS-PAGE) and Western blot with rabbit anti-6×his tag IgG-HRP conjugate and TMB membrane peroxidase substrate [16].
The supernatant containing the soluble proteins was first filtered through a 0.22 μm sterile filter (Millipore, USA) and then were loaded onto high-capacity nickel-IMAC resin column for his-tagged fusion protein purification according to the manufacturer’s instruction. Briefly, the column was washed with six resin-bed volumes of wash buffer (10 mM phosphate-buffered saline with 25 mM imidazole, pH 7.4), and then the anti-OTA nanobody was eluted with elution buffer (20 mM phosphate-buffered saline with 100 mM imidazole, pH 7.4). The eluate was dialyzed against PBS at 4 °C for 48 h and the nanobody purity was confirmed by SDS-PAGE. The purified nanobodies were quantified using a NanoDrop Lite (Thermo, USA) and were stored at −20 °C prior to analysis.
Nb-ELISA for OTA
The concentrations of coating antigen (OTA-OVA conjugate) and nanobody were first optimized by a checkerboard titration [22]. The nanobody-based indirect competitive ELISA was performed as follows: a 96-well microplate was coated with OTA-ovalbumin (OVA) conjugate (2 μg/mL, 100 μL/well) in PBS (pH 7.4, 10 mM) and incubated at 4 °C overnight. The plate was blocked with 3% (m/v) skimmed milk powder in PBS (300 μL/well) at 37 °C for 1 h, followed by 3 washes with PBST (PBS, pH 7.4, 10 mM, containing 0.05% Tween-20). A series of concentrations of OTA (0, 0.1, 0.25, 0.5, 1, 2.5, 5 ng/mL in 20% methanol-PBS, 50 μL/well) were added, followed by the addition of equal volume of nanobody diluent (0.1 μg/mL in PBS), and then incubated at 37 °C for 30 min. After five washes with PBST, the plate was incubated with rabbit anti-6×his tag polyclonal antibody-HRP conjugate (0.2 μg/mL in PBS, 100 μL/well) at 37 °C for 30 min and washed again. The plate was incubated with TMB substrate (100 μL/well) at 37 °C for 10 min and the reaction was stopped by adding 2 M H2SO4 (50 μL/well). The intensity of the resulting yellow color was measured at 450 nm on a microtiter plate reader (Molecular Devices, Sunnyvale, CA). The standard curves were established by plotting the value of B/B0 (%) against the OTA concentration, where B is the optical intensity in the presence of OTA or OTA-related analytes and B0 is the optical intensity in their absence.
Cross-reactivity
To determine the selectivity of the Nb-ELISA for OTA, the cross-reactivity (CR) of nanobody Nb28 with an OTA structrual analogue and some common mycotoxins was evaluated by Nb-ELISA. The cross-reactivity was calculated as [IC50 (OTA)/IC50 (tested compound)].
Sample analysis
Cereal samples (rice, oats, barley) for the spiking and recovery study were randomly collected from local markets in Davis, CA. Naturally contaminated cereal samples provided by Dr. Ryu were obtained from different markets and supermarkets in the United States. For Nb-ELISA analysis, samples were prepared and extracted as described by Wang and coworkers [18] with some modifications. Briefly, five grams of rice, oats and barley was weighed and mixed with 50% methanol/water, followed by ultrasound extraction for 20 min. The mixture was centrifuged at 10000g for 10 min, and the supernatant was diluted 1:1.5 with PBS for Nb-ELISA analysis. When the commercial ELISA kit was used for OTA analysis, cereal samples were prepared and tested according to the manufacturer’s instruction (Cat. No.: R1311, R-Biopharm AG, Germany).
Results and discussion
Expression, purification, and identification of the nanobodies
Four kinds of positive recombinant plasmids were transformed into E. coli strain BL21 (DE3) and anti-OTA Nbs were expressed by 0.5 mM IPTG inducing at 30 °C overnight, respectively. The periplasmic proteins were extracted by the B-PER method and identified by SDS-PAGE (Fig. 1A) and Western blot (Fig. 1B), repectively. A band of approximately 17 kDa was detected from the induced cell culture (Lane 2, Fig. 1A) while it was absent in the noninduced cell culture (Lane 1, Fig. 1A). A single 17 kDa band of Nb was present in the Western blot anaysis and no degration products were observed, illustrating the good stability of the Nb.
Fig. 1.
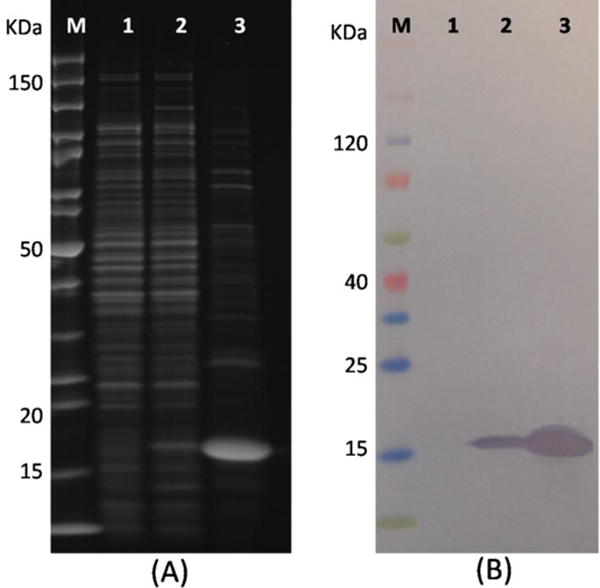
(A) SDS-PAGE analysis of Nb28; (B) Western blot analysis of Nb28. Blots were stained with SYPRO Ruby protein gel stain or incubated with rabbit anti-6×his tag IgG/HRP conjugate and TMB membrane peroxidase substrate. Lane M: PageRuler unstained protein ladder (A) and spectrum multicolor broad-range protein ladder (B). Lane 1: Whole-cell extract under noninduced conditions. Lane 2: Whole-cell extract under induced conditions. Lane 3: Nb28 purified by high-capacity nickel IMAC resin.
Nanobody characterizations
The purified Nbs against OTA (Nb15, Nb28, Nb32, Nb36) were subjected to the indirect competitive ELISA (ic-ELISA) and the standard inhibition curves were established. As shown in Fig. 2, Nb28 exhibited the lowest concentration for 50% inhibition (IC50) by OTA in the ic-ELISA (IC50 = 0.74 ng/mL), and the rest were 105.24, 19.18, 188.92 ng/mL for Nb15, Nb32 and Nb36. The sensitivity differences among the Nbs in the ic-ELISA were similar to the previously reported with phage displayed VHH in phage-ELISA [22].
Fig. 2.
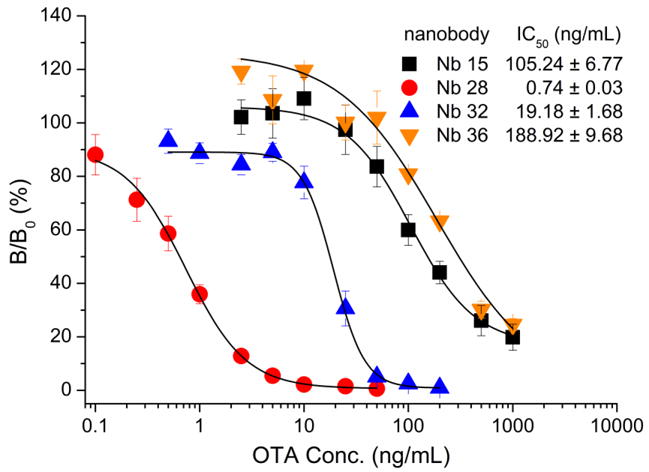
Nb-based indirect competitive ELISA standard curves. The error bars represent the standard deviation (n = 3).
In addition, the binding affinity of Nbs to the OTA-OVA conjugate was measured using a bio-layer interferometry-based BLItz system (ForteBio, Menlo Park, CA) [17]. This is a label-free biosensor which can offer a direct and realistic depiction of molecular interactions by real-time kinetic measurements. As shown in Fig. 3, Nb28 had the highest ka of 2.039 × 10⁸ M−1S−1 and the lowest kd of 7.916 × 10⁻³ S−1 to OTA-OVA conjugate which led to its strongest affinity (KD = 0.039 nM). A positive correlation was also found between Nb sensitivity (IC50) and its affinity to target antigen (KD) (Fig. 2 and Fig. 3).
Fig. 3.
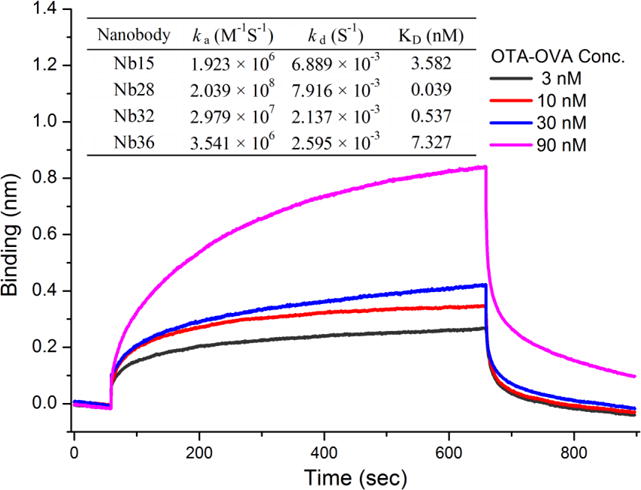
Binding kinetics of Nb15 to the OTA-OVA conjugate. Nbs (25 μg/mL) were immobilized onto the Ni-NTA biosensor (Cat. No.: 18-5101, ForteBio, CA) tips through the 6 × His tag. Then the probe was incubated with OTA-OVA conjugate at different concentrations (3, 10, 30, 90 nM) to determine the corresponding association and dissociation profiles of Nbs. Interferometry data were globally fit to a 1:1 binding model calculating the rate constants (ka and kd) and equilibrium dissociation constant KD (KD = kd/ka). The embedded table includes the value of ka, kd, KD for nanobodies (Nb15, Nb28, Nb32, Nb36) to the OTA-OVA conjugate.
To characterize how the anti-OTA Nbs perform compared to a mouse monoclonal antibody (mAb 6H8), temperature stability of these antibodies was evaluated as described by Bever and coworkers [14] with some modifications. Briefly, antibodies were diluted to working conditions (data not shown) and were heated to different temperatures (25, 50, 65, 80, 95 °C) for 5 min and to 90 °C for increasing times (0, 5, 15, 30, 45, 60, 75 min). The antibody samples were cooled to RT, followed by the evaluation of their binding capacity to the OTA-OVA conjugate as coating antigen in the Nb-ELISA. As shown in Fig. 4A, the binding activity of mAb 6H8 gradually decreased as the temperature increased and mAb 6H8 completely lost its activity at 80 °C for 5 min. However, all Nbs retained greater than 45% of their binding activity when exposed to 95 °C for 5 min. To further verify this, Nbs and mAb 6H8 were subjected to heating at 90 °C for various time (Fig. 4B). After incubation at 90 °C for 5 min, all Nbs retained no less than 45% of their activity while mAb 6H8 lost its activity completely. Besides, nanobodies Nb15, Nb28, Nb32 and Nb36 retained approximately 25%, 25%, 50% and 45% of their activity when heated at 90 °C for 75 min, respectively.
Fig. 4.
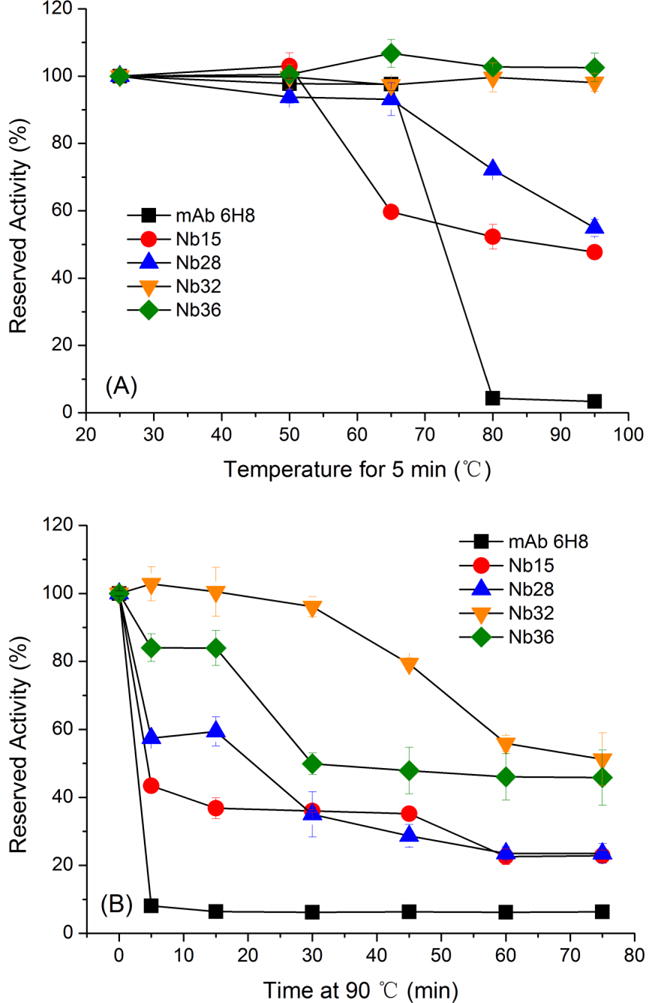
Temperature stability of OTA-specific nanobodies Nb15, Nb28, Nb32, Nb36 and mAb 6H8. Nanobodies and mAb 6H8 were diluted to working conditions and incubated at increasing temperatures (25, 50, 65, 80, 95 °C) for 5 min (A) or at 90 °C for increasing times (0, 5, 15, 30, 45, 60, 75 min). After re-equilibated to RT, their reserved activity was determined by Nb-ELISA. The error bars represent the standard deviation (n = 3).
Matrix effects analysis
Nb28 which showed the highest sensitivity in the ic-ELISA (Fig. 2) was selected for the development of the Nb-ELISA. A standard competitive inhibition curve for OTA Nb-ELISA was constructed under the optimal conditions (Fig. 5). The standard curve exhibited a limit of detection (IC10) of 0.16 ng/mL and a linear correlation coefficient square R2 of 0.9998. The assay has a linear detection range (IC20–IC80) of 0.27–1.47 ng/mL and an IC50 of 0.64 ng/mL.
Fig. 5.
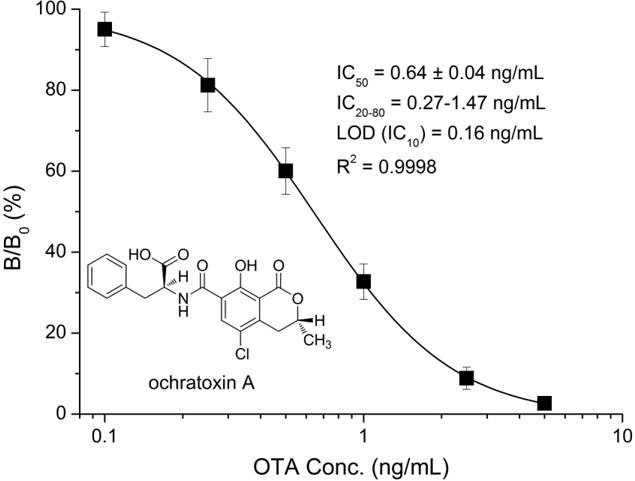
Standard competitive inhibition curve for OTA Nb-ELISA under the optimized conditions. The error bars represent the standard deviation (n = 6).
The elimination of matrix effect is a main challenge of food analysis by immunoassay. Dilution of sample extract is commonly used to minimize matrix interference while a high dilution can cause lower assay sensitivity. Cereal samples (rice, oats and barley) that were found to be free of OTA by LC-MS/MS in our previous work [16] were subjected to matrix effects analysis. Diluted sample extract was used to prepare serial concentrations of OTA solution containing 20% methanol for Nb-ELISA. As seen in Fig. 6A, assays were carried out using the above OTA standard solution. There was no significant shift of the IC50 and ODmax values in assays with diluted matrix extracts compared to those in assays with assay buffer, showing the good tolerance of Nb28 against matrix interference. The mouse anti-OTA mAb 6H8 was used to replace Nb28 to perform the ELISA under the same conditions. As shown in Fig. 6B, 30-fold dilution of extracts from rice and barley and 50-fold dilution of extracts from oats were required to eliminate the sample matrix interference, thus demostrating that Nbs have a higher resistance to sample matrix interference than conventional antibodies. The dilution factor ×2.5 was selected to eliminate the sample matrix interference in Nb-ELISA, which was much lower than that of conventional antibody-based ELISA for OTA in food matrix [18]. The final sensitivity (LOD) and IC50 of Nb-ELISA under these conditions was 0.8 and 3.2 μg/kg, with a linear range of 1.35–7.35 μg/kg, which can meet the requirement of regulatory limits for OTA (5μg/kg) in the EU [24].
Fig. 6.
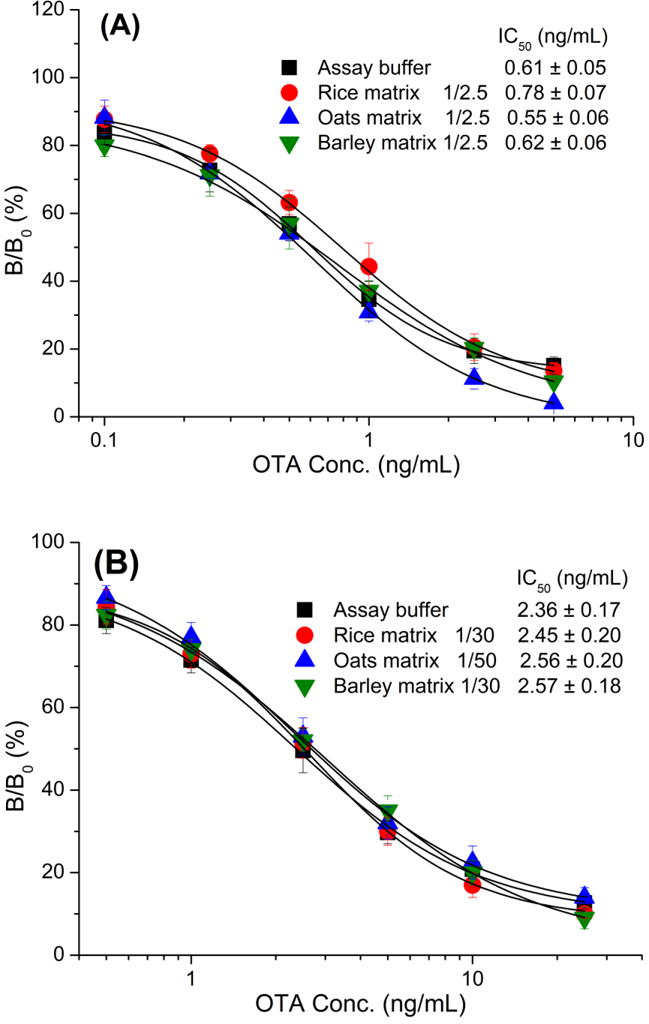
Standard curves of Nb-ELISA (A) and mAb-based ELISA (B) for OTA in rice, oats and barley samples after appropriate extration and dilution. Each assay was carried out in triplicate.
Sample analysis and validation
To evaluate the effectiveness of the Nb-ELISA in sample analysis, cereal samples spkied with serial concentrations of OTA (5, 15, 25 μg/kg of cereal sample) were subjected to Nb-ELISA. For intra-assay, the average recovery rate of OTA ranged from 80% to 105% and the relative standard deviation (RSD) was in a range of 0.01–0.09 (Table 1). For inter-assay, the recovery and RSD ranged from 85% to 99% and from 0.05 to 0.06, respectively (Table 1). Eight cereal samples naturally contaminated OTA tested in our previous work [16] were analyzed by Nb-ELISA and commercial ELISA kit, respectively. As seen in Table 2, the OTA content in samples tested by above two methods were in good agreement with each other. In addition, the contents of OTA in oats sample 1 and 4 were beyond the maximum limit for OTA in cereal products (3 μg/kg). The results indicated the good accuracy and precision of Nb-ELISA for OTA detection.
Table 1.
Recoveries of OTA from the spiked cereal samples by Nb-ELISA
| Sample matrix | OTA spiked (μg/kg) | Mean ± SD (μg/kg) | Recovery (%) | RSD (%) |
|---|---|---|---|---|
| Intra-assay (n = 3)a | ||||
| rice | 5 | 5.12 ± 0.18 | 102 | 4 |
| 15 | 12.17 ± 0.15 | 81 | 1 | |
| 25 | 21.32 ± 0.96 | 85 | 5 | |
| oats | 5 | 5.42 ± 0.25 | 108 | 5 |
| 15 | 13.13 ± 0.43 | 88 | 3 | |
| 25 | 20.05 ± 0.81 | 80 | 4 | |
| barley | 5 | 5.24 ± 0.15 | 105 | 3 |
| 15 | 12.44 ± 0.93 | 83 | 8 | |
| 25 | 20.44 ± 1.77 | 82 | 9 | |
| Inter-assay (n = 6)b | ||||
| rice | 5 | 4.97 ± 0.32 | 99 | 6 |
| 15 | 12.77 ± 0.67 | 85 | 5 | |
| 25 | 21.53 ± 1.02 | 86 | 5 | |
Each assay was performed in three replicates on the same day.
The assays were performed on six different days.
Table 2.
Analysis of OTA content in cereal samples
| Sample | Nb-ELISA (μg/kg ± SD, n = 3) | RSD (%) | Commercial ELISA kit (μg/kg ± SD, n = 3) | RSD (%) |
|---|---|---|---|---|
| rice | ||||
| 1 | 1.36 ± 0.16 | 9 | 1.18 ± 0.09 | 8 |
| 2 | 1.79 ± 0.09 | 5 | 1.50 ± 0.13 | 9 |
| 3 | 1.91 ± 0.10 | 5 | 1.41 ± 0.16 | 5 |
| oats | ||||
| 1 | 4.12 ± 0.34 | 12 | 5.67 ± 0.52 | 9 |
| 2 | 1.13 ± 0.13 | 8 | 1.17 ± 0.07 | 6 |
| 3 | 2.68 ± 0.10 | 4 | 1.57 ± 0.17 | 6 |
| 4 | 6.74 ± 0.79 | 12 | 8.34 ± 0.42 | 5 |
| barley | ||||
| 1 | 1.87 ± 0.15 | 8 | 2.90 ± 0.21 | 7 |
Conclusions
We developed a sensitive and selective immunoassay with a Nb for OTA detection in cereal. Taking OTA as model antigen, this work illustrates the unique advantages of Nb in analysis of small molecules. It costs much less to develop and produce Nbs than monoclonal antibodies by hybridoma techniques. As demonstrated here, the Nb showed a better thermal stability than a classical antibody. The thermal stability is thought in part due to a disulfide bond between complementarity determining region (CDR) one and CDR three [9]. What’s more, the Nb also showed a higher resistance to cereal matrix interference than conventional antibody in ELISA, which performed better than VHH-phage and Nb-AP fusion in our previous work [16, 22]. This unique property of Nb can effectively avoid false negative results in sample screening. In summary, this work reveals the special performance of the Nb in a colorimetric immunoassay for OTA detection in cereal matrix and also its potential for biosensor development that requires good tolerance to harsh environment.
Supplementary Material
Highlights.
Nanobodies can well replace conventional antibodies in immunoassay for the detection of small molecular weight compounds.
A nanobody-based ELISA for OTA with high resistance to matrix interference was developed.
A possible approach to produce antibodies with improved specificity was proposed.
The binding kinetics of nanobodies to ochratoxin A was tested with a bio-layer interferometry-based BLItz system.
Acknowledgments
This work was financially supported by the Scientific Research Foundation of Hainan University [grant number kyqd1631] and the Academic Innovation Project for Youth Science Talents, Hainan Provincial Association for Science and Technology [grant number 201504]. Partial support was provided by the NIEHS Superfund Research Program [grant number P42 ES04699] and Guangxi talent highland of preservation and deep processing research in fruit and vegetables.
Footnotes
Publisher's Disclaimer: This is a PDF file of an unedited manuscript that has been accepted for publication. As a service to our customers we are providing this early version of the manuscript. The manuscript will undergo copyediting, typesetting, and review of the resulting proof before it is published in its final citable form. Please note that during the production process errors may be discovered which could affect the content, and all legal disclaimers that apply to the journal pertain.
References
- 1.Yu FY, Vdovenko MM, Wang JJ, Sakharov IY. J Agri Food Chem. 2011;59:809–813. doi: 10.1021/jf103261u. [DOI] [PubMed] [Google Scholar]
- 2.Liu X, Xu Y, He Q, He Z, Xiong Z. J Agri Food Chem. 2013;61:4765–4770. doi: 10.1021/jf400056p. [DOI] [PubMed] [Google Scholar]
- 3.Zeng X, Shen Z, Mernaugh R. Anal Bioanal Chem. 2012;402:3027–3038. doi: 10.1007/s00216-011-5569-z. [DOI] [PMC free article] [PubMed] [Google Scholar]
- 4.Min WK, Kim SG, H J. Seo, Food Chem. 2015;188:604–611. doi: 10.1016/j.foodchem.2015.04.117. [DOI] [PubMed] [Google Scholar]
- 5.Arola HO, Tullila A, Kiljunen H, Campbell K, Siitari H, Nevanen TK. Anal Chem. 2016;88:2446–2452. doi: 10.1021/acs.analchem.5b04591. [DOI] [PubMed] [Google Scholar]
- 6.Wörn A, Plückthun A. J Mol Biol. 2001;305:989–1010. doi: 10.1006/jmbi.2000.4265. [DOI] [PubMed] [Google Scholar]
- 7.Glockshuber R, Malia M, Pfitzinger I, Plückthun A. Biochem. 1990;29:1362–1367. doi: 10.1021/bi00458a002. [DOI] [PubMed] [Google Scholar]
- 8.Hamers-Casterman C, Atarhouch T, Muyldermans S, Robinson G, Hamers C, Songa EB, Bendahman N, Hamers R. Nature. 1993;363:446–448. doi: 10.1038/363446a0. [DOI] [PubMed] [Google Scholar]
- 9.Maass DR, Sepulveda J, Pernthaner A, Shoemaker CB. J Immunol Methods. 2007;324:13–25. doi: 10.1016/j.jim.2007.04.008. [DOI] [PMC free article] [PubMed] [Google Scholar]
- 10.Ta DT, Redeker ES, Billen B, Reekmans G, Sikulu J, Noben JP, Guedens W, Adriaensens P. Protein Eng Des Sel. 2015;28:351–363. doi: 10.1093/protein/gzv032. [DOI] [PubMed] [Google Scholar]
- 11.Mizukami M, Tokunaga H, Onishi H, Ueno Y, Hanagata H, Miyazaki N, Kiyose N, Ito Y, Ishibashi M, Hagihara Y, Arakawa T, Miyauchi A, Tokunaga M. Protein Expres Puri. 2015;105:23–32. doi: 10.1016/j.pep.2014.09.017. [DOI] [PubMed] [Google Scholar]
- 12.Ghannam A, Kumari S, Muyldermans S, Abbady AQ. Plant Mole Biol. 2015;87:355–369. doi: 10.1007/s11103-015-0282-5. [DOI] [PubMed] [Google Scholar]
- 13.He T, Wang Y, Li P, Zhang Q, Lei J, Zhang Z, Ding X, Zhou H, Zhang W. Anal Chem. 2014;86:8873–8880. doi: 10.1021/ac502390c. [DOI] [PubMed] [Google Scholar]
- 14.Bever CRS, Majkova Z, Radhakrishnan R, Suni I, Mccoy M, Wang Y, Dechant J, Gee SJ, Hammock BD. Anal Chem. 2014;86:7875–7882. doi: 10.1021/ac501807j. [DOI] [PMC free article] [PubMed] [Google Scholar]
- 15.Li T, Bourgeois JP, Celli S, Glacial F, Le SA, Mecheri S, Weksler B, Romero I, Couraud PO, Rougeon F, Lafaye P. FASEB J. 2012;26:3969–3979. doi: 10.1096/fj.11-201384. [DOI] [PubMed] [Google Scholar]
- 16.Liu X, Xu Y, Wan D, Xiong Y, He Z, Wang X, Gee SJ, Ryu D, Hammock BD. Anal Chem. 2015;87:1387–1394. doi: 10.1021/ac504305z. [DOI] [PMC free article] [PubMed] [Google Scholar]
- 17.Shu M, Xu Y, Liu X, Li Y, He Q, Tu Z, Fu J, Gee SJ, Hammock BD. Anal Chim Acta. 2016;924:53–59. doi: 10.1016/j.aca.2016.03.053. [DOI] [PubMed] [Google Scholar]
- 18.Wang XH, Liu T, Xu N, Zhang Y, Wang S. Anal Bioanal Chem. 2007;389:903–911. doi: 10.1007/s00216-007-1506-6. [DOI] [PubMed] [Google Scholar]
- 19.Bayman P, Baker JL, Doster MA, Michailides TJ, Mahoney NE. Appl Environ Microb. 2002;68:2326–2329. doi: 10.1128/AEM.68.5.2326-2329.2002. [DOI] [PMC free article] [PubMed] [Google Scholar]
- 20.Joosten HMLJ, Goetz J, Pittet A, Schellenberg M, Bucheli P. Int J Food Microbiol. 2001;65:39–44. doi: 10.1016/s0168-1605(00)00506-7. [DOI] [PubMed] [Google Scholar]
- 21.Esteban A, Abarca ML, Bragulat MR, Cabañes FJ. Res Microbiol. 2004;155:861–866. doi: 10.1016/j.resmic.2004.07.002. [DOI] [PubMed] [Google Scholar]
- 22.Liu X, Xu Y, Xiong Y, Tu Z, Li Y, He Z, Qiu Y, Fu J, Gee SJ, Hammock BD. Anal Chem. 2014;86:7471–7477. doi: 10.1021/ac501202d. [DOI] [PMC free article] [PubMed] [Google Scholar]
- 23.Shu M, Xu Y, Wang D, Liu X, Li Y, He Q, Tu Z, Q Y, Ji Y, Wang X. Talanta. 2015;143:388–393. doi: 10.1016/j.talanta.2015.05.010. [DOI] [PubMed] [Google Scholar]
- 24.European Commission Regulation 1881/2006 of December 19, 2006 in regards to ochratoxin A. L364, 5-24.
Associated Data
This section collects any data citations, data availability statements, or supplementary materials included in this article.


