

Abstract
Recent advancements in sequencing technology have led to a drastic reduction in genome sequencing costs. This development has generated an unprecedented amount of data that must be stored, processed, and communicated. To facilitate this effort, compression of genomic files has been proposed. Specifically, lossy compression of quality scores is emerging as a natural candidate for reducing the growing costs of storage. A main goal of performing DNA sequencing in population studies and clinical settings is to identify genetic variation. Though the field agrees that smaller files are advantageous, the cost of lossy compression, in terms of variant discovery, is unclear.
Bioinformatic algorithms to identify SNPs and INDELs use base quality score information; here, we evaluate the effect of lossy compression of quality scores on SNP and INDEL detection. Specifically, we investigate how the output of the variant caller when using the original data differs from that obtained when quality scores are replaced by those generated by a lossy compressor. Using gold standard genomic datasets and simulated data, we are able to analyze how accurate the output of the variant calling is, both for the original data and that previously lossily compressed. We show that lossy compression can significantly alleviate the storage while maintaining variant calling performance comparable to that with the original data. Further, in some cases lossy compression can lead to variant calling performance that is superior to that using the original file. We envisage our findings and framework serving as a benchmark in future development and analyses of lossy genomic data compressors.
Keywords: Genomic data; lossy compression; quality scores; variant calling
Introduction
Recent advancements in Next Generation high-throughput Sequencing (NGS) have led to a drastic reduction in the cost of sequencing a genome (http://www.genome.gov/sequencingcosts/). This has generated an unprecedented amount of genomic data that must be stored, processed, and transmitted. To facilitate this effort, data compression techniques that allow for more efficient storage as well as fast exchange and dissemination of these data have been proposed in the literature.
Genome sequencing files, such as FASTQ and SAM/BAM, are mainly composed of nucleotide sequences (called reads) and quality scores that indicate the reliability of each of the nucleotides. According to SAM file specifications [1] the quality scores are stored using the Phred score, which corresponds to the number Q = −10 log10P (rounded to the closest integer), where P indicates the probability that the corresponding nucleotide in the read is in error. These scores are commonly represented using the ASCII alphabet [33: 73] or [64: 104], where the value corresponds to Q + 33 or Q + 64, respectively.
When losslessly compressed, quality scores comprise more than half of the compressed file [2]. In addition, it has been shown that the quality scores are inherently noisy [2] and downstream applications that use them do so in a heuristic manner. For these reasons, lossy compression of quality scores has been proposed to further reduce the storage requirements at the cost of introducing a distortion (i.e., the reconstructed quality scores may differ from the original ones).
Several lossy compressors of quality scores have been proposed in the recent literature. These lossy compressors can be divided into two categories depending on whether or not they use biological information (e.g., the reads) for compression. While the majority of the proposed algorithms do not rely on such side information (see the survey on lossy compressors described in [3]), examples of compressors that do are in [4–6]. Further, the lossy compressors that do not use biological information for compression can be divided into two categories; those that compress the quality scores read by read independently of the rest of the data (e.g., [2] and [7]), and those that compress the quality scores using some statistics computed on all or part of the data (see for example [3]). Figure 1 shows a diagram, following the above distinction, of the different methods proposed in the literature for the compression of quality scores, together with some of the most representative algorithms.
Figure 1.

Summary of the different methods for lossy compression of quality scores proposed in the literature.
We focus on those lossy compressors that use only the quality scores for compression, as it would be too difficult to draw conclusions about the underlying source that generates the quality scores from analyzing algorithms like [5], where the lossy compression is done mainly using the information from the reads. Moreover, these read-based lossy compressors of quality scores provide (or need to compute) a corpus to perform the lossy compression, which yields huge memory requirements (usually more than 32 GB of memory are needed to run these algorithms). This corpus is normally computed based on a known reference, several data from the same species, or known SNP sites. Thus, these tools are usually tailored to excel when the data is used for variant calling, at the cost of huge memory requirements. Note also that in these cases it is not possible to specify a rate or a distortion to be minimized. More importantly, read-based lossy compressors can suffer of reference-variability, as they might be using data from the same individual in the “training” (corpus generation) and the test set (the data being compressed). Thus, these tools need to be used very carefully in order to avoid over fitting when reporting results.
Traditionally, lossy compressors have been analyzed in terms of their rate-distortion performance. Such analysis provides a yardstick for comparison of lossy compressors of quality scores that is oblivious to the multitude of downstream applications, which use the quality scores in different ways. However, the data compressed is used for biological inference. Researchers are thus more interested in understanding the effect that the distortion introduced in the quality scores has on the subsequent analysis performed on the data.
To date, there is not a standard practice on how this analysis should be performed. Proof of this is the variety of analyses presented in the literature when a new lossy compressor for quality scores is introduced (see [3, 5, 7, 8] and references therein). Moreover, it is not yet well understood how lossy compression of quality scores affects the downstream analysis performed on the data. This can be understood not only by the lack of a standard practice, but also by the variety of applications that exist and the different manner in which they use quality scores. In addition, the fact that lossy compressors can work at different rates and be optimized for several distortion metrics make the analysis more challenging. However, such an analysis is important if lossy compression is to become a viable mode for coping with the surging requirements of genomic data storage.
With this in mind, in this work we propose a methodology to analyze how lossy compression of quality scores affects the output of one of the most widely used downstream applications: variant calling, which compromises Single Nucleotide Polymorphism (SNP) and Insertion and Deletion (INDEL) calling. Furthermore, we use the proposed methodology to compare the performance of the recently proposed lossy compressors for quality scores, which to our knowledge is the first in depth comparison available in the literature.
For the study, we compare the output of the variant caller when the quality scores of the original (uncompressed) data are replaced by the reconstructed ones. Specifically, for SNP calling we use the human dataset NA12878, which has been thoroughly characterized by GIAB [9], and for which a gold standard (consensus of SNPs) is available. To evaluate the effect of lossy compression on INDEL identification, we simulated genomes that contain biologically realistic SNPs and INDELs, creating a ground truth dataset. We then computationally generated sequencing reads for these genomes. In the following we assume these INDELs and the SNPs of the gold standard are the true ones and refer to them as the “ground truth”. This allows us to analyze which lossy compressor, distortion metric and rate produces the more accurate set of variants. We also show that in some cases applying lossy compression to the quality scores instead of lossless compression results in a set of variants that is more accurate. This suggests that lossy compression of quality scores can be beneficial not only for compression, but also to improve the inference performed on the data. The results presented in the manuscript also provide insight into the characteristics that a lossy compressor should have so that the reconstructed quality scores from which the set of variants is inferred do not differ much from those called based on the original quality scores.
We hope the methodology for variant calling analysis presented in this work will be of use in the future when introducing new lossy compressors. We leave the extensions of the investigations presented herein to other downstream applications for future work.
Methodology for variant calling
In this section we describe the methods used to test the effect of lossy compressors on variant calling. The methodologies suggested for SNPs and INDELs differ, and thus we introduce each of them separately.
SNP calling
Based on the most recent literature that compares different SNP calling pipelines ([10–14]) we have selected three pipelines for our study. Specifically, we propose the use of: (i) the SNP calling pipeline suggested by the Broad Institute, which uses the Genome Analysis Toolkit (GATK) software package [15–17]; (ii) the pipeline presented in the High Throughput Sequencing LIBrary (htslib.org), which uses the Samtools suite developed by The Wellcome Trust Sanger Institute [18]; and (iii) the recently proposed variant caller named Platypus developed by Oxford University [19]. In the following we refer to these pipelines as GATK (https://www.broadinstitute.org/gatk/guide/best-practices), htslib.org (More commonly referred to as samtools. http://www.htslib.org/workflow) and Platypus, respectively.
In all pipelines we use BWA-mem [20] to align the FASTQ files to the reference (NCBI build 37, in our case), as stated in all best practices. For specific steps and the respective commands we refer the reader to the Supplementary Data.
Regarding the GATK pipeline, we note that the best practices recommends to further filter the variants found by the Haplotype Caller by either applying the Variant Quality Score Recalibration (VQSR) or the Hard Filter. The VQSR filter is only recommended if the data set is big enough (more than 100K variants), since otherwise one of the steps of the VQSR, the Gaussian mixture model, may be inaccurate. Therefore, in our analysis we consider the use of both the VQSR and the Hard Filter after the Haplotype Caller, both as specified in the best practices.
INDEL detection
To evaluate the effect of lossy compression of base quality scores on INDEL calling, we employ popular INDEL detection pipelines: Dindel [21], Unified Genotyper, Haplotype Caller [15–17] and Freebayes [22]. First, reads were aligned to the reference genome, NCBI build 37, with BWA [20]. We replaced the quality scores of the corresponding SAM/BAM file by those obtained after applying various lossy compressors, and then we performed the INDEL calling with each of the four tools. The Supplementary Data contains the detailed description of the commands necessary to run each pipeline. Note that several of these pipelines can be used to call both SNPs and INDELs, but the commands or parameters are different for each variant type.
Datasets for SNP calling
A crucial part of the analysis is the ground truth, as it serves as the baseline for comparing the performance of the different lossy compressors against the lossless case. Thus, for the SNP calling analysis, we consider datasets from the H. Sapiens individual NA12878, for which two “ground truth” of SNPs have been released. In particular, we consider the datasets ERR174324 and ERR262997, which correspond to a 15×-coverage pair-end WGS dataset and a 30×-coverage pair-end WGS dataset, respectively. For each of them we extracted the chromosomes 11 and 20. The decision of extracting some chromosomes was made to speed up the computations. We chose chromosome 20 because it is the one normally used for assessment (http://gatkforums.broadinstitute.org/discussion/1213/whats-in-the-resource-bundle-and-how-can-i-get-it), and chromosome 11 as a representative of a longer chromosome. Regarding the two “ground truths”, they are the one released by the Genome in a Bottle consortium (GIAB) [8], which has been adapted by the National Institute of Standardizations and Technology (NIST); and the ground truth released by Illumina as part of the Platinium Genomes project (http://www.illumina.com/platinumgenomes). Figure 2 summarizes the differences between the two. As can be observed, most of the SNPs contained in the NIST ground truth are also included in Illumina's ground truth, for both chromosomes. Note also that the number of SNPs on chromosome 20 is almost half of chromosome 11, for both “ground truths” (As is clear from the discussion in this subsection, the term ground truth should be taken with a grain of salt and as such should appear in quotation marks throughout. We omit these marks henceforth for simplicity.).
Figure 2.
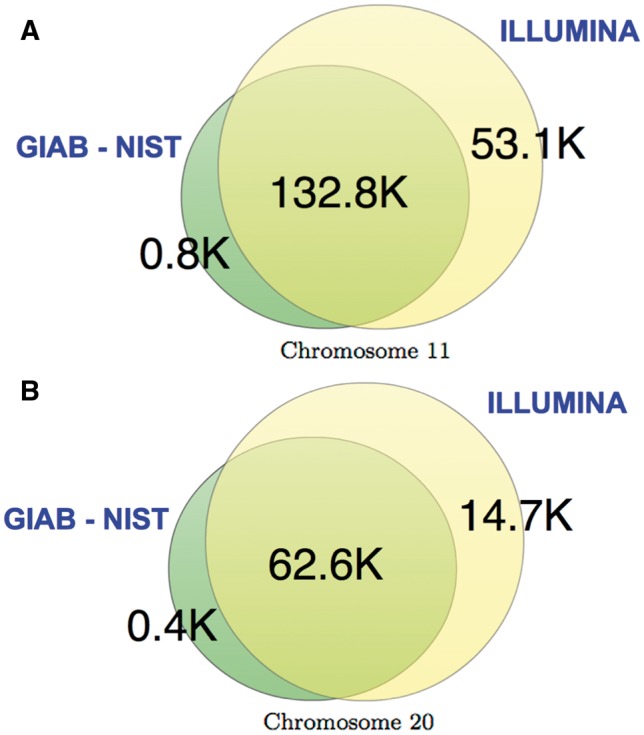
Difference between the GIAB NIST “ground truth” and the one from Illumina, for (A) chromosome 11 and (B) chromosome 20.
Datasets for INDEL detection
To evaluate the effect of lossy compression on INDEL detection, we simulated four datasets. Each dataset was composed of one chromosome with approximately 3000 homozygous INDELs. To mimic biologically realistic variants, we generated distributions of INDEL sizes and frequencies, and insertion to deletion ratios, all conditioned on location (coding vs non-coding) using the Mills and 1000Genomes INDELs provided in the GATK bundle. We drew from these distributions to create our simulated data.
We generated ∼30× coverage of the chromosome with 100bp paired-end sequencing reads (using an Illumina-like error profile) for these simulated datasets using ART [23].
Performance metrics
The output of each of the pipelines is a VCF file [24], which contains the set of the called variants. We can compare these variants with those contained in the ground truth. True Positives (T.P.) refer to those variants contained both in the VCF file under consideration and the ground truth (a match in both position and genotyping must occur for the call to be declared T.P for SNP, while for INDELs the criteria were more lenient: any INDEL within 10bp of the true location was considered a T.P., methods similar to [13]); False Positives (F.P.) refer to variants contained in the VCF file but not in the ground truth; and False Negatives (F.N.) correspond to variants that are present in the ground truth dataset but not in the VCF file under consideration. The more T.P. (or equivalently the fewer F.N.) and the fewer F.P. the better. To evaluate the impact of lossy compression on variant calling, we compare the number of T.P. and F.P. from various lossy compression approaches to the number of T.P. and F.P. obtained from lossless compression. Ideally, we would like to apply a lossy compressor to the quality scores, such that the resulting file is smaller than that of the losslessly compressed, while obtaining a similar number of T.P. and F.P. We will show that not only is this possible, but that in some cases we can simultaneously obtain more T.P. and fewer F.P than with the original data.
To analyze the performance of the lossy compressors on the proposed pipelines, we employ the widely used metrics sensitivity and precision, which include in their calculation the true positives, false positives and false negatives, as described below:
- Sensitivity: measures the proportion of all the positives that are correctly called, computed as .
- Precision: measures the proportion of called positives that are true, computed as .
Depending on the application, one may be inclined to boost the sensitivity at the cost of slightly reducing the precision, in order to be able to find as many T.P. as possible. Of course, there are also applications where it is more natural to optimize for precision than sensitivity. In an attempt to provide a measure that combines the previous two, we also calculate the f-score:
- F-score: the harmonic mean of the sensitivity and precision, computed as .
In the discussion above we have considered that all the variants contained in a VCF file are positive calls. However, another approach is to consider only the subset of variants in the VCF file that satisfy a given constraint to be positive calls. In general, this constraint consists of having the value of one of the parameters associated with a variant above a certain threshold. This approach is used to construct the well-known Receiver Operating Curves (ROC). In the case under consideration, the ROC curve shows the performance of the variant caller as a classification problem. That is, it shows how well the variant caller differentiates between true and false variants when filtered by a certain parameter. Specifically, it plots the False Positive Rate (F.P.R.) versus the True Positive Rate (T.P.R.) (also denoted as sensitivity) for all thresholding values. Given an ROC plot with several curves, a common method for comparing them is by calculating the area under the curve (AUC) of each of them, such that larger AUCs are better.
There are several drawbacks with this approach. The main one, in our opinion, relates to how to compare the AUC of different VCF files. Note that in general, different VCF files contain a different number of calls. Thus, it is not informative to compute the ROC curve of each VCF file independently, and then compare the respective AUCs. A more rigorous comparison can be performed by forcing all the VCF files under consideration to contain the same number of calls. This can be achieved by computing the union of all the calls contained in the VCF files, and adding to each VCF file the missing ones, such that they all contain the same number of calls. In [5] they followed this approach to perform pair-wise comparisons. However, this does not scale very well for a large number of VCF files. Moreover, after performing the analysis, if one more VCF file is generated, all the AUC files must be re-computed (assuming the new VCF file contains at least a call not included in the previous ones). The other main drawback that we encountered relates to the selection of the thresholding parameter. For instance, in SNP calling, when using the GATK pipeline, the QD (Quality by Depth) field is as valid a parameter as the QUAL field. Different choices of the thresholding parameters, result in different AUCs, as shown in the Supplementary Data. Given the above discussion, we believe that this approach is mainly suitable to analyze the VCF files that contain a clear thresholding parameter, like those VCF files obtained by the GATK pipeline after applying the VQSR filter, since in this case there is a clear parameter to be selected, namely the VQSLOD.
Lossy compressors
To our knowledge, and based on the results presented in [3], RBlock, PBlock [7] and QVZ [3] are the algorithms that perform better among the existing lossy compressors that solely use the quality scores to compress. Therefore, those are the algorithms that we consider for our study. In addition, we consider Illumina's proposed binning (http://www.illumina.com/documents/products/whitepapers/whitepaper_datacompression.pdf), which is implemented both by DSRC2 [25] and CRAM [26]. In the Results section we refer to the performance of DSRC2. Next, we describe the aforementioned lossy compressors in more detail.
P/R-Block
The PBlock and RBlock algorithms were introduced in [7]. Both algorithms represent quality scores by separating them into blocks of variable size, such that all the quality scores contained in a block can be replaced by the same representative value without violating a given distortion constraint. The algorithms then store for each block its length and the representative value, which are losslessly compressed. What differs between the algorithms is the distortion constraint, that we specify next.
Given a block of quality scores, Qmax and Qmin denote the largest and smallest quality scores within the block, respectively. In PBlock, the quality scores contained in a block should satisfy Qmax - Qmin ≤ 2p, where p is a user specified parameter. On the other hand, in RBlock the quality scores contained in a block should satisfy Qmax/Qmin ≤ r2, where r is a user specified parameter.
The main difference between the two algorithms is related to the maximum absolute distance allowed between a quality score and its representative (the new quality score). Whereas in PBlock this distance is constant for every quality score, in RBlock a low quality score will in general be closer to its representative than a high quality score. That is, the algorithm is more precise in representing low quality scores than high ones. Finally, note that in both algorithms the maximum absolute distance between a quality score and its representative is controlled by the user.
QVZ - Quality Values Zip
QVZ was introduced in [3], and it allows the user to choose the rate and the distortion to be minimized (the built in distortions are Mean Square Error (MSE), Lorentzian and L1). QVZ assumes a Markov model of order 1 for compression, and it computes the statistics at each position empirically from the data. In brief, given those statistics, the distortion to be minimized and the rate, the algorithm makes use of the Lloyd-Max algorithm [27] to compute the best quantizers. Note that at each position there are as many quantizers as different values in the previous position (due to the Markov assumption). A quantizer is composed of decision regions and the representatives of each region. Once all the quantizers are computed, QVZ assigns each quality score to the corresponding decision region, which is then losslessly compressed by an adaptive arithmetic encoder. In order to improve the rate-distortion performance, QVZ has the option of clustering the data prior to compression.
Illumina's Binning
Illumina's proposed binning reduces the alphabet size by applying an 8 level mapping. The specific mapping performed by DSRC2 is summarized in Table 1 (the actual binning performed by Illumina may differ slightly, as it may depend on the specific machine and model used for sequencing). As can be inferred from the table, the applied mapping is more precise in representing high quality scores than low ones (based on the size of the bins). Also, note that the maximum distance between an original quality score and the new one is always upper bounded by 5.
Table 1.
Illumina's proposed 8 level mapping as performed by DSRC2
| Quality score bins | New quality score |
|---|---|
| N (no call) | N (no call) |
| 2-9 | 6 |
| 10-19 | 15 |
| 20-24 | 22 |
| 25-29 | 27 |
| 30-34 | 33 |
| 35-39 | 37 |
| >39 | 40 |
COMPARISON OF LOSSY COMPRESSORS
There are some important differences between the lossy compressors introduced above. For example, the compression scheme of Illumina's proposed binning does not depend on the statistics of the quality scores, whereas QVZ and P/R-Block do. Also, in both Illumina's proposed binning and P/R-Block the maximum absolute distance between a quality score and its reconstructed one (after decompression) can be controlled by the user, whereas in QVZ this is not the case. The reason is that QVZ designs the quantizers to minimize a given average distortion based on a rate constraint, and thus even though on average the distortion is small, some specific quality scores may have a reconstructed quality score that is far from the true one. Also, note that whereas Illumina's proposed binning applies more precision to high quality scores, R-Block does the opposite, and P-Block does it equally among all the quality scores. Finally, in Illumina's proposed binning and P/R-Block the user cannot estimate the size of the compressed file in advance, whereas this is possible in QVZ.
Another important point to be made regarding the lossy compressors is the comparison of the final file size. Note that in general, algorithms for lossy compression perform two operations: computing the new quality scores, and compressing these new values. Thus the final compression ratio is both a product of the data transform and the encoding method used to compression. Some algorithms may not have an advanced encoding method, and as a result the achieved compression ratio may not reflect the true potential in terms of size reduction. Thus the results in terms of size reported in the results section should not be taken as written in stone.
RESULTS
We analyze the output of the variant caller (i.e., the VCF file) for each of the introduced pipelines when the quality scores are replaced by those generated by a lossy compressor. We focus on the following lossy compressors: QVZ, PBlock, RBlock and DSRC2. Recall that in QVZ parameters include the distortion, the rate and the number of clusters, and in PBlock and RBlock the parameters p and r, respectively. DSRC2 uniquely performs Illumina's proposed binning. Thus, except for DSRC2, we run each of the algorithms several times with different parameters, generating different quality scores for each run. Specifically, we used QVZ with 1 and 3 clusters, rates ranging from 0 to 1, and the three built-in distortions MSE, L1 and Lorentzian (we refer to them as M, A and L, respectively). For PBlock we considered values of p ranging from 1 to 32, and for RBlock values of r ranging from 3 to 30.
Due to space constraints, here we show the results for QVZ with MSE distortion and three clusters, denoted as QVZ-Mc3, RBlock and the Illumina proposed binning. We selected these as they are good representatives of the overall results. We refer the reader to the Supplementary Data for the results with all the aforementioned parameters.
SNP calling
Figures 3 and 4 show the average sensitivity, precision and f-score, together with the compression ratio (in bits per quality score), over the 4 datasets and for the three pipelines when the golden standard is that of NIST and Illumina, respectively. For ease of visualization, we only show the results obtained with the lossless compressed data, and the one lossily compressed with QVZ (applied with 3 clusters and MSE distortion), RBlock, and Illumina’s proposed binning. We chose to show the results on these algorithms because we found the results to be very representative. The lossless compressed rate is computed using QVZ in lossless mode (which, as shown in [3], performs similarly to the state-of-the-art lossless compressors for quality scores).
Figure 3.

Average sensitivity, precision and f-score of the four considered datasets using the NIST ground truth. Different colors represent different pipelines, and different points within an algorithm represent different rates. Q40 denotes the case of setting all the quality scores to 40.
Figure 4.

Average sensitivity, precision and f-score of the four considered datasets using the Illumina ground truth. Different colors represent different pipelines, and different points within an algorithm represent different rates. Q40 denotes the case of setting all the quality scores to 40.
When reading the results, it is important to note the ground truth that was used for the evaluation, as the choice of ground truth can directly affect the results. Recall that, as shown in Figure 2, Illumina’s ground truth contains the majority of the SNPs contained in the NIST-GIAB, plus some more. Thus, assuming both ground truths are largely correct, a SNP caller is likely to achieve a higher sensitivity with the NIST ground truth, while the precision will probably be lower. Vice versa, when comparing the output of a SNP caller against the Illumina ground truth, we will probably obtain a lower sensitivity and a higher precision.
We further define the variability observed in the output of the different SNP calling pipelines as the methodological variability, and the variability introduced by the lossy compressor within a pipeline as the lossy variability. We show that the lossy variability is orders of magnitude smaller than the methodological variability; this indicates that the changes in calling accuracy introduced by lossy compressing the quality scores are negligible.
As shown in the figures, the variability obtained between different variant callers (methodological variability) is significantly larger than the variability introduced by the lossy compressors (for most rates), i.e., the lossy variability. Specifically, for rates larger than 1 bit per quality score, we observe that the effect that lossy compressors have on SNP calling is several orders of magnitude smaller than the variability that already exists within the different variant calling pipelines. For smaller rates, we observe a degradation in performance when using QVZ, and the lossy variability becomes more noticeable in this case. Recall that QVZ minimizes the average distortion, and thus at very small rates some of the quality scores may be highly distorted. If the highly distorted quality scores happen to play an important role in calling a specific variant, the overall performance may be affected. On the other hand, RBlock permits the user to specify the maximum allowed individual distortion, and less degradation is obtained in general for small rates. Note also that for rates higher than 1 bit per quality score the performance of both QVZ and RBlock is similar. Illumina’s proposed binning achieves around 1 bit per quality score on average, and achieves a performance comparable to that of QVZ and RBlock. Finally, we found that swapping the original quality scores with ones generated uniformly at random (Results not shown.), or with all set to a fixed value (Q40 in the figure), significantly degraded the performance. These observations demonstrate that the quality scores are actively used in all the pipelines when calling variants, and thus discarding them is not a viable option.
Regarding the selection of the ground truth, we observe a higher sensitivity with the NIST ground truth, and a higher precision with the Illumina’s ground truth. Note that these results are in line with the above discussion regarding the choice of ground truth.
To gain insight into the possible benefits of using lossy compression, we show the distribution of the f-score difference between the lossy and lossless case for different lossy compressors and rates (thus a positive number indicates an improvement over the lossless case). The distribution is computed by averaging over all simulations (24 values in total; 4 datasets, 3 pipelines and 2 ground truths). Figure 5 shows the box-plot and the mean value of the f-score difference for six different compression rates. Since QVZ performs better for high rates, we show the results for QVZ-Mc3 with parameters 0.9, 0.8 and 0.6 (left-most side of the figure). Analogously, for high compression ratios we show the results of RBlock with parameters 30, 20, and 10 (right-most side of the figure).
Figure 5.
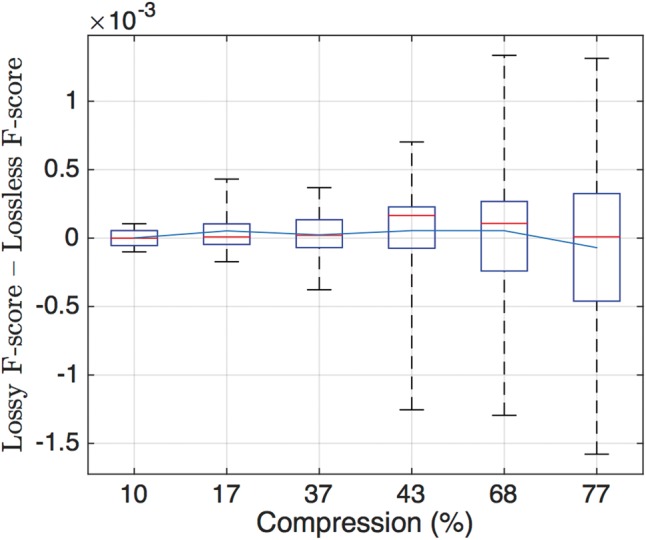
Box plot of f-score differences between the lossless case and six lossy compression algorithms for 24 simulations (4 datasets, 3 pipelines and 2 ground truths). The x-axis shows the compression rate achieved by the algorithm. The three left-most boxes correspond to QVZ-Mc3 with parameters 0.9, 0.8 and 0.6, while the three right-most boxes correspond to RBlock with parameters 30, 20 and 10. The blue line indicates the mean value, and the red one the median.
Remarkably, for all the rates the median is positive, which indicates that in at least 50% of the cases lossy compression improved upon the uncompressed quality scores. Moreover, the mean is also positive, except for the point with highest compression. This suggests that lossy compression may be used to reduce the size of the quality scores without compromising the performance on the SNP calling.
The above reported results show that lossy compression of quality scores (up to a certain threshold on the rate) does not affect the performance on variant calling. Moreover, the box plot of Figure 5 indicates that in some cases an improvement with respect to the original data can be obtained. We now look into these results in more detail, by focusing on the individual performance of each of the variant calling pipelines.
We choose to show the results using tables as they help visualize which lossy compressors and/or parameters work better for a specific setting. We color in red (will appear as a shaded cell) the values of the sensitivity, precision and f-score that improve upon the uncompressed. We also generated a table for each pipeline and/or ground truth that contains the average behavior of each of the algorithms with the different data sets. We provide excel files (.xlsx) as Supplementary Data that contain all the generated tables.
Table 2 shows the results for algorithms RBlock, QVZ-Mc3 (MSE distortion criteria and 3 clusters) and Illumina binning-DSRC2 for the GATK with hard filtering pipeline when using the NIST ground truth. The two columns refer to the average results of Chromosomes 11 and 20 of the ERR262996 and ERR174310 datasets, respectively. We refer to the Supplementary Data(.xlsx) for the results of QVZ using other distortions and rates, and for PBlock, as well as for the results of individual chromosomes. The results for the htslib.org and Platypus pipelines are also contained in the Supplementary Data, but we comment on the results here as well.
Table 2.
Sensitivity, precision, f-score and compression ratio for the 30× and 15× coverage datasets for the GATK pipeline, using the NIST ground truth
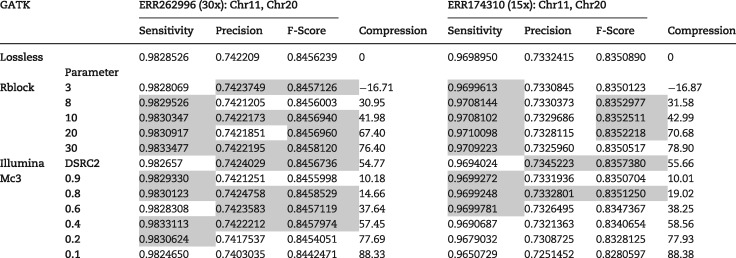 |
Note: Table entries colored in red represent an improvement with respect to the lossless data.
It is worth noting that with the GATK pipeline, several compression approaches improve simultaneously the sensitivity, precision, and f-score when compared to the uncompressed (original) quality scores. For example, in the 30-coverage dataset, RBlock improves the performance while reducing the size by more than 76% (PBlock manages to boost the compression to more than 80%, see Supplementary Data(.xlsx)). In the 15-coverage dataset QVZ improves upon the uncompressed and reduces its size by 20%. With the htslib.org pipeline, it is interesting to see that most of the points improve the sensitivity parameter, meaning that they are able to find more T.P. than with the uncompressed quality scores. Finally, with the Platypus pipeline, the parameters that improve in general are the precision and the f-score, which indicates that a bigger percentage of the calls are T.P. rather than F.P. Some points also improve upon the uncompressed. Similar tables when the ground truth is provided by Illumina are contained in the Supplementary Data(.xlsx). In that case, with the GATK pipeline, R/P-Block improves mainly the sensitivity and f-score, with PBlock improving the precision as well in the 30× coverage dataset. QVZ seems to perform better in this case, improving upon the uncompressed for several rates. It also achieves a performance better than that of Illumina's proposed binning for a similar compression rate. With the htslib.org pipeline R/P-Block improve mainly the sensitivity, while QVZ improves the precision and the f-score (in the 30× coverage dataset). The performance on Platypus is similar to the one obtained when the NIST ground truth is used instead.
In summary, the performance of QVZ with 3 clusters is in general better than with 1 cluster, especially for small rates. In terms of the distortion metric that QVZ aims to minimize, MSE works significantly better for small rates (in most of the cases), whereas for higher rates the three analyzed distortions offer a similar performance. Thus the compression rate seems much more significant to the variability in the performance than the choice of distortion criterion. RBlock offers in general better performance than PBlock for similar compression rates. Finally, in most of the analyzed cases, Illumina's binning is outperformed by at least one other lossy compressor, while offering a similar compression rate. Overall, for high compression ratios (30–70%), RBlock seems to perform the best, whereas QVZ is preferred for lower compression rates (>70%).
In the previously analyzed cases we have assumed that all the SNPs contained in the VCF file are positive calls, since the pipelines already follow their “best practice” to generate the corresponding VCF file. As discussed in the Methodology, another possibility is to select a parameter and consider positive calls only those whose parameter is above a certain threshold. Varying the threshold results in the ROC curve. We believe this approach is of interest to analyze the VCF files generated by the GATK pipeline followed by the VQSR filter, with thresholding parameter given the VQSLOD field, and thus we present the results for this case. For completeness, we also generated the ROC curves of the remaining cases (see Supplementary Data). Figure 6 shows the ROC curve of chromosome 11 of the 30× coverage dataset (ERR262996), with the NIST ground truth. The results correspond to those obtained when the quality scores are the original ones (lossless), and the ones generated by QVZ-Mc3 (MSE distortion and 3 clusters), PBlock with parameter 8, RBlock with parameter 25 and the Illumina binning (as the results of applying the DSRC2 algorithm). As shown in the figure, each of the algorithms outperform the rest in at least one point of the curve. This is not the case for the Illumina Binning, as it is outperformed by at least one other algorithm in all points. Moreover, the AUC of all the lossy compressors except that of the Illumina Binning outperform that of the lossless case.
Figure 6.
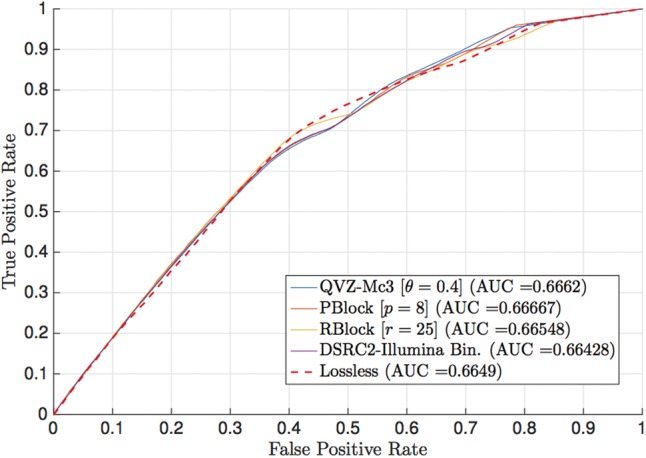
ROC curve of chromosome 11 (ERR262996) with the NIST ground truth and the GATK pipeline with the VQSR filter. The ROC curve was generated with respect to the VQSLOD field. The results are for the original quality scores (uncompressed), and those generated by QVZ-Mc3 (MSE distortion and 3 clusters), PBlock (p = 8) and RBlock (r = 25).
INDEL detection
We show that lossy compression of quality values leads to smaller files while enabling INDEL detection algorithms to achieve accuracies similar to the accuracies obtained with data that has been compressed losslessly.
We simulated four datasets that each consisted of the CEU major alleles for chromosome 22 [28, 31] with approximately 3000 homozygous INDELs that were biologically realistic in length, location, and insertion-to-deletion ratio. VCF files containing the ground truth variants and BAM files containing the associated simulated 100bp paired-end Illumina HiSeq reads are available at http://web.stanford.edu/∼iochoa/dataset1.tar.gz (Dataset 1 is available for direct download. However, due to the size of the datasets, the remaining ones are available upon request.).
Figure 7 shows the sensitivity, precision, and f-score achieved by each INDEL detection pipeline using input data from the aforementioned compression approaches, together with the compression ratio in bits per quality score. Note that the figure displays the means across the four simulated datasets (see Supplementary Data for individual values). In terms of sensitivity, all four INDEL detection pipelines (HaplotypeCaller, UnifiedGenotyper, Dindel, and Freebayes) resulted in a lossy variability, as described above, that does not exceed the methodological variability. All compression algorithm and INDEL detection pipeline combinations had high precision (all but 1 obtained precision > 0.995). Besides the DSRC2 compression approach applied to HaplotypeCaller, lossy compression did not result in variability in precision.
Figure 7.

Average (of four simulated datasets) sensitivity, precision and f-score for INDEL detection pipelines. Different colors represent different pipelines, and different points within an algorithm represent different rates.
Table 3 displays the sensitivity for an example INDEL detection pipeline, Dindel; results are shown for each compression approach for each simulated dataset individually, along with the mean and standard deviation across datasets. The mean sensitivity for the lossless compression was 0.9796. Interestingly, RBlock (with R parameter set to 8 or 10) achieves a slightly higher average sensitivity of 0.9798. The remaining pipelines have mean sensitivities ranging from 0.9644 to 0.9796. The standard deviation across pipelines was low, ranging from 0.0016 to 0.0033.
Table 3.
. Sensitivity for INDEL detection by dindel pipeline with various compression approaches for 4 simulated datasets
|
Sensitivity |
||||||
|---|---|---|---|---|---|---|
| Compression Approach | Dataset 1 | Dataset 2 | Dataset 3 | Dataset 4 | Mean | Standard Deviation |
| Lossless | 0.9817 | 0.9788 | 0.9805 | 0.9775 | 0.9796 | 0.0019 |
| Illumina - DSRC2 | 0.9661 | 0.9662 | 0.9666 | 0.9621 | 0.9652 | 0.0021 |
| Mc3 - 0.3 | 0.9776 | 0.9737 | 0.9747 | 0.9696 | 0.9739 | 0.0033 |
| Mc3 - 0.7 | 0.9817 | 0.9775 | 0.9799 | 0.9758 | 0.9787 | 0.0026 |
| Mc3 - 0.9 | 0.9817 | 0.9788 | 0.9805 | 0.9764 | 0.9794 | 0.0023 |
| Pblock - 2 | 0.9817 | 0.9788 | 0.9805 | 0.9775 | 0.9796 | 0.0019 |
| Pblock - 8 | 0.9810 | 0.9778 | 0.9802 | 0.9775 | 0.9791 | 0.0017 |
| Pblock - 16 | 0.9654 | 0.9662 | 0.9652 | 0.9607 | 0.9644 | 0.0025 |
| Rblock - 3 | 0.9817 | 0.9788 | 0.9805 | 0.9775 | 0.9796 | 0.0019 |
| Rblock - 8 | 0.9817 | 0.9788 | 0.9805 | 0.9781 | 0.9798 | 0.0016 |
| Rblock - 10 | 0.9817 | 0.9788 | 0.9805 | 0.9781 | 0.9798 | 0.0016 |
Discussion
We have shown that lossy compressors can reduce file size at a minimal cost - or even benefit - to sensitivity and precision in SNP and INDEL detection.
We have analyzed several lossy compressors introduced recently in the literature that do not use any biological information (such as the reads) for compression. The main difference among them relates to the way they use the statistics of the quality scores for compression. For example, Illumina's proposed binning is a fixed mapping that does not use the underlying properties of the quality scores. In contrast, algorithms like QVZ are fully based on the statistics of the quality scores to design the corresponding quantizers for each case.
Based on the results shown in the previous section, we conclude that in many cases lossy compression can significantly reduce the genomic file sizes (with respect to the losslessly compressed) without compromising the performance on the variant calling. Specifically, we observe that the variability in the calls output by different existing SNP and INDEL callers is generally orders of magnitude larger than the variability introduced by lossy compressing the quality scores, specially for moderate to high rates. For small rates (around less than 1 bit per quality score), lossy compressors that minimize the average distortion, such as QVZ, get a degradation in performance. This is due to some of the quality scores getting highly distorted. We believe a boost in performance in the low-rate regime is possible, and that it deserves more investigation. For example, a good clustering of the quality score sequences prior to compression could group together sequences of similar statistics, yielding smaller distortion in each of the cluster, and thus reducing the overall distortion. At high rates, the analyzed lossy compressors perform similarly, except for Illumina’s proposed binning, which is generally outperformed by the other lossy compressors. This suggests that using the statistics of the quality scores for compression is beneficial, and that not all datasets should be treated in the same way.
The degradation in performance observed when setting the quality scores to a random value or all to maximum, demonstrates that the quality scores do matter, and thus discarding them is not a viable option in our opinion. We recommend applying lossy compression with moderate to high rates to ensure the quality scores are not highly distorted. In algorithms such as PBlock and RBlock, the user can directly specify the maximum allowed distortion. In algorithms that minimize an average distortion, such as QVZ, we recommend to employ at least one bit per quality score.
Finally, in several cases we have observed that lossy compression actually leads to superior results compared to lossless compression, i.e., they generate more true positives and fewer false positives than with the original quality scores, when compared to the corresponding ground truth. This behavior is consistent with observations from the recent literature (see for example [3, 5]). One important remark is that none of the analyzed lossy compressors make use of biological information for compression, in contrast to other algorithms such as the one introduced in [5]. We believe this is of importance, as one could argue that the latter algorithms are tailored towards variant calling, and thus a careful read of the results should be made. The fact that we are able to show improved variant calling performance in some cases with algorithms that do not use any biological information further shows the potential of lossy compression of quality scores to improve on any downstream application.
Our findings put together with the fact that, when losslessly compressed, quality scores comprise more than 50% of the compressed file [2], seem to indicate that lossy compression of quality scores could become an acceptable practice in the future for boosting compression performance or when operating in bandwidth constrained environments. The main challenge in such a mode may be to decide which lossy compressor and/or rate to use in each case. Part of this is due to the fact that the results presented so far are experimental, and we have yet to develop theory that will guide the construction or choice of compressors geared toward improved inference. One reason is that the statistics of the noise inherent in the quality scores have yet to be understood and thus it is not possible to design lossy compressors tailored to them. Moreover, the results that show that lossy compression can lead to inference that improves upon the uncompressed suggest that the data could be denoised. In that regard, an understanding of the statistical characteristics of the noise would enable the design of denoisers that remove part of the noise (see for example [33]), thus improving the subsequent analysis performed on it. Moreover, removing part of the noise would result in quality scores with lower entropy, that when lossless compressed would yield better compression results than those obtained with the noisy quality scores (original data).
Evidently, for lossy compression of quality scores to become a standard practice, further research is called for. It should include improved modeling of the statistics of the noise, construction of lossy compressors and denoisers tuned to such models, and more experimentation on real data with additional downstream applications. Further, the phenomenon observed here where lossy compression of the quality scores can actually boost the performance of the downstream applications is highlighting not only the potential in lossy compression of quality scores, but also the need for revisiting the design of the downstream applications to make more principled use of the quality scores (with and without compression). For example, variant detection methods utilize base quality values to various degrees. Some variant detection methods do not utilize the information conveyed by quality scores at all. In particular, Pindel [34] results for indel calls did not change at all when lossy compression was applied to the quality values (results not shown). We believe the performance could be improved by using the information conveyed in quality values in more meaningful ways.
Conclusion
Recently there has been a growing interest in lossy compression of quality scores as a way to reduce raw genomic data storage costs. However, the genomic data under consideration is used for biological inference, and thus it is important to first understand the effect that lossy compression has on the subsequent analysis performed on it. To date, there is no clear methodology to do so, as can be inferred from the variety of analyses performed in the literature when new lossy compressors are introduced. To alleviate this issue, in this paper we have described a methodology to analyze the effect that lossy compression of quality scores has on variant calling, one of the most widely used downstream applications in practice. We hope the described methodology will be of use in the future when analyzing new lossy compressors and/or new datasets.
Specifically, the proposed methodology considers the use of different pipelines for SNP calling and INDEL calling, and datasets for which true variants exist (“ground truth”). We have used this methodology to analyze the behavior of the state-of-the-art lossy compressors, which to our knowledge constitutes the most complete analysis to date. The results demonstrate the potential of lossy compression as a means to reduce the storage requirements while obtaining performance close to that based on the original data. Moreover, in many cases we have shown that it is possible to improve upon the original data, corroborating the belief that the quality scores are noisy and thus they can be denoised (in our case via compression).
Our findings and the growing need for reducing the storage requirements suggest that lossy compression may be a viable mode for storing quality scores. However, further research should be performed to better understand the statistical properties of the quality scores, as well as the noise underlying their generation, to enable the principled design of lossy compressors and/or denoisers tailored to them. Moreover, methodologies for the analysis on other important downstream applications should be developed.
Key Points
In this paper we analyze the effect that lossy compression of quality scores has on the performance of variant callers (SNP calling and INDEL detection).
We propose a clear methodology to perform the aforementioned analysis, which includes several pipelines and datasets.
We show that lossy compression has the potential to boost the compression performance while achieving a performance that is close - sometimes better – to that achieved with the original data.
Supplementary data
Supplementary data are available online at http://bib.oxfordjournals.org/.
Funding
This work was supported by a Stanford Graduate Fellowship Program in Science and Engineering; a fellowship from the Basque Government; a grant from the Center for Science of Information (CSoI); the National Institutes of Health [grant number 2014-07364-01, 1 U01 CA198943-01]; the National Science Foundation [grant number 1157849-1-QAZCC]; the National Library of Medicine Training [grant number T15 LM7033]; and a National Science Foundation graduate research fellowship.
Supplementary Material
Idoia Ochoa graduated with BSc and MSc degrees in Telecommunication Engineering from the University of Navarra, Spain, in 2009. She obtained her MSc degree in Electrical Engineering from Stanford University in 2012. Currently, she is a PhD student at Stanford University, working with Professor Tsachy Weissman.
Mikel Hernaez graduated with a BSc and MSc in Telecommunication Engineering from the University of Navarra, Spain, in 2009. He earned his PhD from the same institution in 2012, where he became the lecturer of the Information Theory and Coding course. Currently, he is a postdoctoral researcher at Stanford University, working with Professor Tsachy Weissman.
Rachel Goldfeder graduated from Washington University in St. Louis with a BS in Biomedical Engineering in 2011. After graduating, she worked as a post-baccalaureate fellow at the NIH. Rachel is currently a Biomedical Informatics PhD student in Euan Ashley’s lab.
Tsachy Weissman graduated summa cum laude with a BSc in electrical engineering from the Technion in 1997, and earned his PhD at the same place in 2001. He then worked at Hewlett Packard Laboratories with the information theory group until 2003, when he joined Stanford University, where he is currently Professor of Electrical Engineering and incumbent of the STMicroelectronics chair in the School of Engineering.
Euan Ashley obtained a BSc (1993) and MB ChB (1996) from the University of Glasgow and then a MRCP (1999) and DPhil (2002) from the University of Oxford. He is currently Associate Professor of Medicine and Genetics, Director of the Clinical Genomics Service, and Director of the Center for Inherited Cardiovascular Disease at Stanford University.
References
- 1. SFSW Group. Sequence alignment/map format specification. https://github.com/samtools/hts-specs, 2013.
- 2. Bonfield JK, Mahoney MV.. Compression of fastq and sam format sequencing data. PLoS One 2013;8:e59190. [DOI] [PMC free article] [PubMed] [Google Scholar]
- 3. Malysa G, Hernaez M, Ochoa I, et al. Qvz: lossy compression of quality values. Bioinformatics 2015;31:3122–9. [DOI] [PMC free article] [PubMed] [Google Scholar]
- 4. Janin L, Rosone G, Cox AJ.. Adaptive reference-free compression of sequence quality scores. Bioinformatics 2013;30:24–30. [DOI] [PubMed] [Google Scholar]
- 5. Yu YW, Yorukoglu D, Peng J, et al. Quality score compression improves genotyping accuracy. Nat Biotechnol 2015;33(3):�240–43. [DOI] [PMC free article] [PubMed] [Google Scholar]
- 6. Benoit G, Lemaitre C, Lavenier D, et al. Reference-free compression of high throughput sequencing data with a probabilistic de Bruijn graph. BMC Bioinf 2015;16:288. [DOI] [PMC free article] [PubMed] [Google Scholar]
- 7. Canovas R, Moffat A, Turpin A. Lossy compression of quality scores in genomic data. Bioinformatics 2014;30(15):2130–6. [DOI] [PubMed] [Google Scholar]
- 8. Ochoa I, Asnani H, Bharadia D, et al. Qualcomp: a new lossy compressor for quality scores based on rate distortion theory. BMC Bioinf 2013;14:187–1. [DOI] [PMC free article] [PubMed] [Google Scholar]
- 9. Zook JM, Chapman B, Wang J, et al. Integrating human sequence data sets provides a resource of benchmark snp and indel genotype calls. Nat Biotechnol 2014;32(3):246–51. [DOI] [PubMed] [Google Scholar]
- 10. Linderman MD, Brandt T, Edelmann L, et al. Analytical validation of whole exome and whole genome sequencing for clinical applications. BMC Med Genomics 2014;7:1–20. [DOI] [PMC free article] [PubMed] [Google Scholar]
- 11. Liu X, Han S, Wang Z, et al. Variant callers for next-generation sequencing data: a comparison study. PLoS One 2013;8(9):�e75619. [DOI] [PMC free article] [PubMed] [Google Scholar]
- 12. Yu X, Sun S.. Comparing a few snp calling algorithms using low-coverage sequencing data. BMC Bioinf 2013;14(1):274. [DOI] [PMC free article] [PubMed] [Google Scholar]
- 13. O’Rawe J, Jiang T, Sun G, et al. Low concordance of multiple variant-calling pipelines: practical implications for exome and genome sequencing. Genome Med 2013;5(3):28. [DOI] [PMC free article] [PubMed] [Google Scholar]
- 14. Lam HY, Clark MJ, Chen R, et al. Performance comparison of whole- genome sequencing platforms. Nat Biotechnol 2012;�30(1):�78–82. [DOI] [PMC free article] [PubMed] [Google Scholar]
- 15. McKenna A, Hanna M, Banks E, et al. The genome analysis toolkit: a mapreduce framework for analyzing next-generation DNA sequencing data. Genome Res 2010;�20(9):1297–303. [DOI] [PMC free article] [PubMed] [Google Scholar]
- 16. DePristo MA, Banks E, Poplin R, et al. A framework for variation discovery and genotyping using next-generation dna sequencing data. Nat Genet 2011;43(5):491–498. [DOI] [PMC free article] [PubMed] [Google Scholar]
- 17. Auwera GA, Carneiro MO, Hartl C, et al. From fastq data to high-confidence variant calls: the genome analysis toolkit best practices pipeline. Curr Protoc Bioinformatics 2013;11:�11.10.1–11.10.33. [DOI] [PMC free article] [PubMed] [Google Scholar]
- 18. Li H, Handsaker B, Wysoker A, et al. The sequence alignment/map format and samtools. Bioinformatics 2009;25(16):2078–9. [DOI] [PMC free article] [PubMed] [Google Scholar]
- 19. Rimmer A, Phan H, Mathieson I, et al. In- tegrating mapping-, assembly-and haplotype-based approaches for calling variants in clinical sequencing applications. Nat Genet 2014;46(8):�912–18. [DOI] [PMC free article] [PubMed] [Google Scholar]
- 20. Li H. Aligning sequence reads, clone sequences and assembly contigs with bwa-mem. arXiv preprint arXiv:1303.3997, 2013.
- 21. Albers CA, Lunter G, MacArthur DG, et al. Dindel: accurate indel calls from short-read data. Genome Res 2011;21(6):�961–73. [DOI] [PMC free article] [PubMed] [Google Scholar]
- 22. Garrison E, Marth G Haplotype-based variant detection from short-read sequencing. arXiv preprint arXiv:1207.3907 2012.
- 23. Huang W, Li L, Myers JR, et al. A next- generation sequencing read simulator. Bioinformatics 2012;28(4):593–4. [DOI] [PMC free article] [PubMed] [Google Scholar]
- 24. Danecek P, Auton A, Abecasis G, et al. The variant call format and vcftools. Bioinformatics 2011;27(15):2156–8. [DOI] [PMC free article] [PubMed] [Google Scholar]
- 25. Roguski L, Deorowicz S.. Dsrc2-industry-oriented compression of fastq files. Bioinformatics 2014;30(15):2213–15. [DOI] [PubMed] [Google Scholar]
- 26. Fritz MHY, Leinonen R, Cochrane G, et al. Efficient storage of high throughput DNA sequencing data using reference-based compression. Genome Res 2011;21(5):734–40. [DOI] [PMC free article] [PubMed] [Google Scholar]
- 27. Lloyd SP. Least squares quantization in PCM. IEEE Trans Inform Theory 1982;28(2):129–37. [Google Scholar]
- 28. Dewey FE, Chen R, Cordero SP, et al. Phased whole-genome genetic risk in a family quartet using a major allele reference sequence. PLoS Genet 2011;7(9):e1002280. [DOI] [PMC free article] [PubMed] [Google Scholar]
- 29. Hach F, Numanagic I, Alkan C, Sahinapl SC.. SCALCE: boosting sequence compression algorithms using locally consistent encoding. Bioinformatics 2012;28(23):3051–7. [DOI] [PMC free article] [PubMed] [Google Scholar]
- 30. Yu Y, William DY, Berger B. Traversing the k-mer landscape of NGS read datasets for quality score sparsification. In: Research in Computational Molecular Biology, 2014, pp. 385–99. Springer. [DOI] [PMC free article] [PubMed] [Google Scholar]
- 31. Dewey FE, Chen R, Cordero SP, et al. Data from: Phased whole-genome genetic risk in a family quartet using a major allele reference sequence. Dryad Digital Repository 2011. [DOI] [PMC free article] [PubMed] [Google Scholar]
- 32. Wan R, Anh VN, Asai K. Transformations for the compression of FASTQ quality scores of next-generation sequencing data. Bioinformatics 2012;28(5):628–35. [DOI] [PubMed] [Google Scholar]
- 33. Jalali S, Weissman T. Denoising via mcmc-based lossy compression. EEE Trans Signal Process 2012;60(6):3092–100. [Google Scholar]
- 34. Ye K, Schulz MH, Long Q, et al. Pindel: a pattern growth approach to detect break points of large deletions and medium sized insertions from paired-end short reads. Bioinformatics 2009;25(21):2865–71. [DOI] [PMC free article] [PubMed] [Google Scholar]
Associated Data
This section collects any data citations, data availability statements, or supplementary materials included in this article.