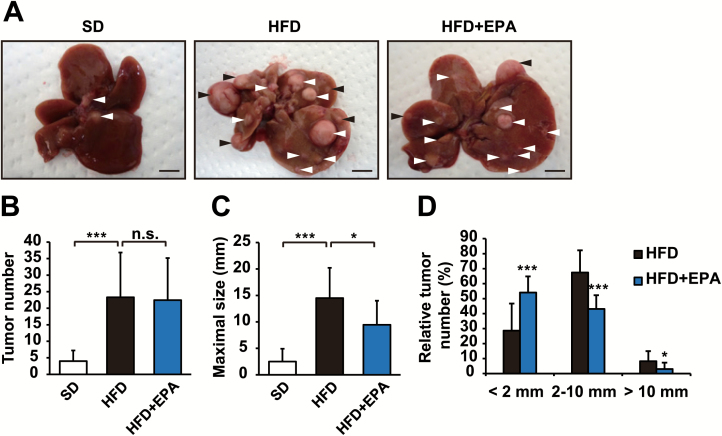
Figure 3.
EPA attenuates obesity-enhanced hepatocarcinogenesis. Gross liver morphology (A), tumor numbers (B), tumor maximal sizes (C) and tumor size distribution (D) from DEN-injected mice fed SD, HFD or HFD + EPA for 37 weeks. Arrows indicate tumors (A). Scale bars = 10 mm. All values represent the mean ± SD (n = 10–12). *P < 0.05; ***P < 0.001. n.s. indicates not significant.

