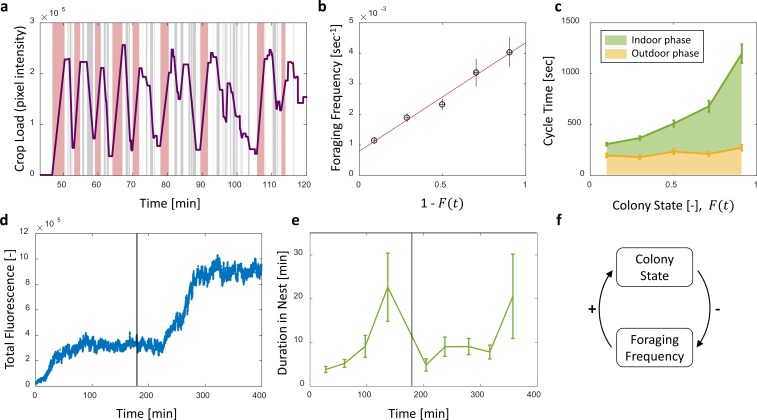
Figure 4. Foraging cycles.
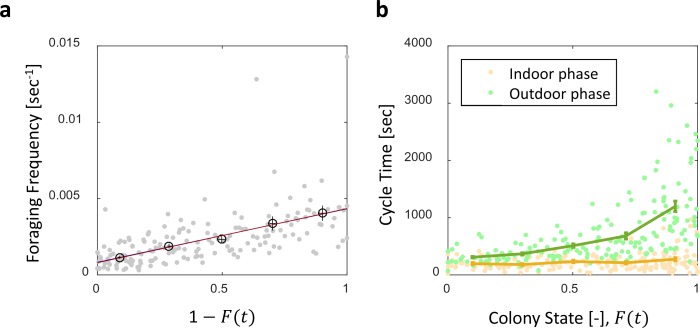
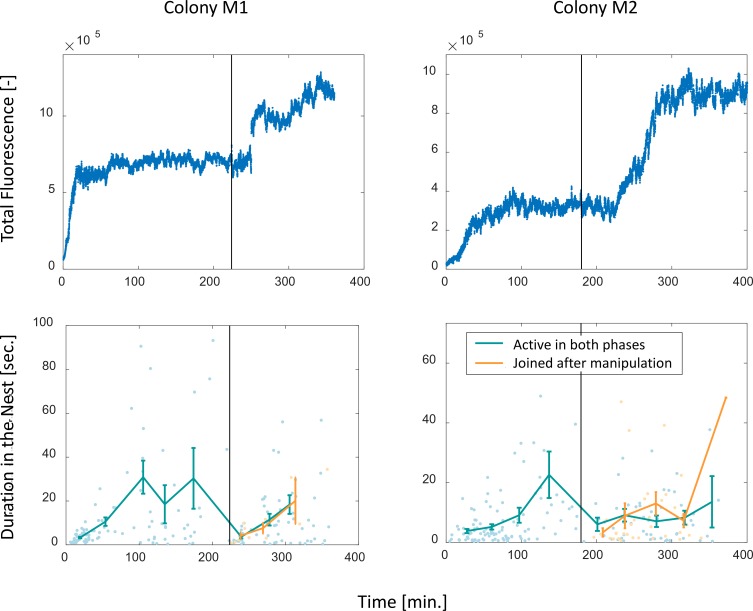
(a) The estimated crop load of a single forager during the first two hours of an experiment. As typical for a forager, her crop load oscillates as she alternates between feeding at the food source (pink areas) and unloading in trophallaxis (gray areas) in continuous back-and-forth trips. (b) The foraging frequency of individual foragers, calculated as the inverse of cycle times (the time interval between two consecutive feeding events of a single forager), grows linearly with the empty space in the colony, . Data points and error bars represent means and SEM of cycles. The pooled data from all three observation experiments is grouped into equally-spaced bins of colony state (n = 57,39,28,26,26, for bins 1–5, respectively, see Figure 4—figure supplement 1). A linear fit is presented in red: , . (c) Forager cycle durations are composed of an indoor phase (green) and an outer phase (yellow), the former accounting for most of the rising trend. The pooled data from all three observation experiments was binned and averaged as in panel b (n = 26,26,28,39,57, for bins 1–5, respectively, Figure 4—figure supplement 1). (d) Food accumulation in a perturbation experiment. Food rises to an initial plateau, and rises again to a secondary plateau after new hungry ants are introduced (black line). (e) Durations of foragers in the nest in the manipulation experiment described in panel d. Durations grow longer, drop after new hungry ants are introduced (black line), and subsequently rise again. Data points and error bars represent means and standard errors of durations of cycles grouped into time bins (n = 28,36,21,14,9,28,27,19,5, for bins 1–9, respectively). Raw data and results from a second replication of the perturbation experiment are presented in Figure 4—figure supplement 2. (f) A schematic representation of the observed negative feedback between the colony state and the foraging frequency. Source file for panels b and c is available in the Figure 4—source data 1. Source file for panels d and e is available in the Figure 4—source data 2.


