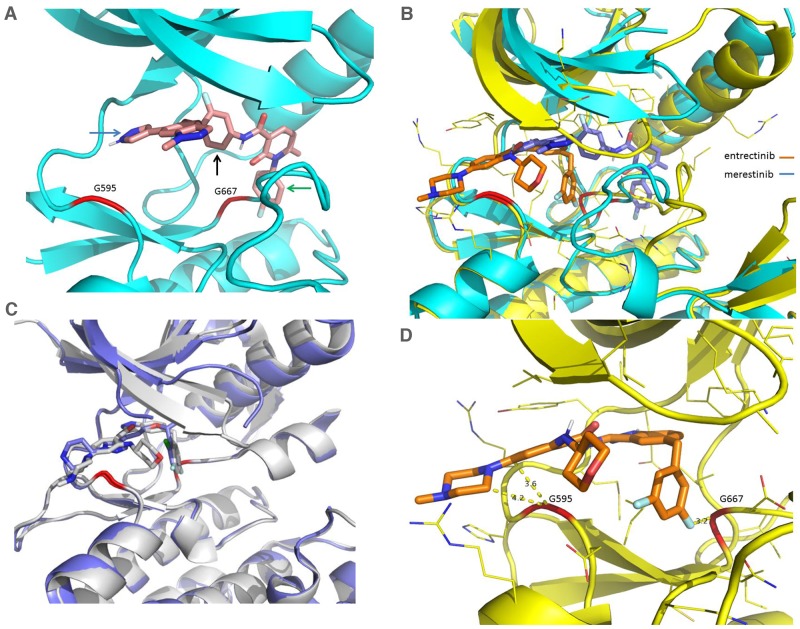
Figure 7. Comparison of X-Ray crystal structures of NTRK1 bound to merestinib and entrectinib, and structures of ALK bound to entrectinib and crizotinib.
(A) Merestinib bound to NTRK1 in ribbon diagram where the protein part is in cyan and the inhibitor in pink. G595 and G667 are highlighted in red in the ribbon. Arrows are used to show key interactions between the inhibitor and protein, the blue arrow for hinge interaction, the black arrow for hydrophobic interaction in the interior pocket while the green arrow for the interaction in the pocket created from the DFG-out conformation. (B) Entrectinib (in brown) and merestinib (in blue) bound to NTRK1 (complex with entrectinib in yellow and complex with merestinib in cyan). The dramatically different conformations in the activation loop (downstream G667) arise from the DFG-in conformation with the type I inhibitor entrectinib and the DFG-out conformation with the type II inhibitor merestinib. (C) Entrectinib (in grey, PDB accession code 5fto) and crizotinib (in blue, PDB accession code 2xp2) bound to ALK to show the similar binding mode of the type I inhibitors. (D) Entrectinib bound to NTRK1 with shown close distances to G595 and G667. The short distance between G595, G667 and the inhibitor means that mutations to a bulkier residue (G595R, G667C) will disturb the bound inhibitor. Larotrectinib is also a type I inhibitor with a similar fluoro-phenyl group located near G667C and thus is expected to be sensitive to the same mutation. This is actually what was presented in a recent study [9].

