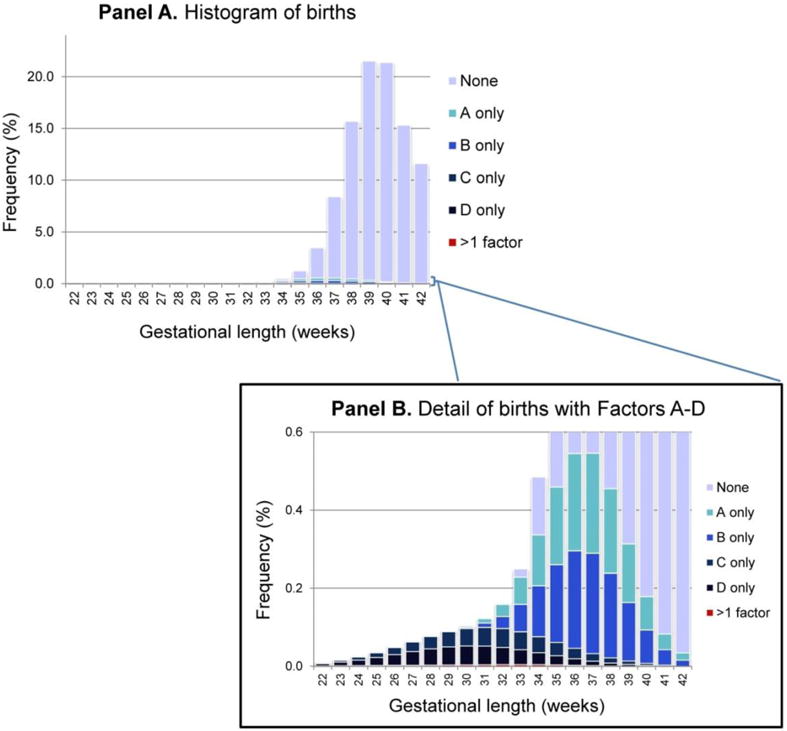
Figure 1.

Histogram of births by week of gestation, demonstrating the week-specific proportion of births with an underlying pathology (i.e., Factors A-D) and with no Factor
Panel A is the overall histogram of births by week. The inset (Panel B) is a magnification of the bottom portion of Panel A (0 – 0.6%), to enable visualization of the proportion of births at each week affected by one or more of Factors A-D.
