

Abstract
Mesenchymal stem cells (MSCs) have received considerable attention in regenerative medicine, particularly in light of prospects for targeted delivery by intra-arterial injection. However, little is known about the mechanics of MSC sequestration in the microvasculature and the yield pressure (PY), above which MSCs will pass through microvessels of a given diameter. The objectives of the current study were to delineate the dependency of PY on cell size and the heterogeneity of cell mechanical properties and diameters (DCELL) of cultured MSCs. To this end the transient filtration test was employed to elucidate the mean filtration pressure (<PY>) for an ensemble of pores of a given size (DPORE) similar to in vivo microvessels. Cultured MSCs had a log-normal distribution of cell diameters (DCELL) with a mean of 15.8 ± 0.73 SD μm. MSC clearance from track-etched polycarbonate filters was studied for pore diameters of 7.3 to 15.4 μm. The pressure required to clear cells from filters with 30–85×103 pores rose exponentially with the ratio λ = DCELL/DPORE for 1.1 ≤ λ ≤ 2.2. The clearance of cells from each filter was characterized by a log-normal distribution in PY, with a mean filtration pressure of 0.02 ≤ <PY> ≤ 6.7 cmH2O. For λ ≤ 1.56, the yield pressure (PY) was well represented by the cortical shell model of a cell with a viscous interior encapsulated by a shell under cortical tension τ0 = 0.99 ± 0.42 SD dyn/cm. For λ > 1.56, the <PY> characteristic of the cell population rose exponentially with λ. Analysis of the mean filtration pressure (<PY>) of each sample suggested that the larger diameter cells that skewed the distribution of DCELL contributed to about 20% of the mean filtration pressure. Further, if all cells had the same deformability (i.e. PY as a function of λ) as the average cell population, then <PY> would have risen an order of magnitude above the average from 5-fold at λ = 1.56 to 200-fold at λ = 2.1. Comparison of <PY> to published microvascular pressures suggested that <PY> may exceed microvessel pressure drops for λ exceeding 2.1, and rise 14-fold above capillary pressure drop at λ = 3 leading to 100% sequestration. However, due to the large variance of in vivo microvascular pressures entrapment of MSCs may be mitigated. Thus it is suggested that selecting fractions of the MSC population according to cell deformability may permit optimization of entrapment at sites targeted for tissue regeneration.
Keywords: Mesenchymal stem cells, microvascular sequestration, deformability, cortical tension
Introduction
Strategies for using human embryonic stem cells, adult stem cells, progenitor cells from a variety of tissues, and induced pluripotent stem cells have formed the foundation of regenerative medicine for tissue and organ reconstruction1. One of the most promising applications of stem cell therapy is the treatment of acute myocardial infarction and chronic ischemic heart disease14, 15. One of the major stem cell candidates for cardiac repair are mesenchymal stem cells (MSCs)25, which can be isolated from bone marrow, adipose tissue and umbilical cord13. MSCs have the capacity to differentiate into a broad range of tissues, including, bone, cartilage, adipose tissue and muscle13, 62, exhibit immune allotolerance, produce regenerative paracrine effects8, 27 and may be readily expanded in culture45, 56 Although the relative roles of MSC differentiation and their paracrine effects remain unclear there is no doubt that effective MSC therapy hinges on their efficient sequestration at a specific target site40.
In the case of cardiac tissue regeneration, multiple routes of MSC delivery to tissue have been explored: (1) intravenous (systemic) infusion, (2) direct intraventricular cavity infusion2, (3) direct injection into cardiac tissue64 and (4) intra-arterial injection3. Although systemic delivery of MSCs is minimally invasive, first pass entrapment in the lungs severely limits delivery to target sites2, 23, 26, 56. Direct left ventricular cavity infusion appears to enhance migration and preferential sequestration in the ischemic myocardium2. Intra-arterial injection of stem cells has shown promise in several studies3–5, 56, 59. Regardless of the route of administration, stem cell sequestration appears to be mainly dictated by cell size25, 58. Furthermore, although it has been shown that MSCs exhibit adhesive interactions with vascular endothelium, as evidenced by rolling mediated by P-selectin48 and firm adhesion mediated by VLA-4/VCAM-1 interactions48, 51, sequestration appears to be mainly determined by MSC mechanical properties.
The ability of circulating cells to traverse the microvasculature has been of considerable interest in blood rheological disorders and inflammation. For example, the entrapment of stiffened red cells during deoxygenation in sickle cell disease may lead to a vicious cycle of ischemia and tissue hypoxia38. In inflammation, leukocyte plugging of capillaries may exacerbate ischemia/reperfusion injury18. Several studies have performed direct observations of stem cell transit through the microvascular network and the mechanisms of entrapment. Intravital microscopy of the capillary network in the dorsal skin-fold chamber (mouse) revealed that 13–23% of circulating mouse embryonic endothelial progenitor cells (eEPCs) passively plugged blood vessels within tumors grown within the chamber58. In contrast, 87% of infused eEPCs adhered to the tumor endothelium without affecting blood flow in this vascular segment. Real-time intravital microscopy of the parasagittal region of the calvarium (mouse) revealed that human MSCs (that normally do not express ligands for E-selectin) could be induced to infiltrate the marrow within hours of infusion and adhere to constitutively expressed E-selectin49. These studies also demonstrated that MSCs rolling on cultured endothelium in a flow chamber could be modified to adhere under conditions of high fluid shear stresses. Studies of the kinetics of human MSC trafficking through mouse cremaster muscle suggested that vaso-occlusion may occur in the microvasculature due to the relatively large size of MSCs25. Tracking of intra-arterially delivered MSCs from arteriole to venule in rat cremaster muscle revealed that 92% of MSCs arrest and interrupt flow at the precapillary level during first pass, thus resulting in decreased flow in the feeding arteriole56. Direct observations of coronary feeding arterioles, nutritive capillaries, and post-capillary venules in grafted syngeneic heart transplants revealed that infused bone marrow derived MSCs were exclusively sequestered in myocardial capillaries, but not in coronary arterioles or post-capillary venules57. Homing of circulating MSCs to perivascular sites and their effect on vascular regeneration and microvessel hemodynamics in mouse skin flap revealed increased functional capillary density and flow during vascular regeneration50. Intracerebral transplantation of bone marrow MSCs revealed increased microvessel density of the microvascular network and increased reactivity of arterioles in rat pia mater54. Adhesion and flow of hematopoietic stem cells (HSCs) were examined by intravital microscopy in a murine model of renal ischemia-reperfusion injury, and revealed that increasing HSC deformability by treatment with the chemokine SDF-1α prolonged their systemic circulation and enhanced their renal retention at sites of damaged tissue61. The increased adhesion shown therein, although partially attributed to increased HSC deformability, is consistent with prior studies of enhanced rolling and adhesion of leukocytes (WBCs) in post-capillary venules attendant to increased WBC deformability31, 39. Adhesion of HPC-7, a murine HSC line, within microvessels of ischemia-reperfusion injured mouse intestine or cremaster muscle was found to increase, and intestinal adhesion was dependent upon CD18 whereas muscle adhesion predominantly relied on CD49d35. Intestinal adhesion also increased in the presence of reactive oxygen species34.
Thus, a common determinant of stem cell sequestration in these studies is the potential for and variability of alterations in stem cell (SC) deformability. SC deformability has been examined in vitro by a variety of techniques: micropipette aspiration41, 44, 47, optical tweezers41, 55 and optical stretching36, 42, capillary-based microfluidic systems36, 37, analysis of diffraction patterns (ektacytometry) of suspensions under shear60, cell manipulation using atomic force microscopy12, 33, 42, imaging cell stretching in extensional flows within a microfluidic chamber9, 28, transit time through a microfluidic chamber32, mechanical manipulation through artificial microscale barriers63, and pressure driven filtration through porous filters56. It is now well accepted that SCs are viscoelastic in nature, since the more rapid the deformation the stiffer the cell appears, and similar to leukocytes, the cell nucleus contributes overwhelmingly to its resistance to deformation during passage through capillary sized pores11, 47. It is well recognized that SC differentiation can be directed by the extracellular stiffness of its surroundings, and SC differentiation is often accompanied by alteration of structural properties of the nucleus11, 12, 42, 43 and the cell membrane55. Deformability has been identified as an early biomarker for pluripotent stem cell differentiation and is likely linked to nuclear structural changes28. Thus, it has been hypothesized that the therapeutic efficacy of mesenchymal stem cells (MSCs) in tissue engineering and regenerative medicine is determined by their unique biological, mechanical, and physicochemical characteristics, which remain to be fully elucidated55.
To elucidate the potential for cell sequestration within the microvasculature, in vitro studies of blood cell deformability have aimed to simulate the passage of blood cells through capillary sized pores in filters. The seminal studies of Gregersen et al.29 using polycarbonate sieves with uniform cylindrical pores (typically on the order of 5 μm) have been followed by numerous studies using either steady state or transient filtration methods to characterize cell deformability. It is generally recognized that the initial cell deformation of a cell entering an orifice of a given size is the primary determinant of the ease with which a blood cell may enter a capillary10, 46, 52. Quantitative indices of cell deformability have been derived from measurement of the flow of a suspension of cells through a filter in terms of the resistance to flow for a specified pore density and pore diameter. Using steady-flow filtration methods, a quantitative index of cell deformability has been defined in terms of the ratio (β) of the resistance to flow (R = ΔP/Q) through a filter pore in the presence and absence of cells (β = RCELLS/RBUFFER)52. In contrast, transient filtration techniques7, 16, 17 have demonstrated the ability to elucidate the heterogeneity of cell properties within a given sample. To explicitly describe the heterogeneous properties of a population of cells, prior studies have extended the bolus filtration technique described by Downey and Worthen17, to assess the average deformability of the circulating population of WBCs in terms of the yield pressure (Py) required to dislodge an individual WBC trapped within the pores of a Nuclepore filter21.
Based on analysis of the probability of entrapment, measurement of the graded clearance of trapped WBCs with increasing pressure drop across a Nuclepore filter was used to calculate a mean filtration pressure, <Py>, and the statistical distribution of PY within a WBC suspension21. These studies also suggested that the cortical shell model22 of a WBC may provide a single parameter, the cortical tension (τ0), that is representative of cell deformability. As shown therein, this analysis was extended to describe the filterability of a population of WBCs of heterogeneous diameter through the capillary network of the cremaster muscle (hamster) with a known heterogeneous distribution of capillary diameters to determine a comparable in vivo measure of (Py).
Within this framework, the present studies were undertaken to elucidate the deformability characteristics of a population of MSCs grown in culture and the relationship between MSC deformability, cell diameters and intravascular pressures encountered in the terminal microvascular network. To this end, samples of MSCs expanded in culture were analyzed by the transient filtration test to determine the relation between mean filtration pressure (PY), cortical tension (τ0), and the diameter of an MSC relative to a filter pore or microvessel diameter, λ = DCELL/DPORE.
Methods
Mesenchymal Stem Cells
Mouse (C57BL/6) mesenchymal stem cells (MSCs, GIBCO, Thermo Fisher, Inc.), cryopreserved at passage 9, were expanded in culture through about 15 passages. Cells were cultured in complete growth media consisting of minimum essential media (α-MEM) supplemented with 10% fetal bovine serum, 100 units/ml penicillin and 100μg/ml streptomycin. MSCs were lifted from the plates with TrypLE™ and suspended in growth media to yield about 106 cells per ml. Cell viability was routinely assayed by Trypan blue exclusion, and exceeded 95%. Cell concentration was adjusted to a total cell count in 0.2 ml equal to the number of pores in each filter, typically 30–85 × 103 cells.
Transient Filtration Protocol
The transient filtration method for determination of cell deformability has been described previously21. The basic approach is illustrated in Fig. 1 and modifications and improvements are summarized as follows. The underlying assumption in the test is that a cell of diameter DCELL cannot pass through a filter pore of diameter DPORE unless a minimum pressure drop (ΔP) is applied as schematized in Fig. 1A. The ΔP required for a cell to pass through a pore is dictated by the size, structure and material properties of the cell. These parameters may be related with the assumption of the cortical shell model where the cell is assumed to consist of a spherical elastic shell surrounding a viscous fluid, as described by Evans and Yeung22. For the cortical shell model shown therein, a cell entering a pore will remain in stationary equilibrium when the balance of surface forces produced by ΔP is balanced by the cortical tension (τ0, dyn/cm). The maximum pressure drop across a trapped cell before the cell flows through the pore (PY) is related to the cell to pore diameter ratio (λ = DCELL/DPORE) and the cortical tension in the shell (τ0, dyn/cm) by the relation,
| (1) |
That is, as the pressure drop (ΔP) across the cell rises above the equilibrium value PY, the cell will flow through the pore. The deformability of each cell may thus be represented by the constant of proportionality between yield pressure and cell/pore geometry, τ0. Given that the population of cells in a sample will be heterogeneous in diameter and mechanical properties, a cell sample will have statistical distributions of PY and λ that may be obtained from the washout of cells trapped in a filter with N pores.
Figure 1.
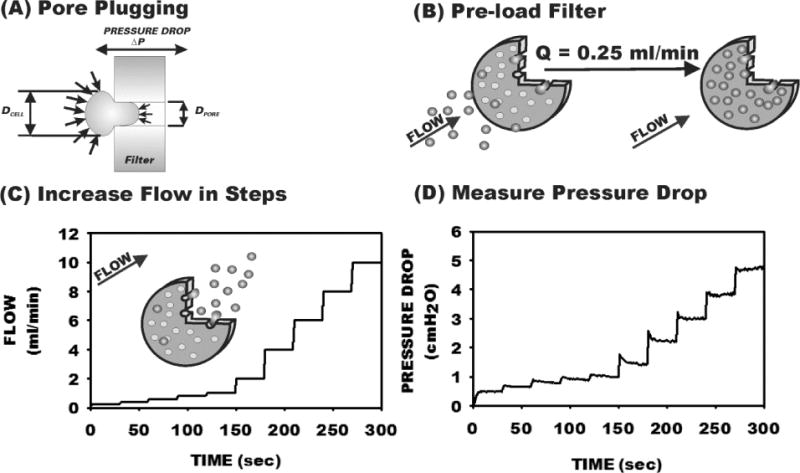
Transient filtration test procedure using Nuclepore track-etched filters. (A) Underlying basis for the test. A cell of diameter DCELL lodged in the entrance of a filter pore (with diameter DPORE) remains in equilibrium until the pressure drop (ΔP) across the filter exceeds the yield pressure (PY) dictated by the cortical shell model with cortical tension τ0. (B) A filter is loaded under low flow until 80–100% of pores are plugged. (C) The flow through the filter is increased in stepwise increments using a computer controlled syringe pump. (D) As pressure is increased, cells are washed out of pores, dependent on cell deformability and the ratio λ=DCELL/DPORE.
To evaluate the distribution of yield pressures characteristic of a cell sample the distribution of PY was obtained from the washout of cells (initially trapped at low pressure drops) in track-etched polycarbonate filters during stepwise increases in ΔP. Nuclepore track-etched polycarbonate filters (13 mm diameter and 11 μm thickess) with nominal pore diameters of 7 to 20 μm (Poretics, Inc. and Structure Probes Inc., West Chester, PA) were held in a Lucite support and perfused with either cell suspensions or buffer using a syringe pump (PhD 2000, Harvard Apparatus, Inc., Holliston, MA). An aliquot of cells (0.2 ml) was loaded in the antechamber of the filtration device, as schematized in Fig. 1B, and the filter was perfused with buffer at a very low flow rate (0.25 ml/min) until the maximum amount of pores was plugged with cells. The flow rate of buffer was then increased in stepwise increments of 30 sec duration (Fig. 1C) and the resultant pressure drop across the filter was measured (Fig. 1D). Pressure drop was measured with a differential transducer (MP-45, Validyne, Northridge, CA) with a range of 0–10 cmH2O and resolution of 0.01 cmH2O. The pump rate was controlled by computer and increased in stepwise increments every 30 sec (Fig. 1C). Pressures were digitized (12 bit A/D, Metrabyte, PCMCIA interface, Keithley Instruments, Cleveland, OH) at a rate of 103 samples/sec. As shown in Fig. 1D, with each stepwise increase in flow the pressure drop rose and then rapidly fell slightly during the first 5–10 sec as cells were washed from plugged pores. The average pressure was acquired over the last 15 sec of each step to calculate the resistance of the filter (RFILTER) and the fraction of pores plugged relative to that obtained during loading of the filter, i.e. NPLUG/NPLUG MAX.
The initial maximum number of plugged pores (NPLUG MAX) was calculated from RFILTER during loading with cells (RPLUGGED MAX = PLOAD/QLOAD). The number of plugged pores was taken as the total number of pores less the number of open pores, i.e. NPLUGGED = NTOTAL − NOPEN, where NTOTAL was obtained by microscopic examination of the filter prior to the test. The resistance of the filter (RFILTER) was assumed to reflect the resistance of N parallel unplugged (open) pores, i.e. RFILTER = RPORE/NOPEN. With increasing pressure drop across the filter, the resistance of the filter fell from that at maximum plugging (RPLUG MAX) as trapped cells were washed out. It was assumed that RFILTER results from two parallel sets of pores: (1) those initially open at maximum plugging, which contribute to RPLUG MAX, and (2) those that undergo cell washout, represented by ROPEN. The filter resistance was thus calculated from 1/RFILTER =1/ROPEN +1/RPLUG MAX. Thus, as pressure was increased with each step, the fraction of plugged pores that underwent washout (f) fell from 1 to 0 as:
| (2) |
where QMAX and PMAX are the flow and pressure at maximum flow rate (10 ml/min).
Pore diameter was calculated prior to each cell sample from measurement of pressure drop for a flow of 1 ml/min, using the theoretical formulation for resistance based on Poiseuille’s equation and entry effects, where μ is the buffer viscosity and L is the filter thickness52.
Calculation of Mean Filtration Pressure
Given that the distribution of pore sizes for a specific filter is fairly uniform (< 5% coefficient of variation21), the average yield pressures (PY) for a sample of trapped cells released from the filter was estimated by considering the probability that a cell will be washed out as pressure drop increases. As shown in Fig. 2A for a representative sample of MSCs loaded into a filter with 5.9×10⁴ pores and 9.7 μm mean pore diameter, flow (Q) increased non-linearly with filtration pressure (ΔP). The fraction of plugged pores (f = NPLUG/NPLUG MAX) fell precipitously (Fig. 2B) as ΔP increased.
Figure 2.
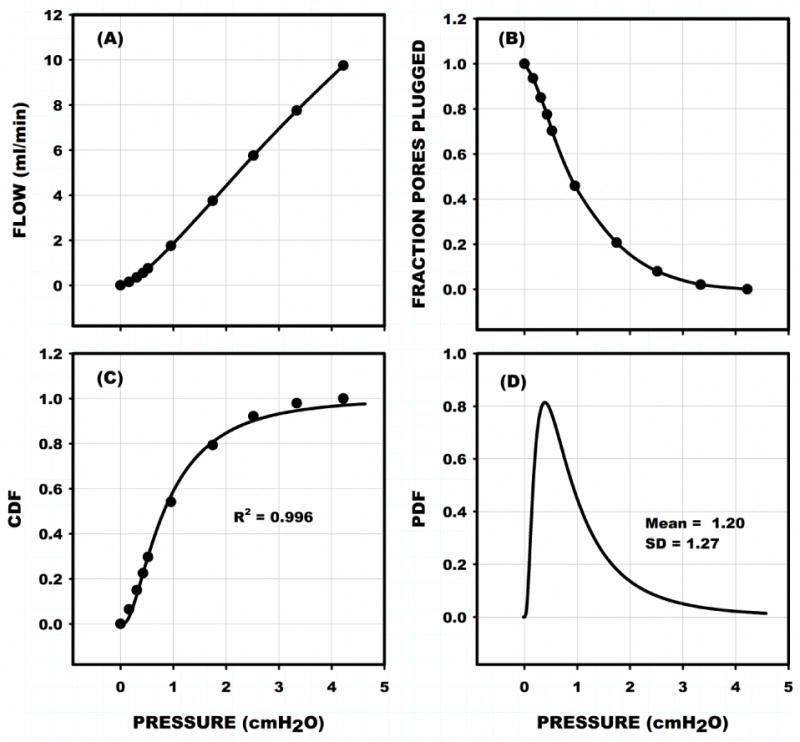
Representative filtration test for sample of MSCs loaded into a filter with 5.9×10⁴ pores and 9.7 μm mean pore diameter. (A) Resultant non-linear trend of total flow through the filter vs the equilibrium filtration pressure at each step depicted in Fig. 1. (B) Normalized fraction of pores plugged (f) during increasing pressure. (C) Cumulative density distribution (CDF) of the probability that a pore will be washed out as pressure exceeds the filtration pressure (abscissa) was obtained by fitting (1 – f) to a log normal density distribution. (D) Corresponding probability density distribution of yield pressures (PY) give the mean filtration pressure (<PY>, first moment) and standard deviation (SD, second moment) of the distribution of PY characteristic of the cell population for a given λ and cell deformability.
The cumulative distribution function representative of the probability of a cell being washed out of the filter as pressure exceeds a given ΔP was calculated as 1-f, Fig. 2C. It has been shown that the best fit of the cumulative distribution function was found to be that of a log-normal distribution21.
| (3) |
with probability density distribution (PDF) given by:
| (4) |
where PY is yield pressure and μ and σ2 are the mean and variance, respectively, of the natural log of PY. These parameters are related to the mean (<Py>) and variance (var) of yield pressures by:
| (5) |
Measurements of 1-f were fit to the CDF using the Levenberg-Marquardt algorithm, as implemented in SigmaPlot (Systat Software, Inc., San Jose, CA), The CDF for this sample was found to fit the data well with R2 = 0.996, (Fig. 2C). The corresponding PDF is shown in Fig. 2D with a mean filtration pressure of 1.2 ± 1.3 SD cmH2O.
Measurement Protocol
MSCs were lifted from their culture plates and suspended in media at a concentration of 1–2×10⁶ cells/ml. Microscopic cell counts were performed using a hemocytometer with a 10× objective. The cell suspension was filtered through a Nuclepore filter with 20 μm pore diameter to remove debris. Cell diameters were measured in a hanging drop with a Zeiss 40×/0.75NA water immersion objective for 100–300 cells from the sample. Measurements of cell count and mean cell diameter revealed no loss of cells during filtration through a 20 μm filter. Cell samples were prepared for the filtration test by dilution with media to give a total number of cells in 0.2 ml equal to the number of pores in the test filter. The test filter was perfused with media for 1 min at a flow of 1ml/min, the pressure drop recorded (typically 0.1–0.4 cmH2O), and the filter resistance (ΔP/Q) and mean pore diameter were calculated. The cell sample was introduced in the filter chamber, the filter loaded with cells at 0.25 ml/min for 2 min and the sequence of stepwise increases in flow begun. The filtration procedure was automated using code written in Microsoft Visual Basic.
Cell Morphometry
To aid interpretation of the trends of filtration pressure versus cell diameter, a small sampling of cells was stained with the fluorescent dye acridine orange (0.01% in PBS) to roughly delimit the cell nucleus relative to the cell diameter. An apparent nucleus diameter was calculated as the diameter of a circle with the nucleus area observed in the diametral plane of the cell.
Statistics
Statistical analyses were performed using SigmaPlot (Systat Software, Inc., San Jose, CA). Significance of regressions were performed using a t-test with significance of the null hypothesis taken at the 5% level or less, i.e. p < 0.05.
Results
A total of 31 filtration tests were run using 9 different cell samples and 12 different batches of filters with pore diameters ranging from 7.3 to 15.4 μm. The measured and calculated parameters are given in Table 1 for all values of mean cell diameter to pore diameter, λ=<DCELL/DPORE>, and for λ less than and greater than 1.56. This cutoff was determined by analysis of the trends of <PY> vs λ (shown in the following).
Table 1.
Summary of MSC Characteristics, Filter Dimensions, and Results
| Parameter | All λ (n = 31) |
Range (min − max) |
λ ≤ 1.56 (n = 20) |
λ > 1.56 (n = 11) |
|---|---|---|---|---|
| DPORE (um) | 10.5 ± 2.0 | 7.3 – 15.4 | 11.5 ± 1.7 | 8.54 ± 0.74 |
| DCELL (um) | 15.8 ± 0.73 | 6.0 – 23.0 | 15.8 ± 0.73 | 15.8 ± 0.73 |
| <λ> = <DCELL>/DPORE | 1.52 ± 0.24 | 1.1 – 2.2 | 1.39 ± 0.18 | 1.86 ± 0.17 |
| NPORES (103) | 62.7 ± 22.4 | 29.6 – 85.6 | 52.8 ± 21.2 | 80.5 ± 10.7 |
| Fraction Perm | 0.47 ± 0.16 | 0.09 – 0.84 | 0.42 ± 0.13 | 0.56 ± 0.17 |
| Plugged | ||||
| Fraction Washed Out | 0.41 ± 0.23 | 0.08 – 0.58 | 0.47 ± 0.23 | 0.27 ± 0.16 |
| <PY> (cmH2O) | 1.74 ± 1.67 | 0.02 – 6.7 | 0.87 ± 0.49 | 3.32 ± 1.92 |
| Std Dev of PY Dist | 1.88 ± 2.31 | 0.19 – 12.3 | 1.85 ± 2.71 | 1.96 ± 1.26 |
| μ Log Normal Mean | −0.49 ± 1.09 | −4.9 – 1.6 | −0.95 ± 0.92 | 0.34 ± 0.87 |
| σ Log Normal Std Dev | 0.96 ± 0.51 | 0.2 – 2.2 | 0.92 ± 0.53 | 1.05 ± 0.49 |
| R2 of Log Normal Fit | 0.966 ± 0.028 | 0.884 – 0.996 | 0.97 ± 0.02 | 0.95 ± 0.03 |
| τ0 (dyn/cm) | 1.55 ± 0.72† | 0.25 – 2.8* | 0.99 ± 0.42† | 1.79 ± 0.72† |
Shown are mean ± SD for measured and calculated parameters for all measurements and those divided into two groups with λ less or greater than λcutoff = 1.56 determined from the variation of λ with mean yield pressure (<PYIELD>). μ and σ are the mean and standard deviation of ln(PY), respectively. R2 is the coefficient of determination of the log normal cumulative distribution fits.
From slope of PY vs λ−1.
From ratio of PY/(λ−1).
Cell Diameters
Cell diameters were measured in 9 samples with an average mean diameter (<DCELL>) of 15.8 ± 0.73 SD μm and a range of the mean from 15.0 to 17.1 μm. A histogram of 2090 cell diameters pooled from all 9 samples is presented in Fig. 3A and revealed a mean value of 16.2 ± 3.0 SD μm (median = 16.0) with a range from 6.1 to 30.6 μm. The pooled diameters were found to be well represented by a log normal distribution, R2 = 0.989 (solid line in Fig. 3A). For a small sample of cells (N = 60), the apparent diameter of the cell nucleus was found to average 10.5 ± 2.16 SD μm, with a ratio of nucleus to cell diameter of 0.63 ± 0.09 SD μm.
Figure 3.
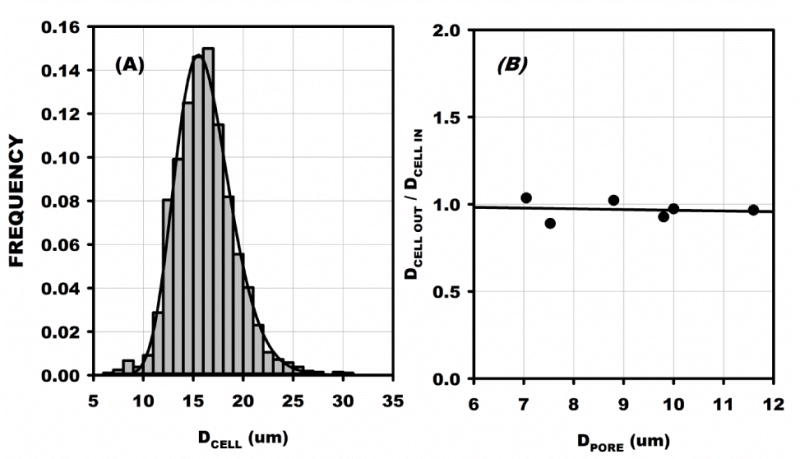
(A) Pooled distribution of MSC cell diameters for 2090 cells from 9 inflow samples. Diameter was measured in a hanging drop and averaged 16.2 ± 3.0 SD with a range from 6.1 to 30.6 μm. The average of the means of each sample was 15.8 ± 0.73 μm, which was not significantly different, p < 0.05. (B) Ratio of Inflow to outflow mean MSC diameters obtained for six filters with the indicated pore diameter. The average ratio was not significantly difference from 1, and the regression slope was not significantly different from 0.
Outflow cells were collected in six experiments and their diameter distributions measured. The ratio of mean diameter from outflow to inflow was compared to pore diameter, DPORE, Fig. 3B. No significant variation of DCELL with DPORE was found, as evidenced by R2 of its linear regression equal to 0.016, p = 0.49. Thus it appears that the larger cells in the tail of the distribution were responsible for the permanent plugging of the filter. No significant trends in skewness of the diameter distributions from inflow to outflow with diminishing pore size were discernible, presumably due to the diminishing fraction of the total inflow population that was permanently trapped as pore diameter was increased.
Filter Pore Plugging
For all 31 filtration tests, the fraction of pores initially plugged was calculated from the filter resistance upon completion of loading and averaged 0.81 ± 0.12 SD. This fraction did not vary significantly with the ratio of mean cell diameter of the sample to pore diameter, λ (= <DCELL>/DPORE), R2 = 0.007, p = 0.65 (Fig. 4A). The fraction of pores permanently plugged was calculated from the filter resistance at the maximum flow (10 ml/min) and rose significantly with increasing λ from about 30% to 70% for 1.1 < λ < 2.2 (Fig. 4B). It should be noted that permanently plugged pores do not contribute to computation of the fraction of plugged pores washed out since their resistance to flow (in parallel with the fractions open and washed out) is infinite. Examination of several filters following the test revealed that the permanently plugged pores resulted from debris (cell membrane fragments) and multiple cells lodged at a pore entrance.
Figure 4.
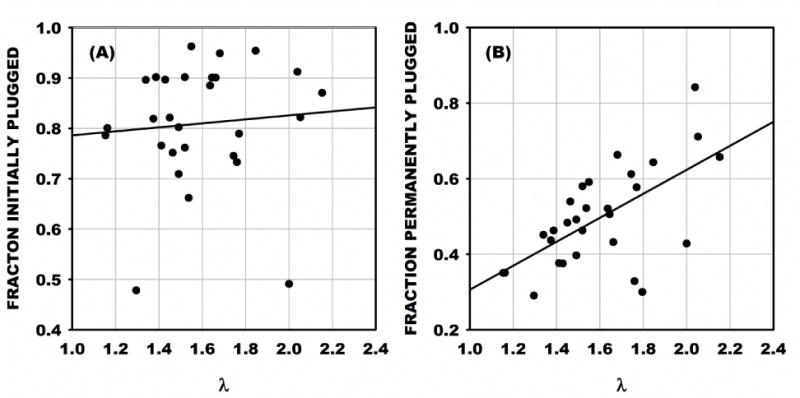
(A) Fraction of the total number of pores in each filter initially plugged with MSCs. The fraction of plugged pores averaged 0.81 ± 0.12 SD and did not increase significantly with increasing ratio of mean cell diameter to pore diameter, λ. (B) The fraction of pores permanently plugged rose significantly from 20 to 70% as λ increased from 1.1 to 2.2, as indicated by the regression with R2 = 0.38, p < 0.05.
Mean Filtration Pressure
Trends of mean filtration pressure (<PY>) vs λ are presented in Fig. 5 and revealed a significant exponential rise (solid line) given by <PY> = AeλB, with A = 0.019 (p = 0.08), B = 2.85 (p < 0.05) and R2 = 0.79. To facilitate estimation of the average cortical tension in the cell population linear regions of the curve were determined by iteratively specifying a cutoff value (λcutoff) that resulted in linear regressions above and below λcutoff that intersected at λcutoff = 1.56. It was found that for λ ≤ 1.56, <PY> varied linearly with λ, R2 = 0.31, p<0.01, and for λ > 1.56, R2 = 0.48, p < 0.03. Although both regions had significant linear regressions, for λ < 1.56 the standard error of estimate (Sy|x) equaled 0.40 vs 1.3 for λ>1.56. By comparison, for λ< 1.56 the exponential fit yielded Sy|x equal to 0.48 for the exponential fit. Thus a linear fit in this region appears as the best representation of the trends of <PY> vs λ. For λ > 1.56, the linear and exponential fits yielded values of Sy|x equal to 1.28 and 1.33, respectively. The larger errors incurred as λ rose above the cutoff may have resulted from the increase in the number of pores permanently plugged by larger cells in the population (cf. Fig. 4) and the smaller number of pores cleared with increasing pressure. Based upon the log-normal distribution of pooled diameters, the fraction of cells in the sample with λ greater than its mean was approximately 47% for all pore diameters. However, with diminishing pore diameter the fraction of cells with λ > λcutoff rose from 5% at DPORE = 15.4 μm (maximum studied), to 95% at DPORE = 7.34 μm (minimum studied). At DPORE = 10 μm, about 50% of the cells have diameters greater than λcutoff. Thus the exponential rise in mean filtration pressure and attendant increase in Sy|x with λ>λcutoff reflects the increasing fraction of pores in the sample subject to permanent plugging.
Figure 5.
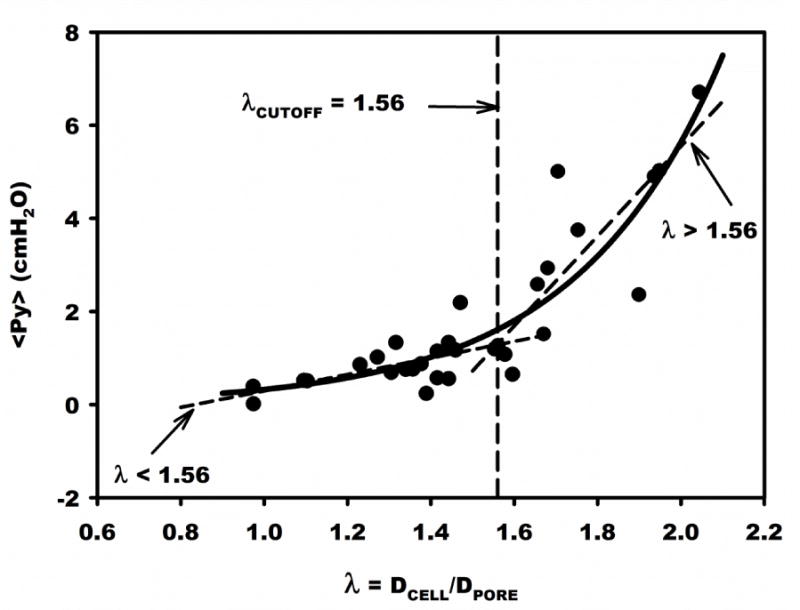
Mean filtration pressure (<PY>) vs ratio of mean cell diameter to pore diameter, λ, for 31 samples of MSCs. Solid curve is a non-linear fit of <PY>=0.019e2.85λ. Linear regressions are shown above and below λCUTOFF, which was iteratively determined as the intersection of the best linear fits.
Cortical Tension
The cortical tension (τ0) was calculated from the ratio of <PY> to λ−1 using Eq. 1 and found to average 1.33 ± 0.13 dyn/cm. Regression of τ0 vs λ−1 (Fig. 6A) revealed no significant correlation, R2 = 0.086. p =0.122. Also, τ0 was calculated from the slope of <PY> vs λ−1, obtained by linear regression of all points (N=31) forced through the origin (Fig. 6B). The slope was significant and equaled 3.95 ± 0.342 SE, with R2 = 0.608, p < 0.05. The resulting τ0 equaled 1.55 ± 0.72 SD dyn/cm. Given the exponential variation of <PY> vs λ (Fig. 5), the best estimate of τ0 consistent with the cortical shell model was calculated from the regression slope (through the origin) over its linear range 0 ≤λ≤1.56. The resultant τ0 was 0.99 ± 0.42 SD dyn/cm, with N=20, and R2 = 0.159, p < 0.2905. For λ>1.56, τ0 equaled 1.79 ± 0.72 SD dyn/cm (N = 11), which was significantly greater (p < 0.05). This range of <PY> vs λ also had a substantially larger error variance about the regression line, and thus reflected a poorer fit of the cortical shell model.
Figure 6.
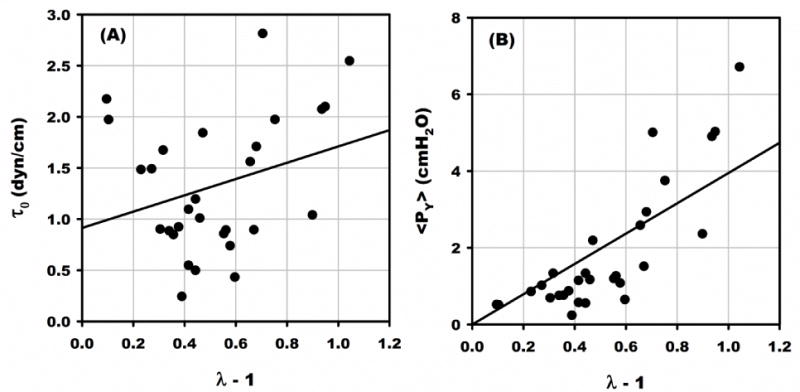
Estimates of the cortical tension τ0 using Eq. 1. (A) Cortical tension calculated from the ratio of <PY>:λ−1 (Eq. 1) for 31 samples. Linear regression (solid line) revealed no significant correlation with λ, R2 = 0.086. p =0.122. (B) Regression of <PY> vs λ−1 (forced through the origin) revealed a significant slope, R2 = 0.608, p < 0.05, from which τ0 = 1.55 ± 0.72 SD dyn/cm. This value was significantly greater than that computed from the slope of the linear regression of <PY> vs λ−1 (forced through origin) for λ < λCUTOFF (Fig. 5), which equaled 0.99 ± 0.42 SD dyn/cm, p <0.05.
Discussion
The importance of cell deformability as a determinant of blood viscosity and plugging of capillaries has spawned development of multiple approaches to its assessment. Micropipette aspiration of individual cells22, 30 and steady flow filtration of cell suspensions through Nuclepore filters29 have provided insights into the potential for plugging capillaries in the microvasculature. Steady state filtration, however, provides only an average assessment of the cell population whereas micropipette aspiration may provide an assessment of individual cells, albeit time consuming and technically challenging. In contrast, transient filtration methods may illuminate the heterogeneous properties of a population of cells16, 17. Using the cortical shell model of the cell described by Evans and Young22 the transient filtration method of Downey and Worthen17 was extended to obtain a statistical appraisal of the heterogeneous distribution of cell size and deformability21. Given 30,000 to 85,000 pores in a given filter, in some respects, the transient filtration method may be viewed as that many micropipette tests performed simultaneously on a single cell sample. Regardless of the agreement between the two approaches, the analogy between the filtration test and the capillary network is readily apparent. In previous studies of leukocytes (white blood cells, WBCs), the effect of size and deformability heterogeneity within a sample of cells with a narrow range of diameters (3–9 μm) was explored for transient filtration through filters with a 5 μm mean pore diameter with a ratio of cell diameter to pore diameter ranging 1 < λ ≤ 2 and a mean value of 1.4. To explore the properties of MSCs the present study employed a range of pore diameters from 7.3 to 15.4 μm. With a mean MSC diameter of 15.8 μm, the resultant range of mean λ was 1.0 ≤λ≤2.2. It is readily apparent that the exponential rise of mean filtration pressure (Fig. 5) with average λ is contrary to the postulated cortical shell model of the MSC which embodies a linear relationship between <PY> and λ.
The broad range of average λ afforded the opportunity to explore the applicability of the cortical shell model to describe MSC properties. As shown in Fig. 5, the mean filtration pressure was reasonably linear with λ for λ ≤ 1.56. Within this range, the mean filtration pressure (the pressure above which a cell flows through a pore) for MSCs averaged 0.87 ± 0.49 SD cmH2O (Table 1) with average λ = 1.39. This result was about 60% greater than that of the much smaller WBCs (<PY>= 0.55 cmH2O)21 and insignificantly 30% greater than the 0.67 ± 0.10 SD cmH2O found by Toma et al. for MSCs using a variation of the transient filtration method56 with 10 μm pores. The differences between the current study and those of Toma et al. may have arisen from multiple methodological issues. In these latter studies, the pore diameter used was the nominal diameter specified by the filter manufacturer, and the reported mean and average of cell diameter was substantially larger than found here found for MSCs in a hanging drop (23.6 vs the present 15.8 μm). The lower filtration pressures reported therein may have arisen due to their method of taking the mean filtration pressure as the filter pressure drop at the point of 50% of the plugged pores cleared from the filter, in contrast to taking the first moment (expected value) of the log-Normal distribution used herein. Both studies are in reasonable agreement with the fraction of pores permanently plugged: 61% therein and 48% at DPORE = 10 μm (Fig. 4B).
An analysis of the current methodology to illuminate departures from a linear (<PY> vs λ) cell model, comparisons with other studies, and pressure drops anticipated at the entrance to an in vivo microvessel, is presented in Fig. 7. Shown therein is the exponential fit of the mean filtration pressure (<PY>) calculated from the mean of the log-normal distribution at each mean λ (from Fig. 5) and an exponential fit (broken line) of the median filtration pressure (PY MEDIAN) at each mean λ. The median value is the pressure at which half the filter pores become unplugged as flow and pressure are increased. Non-linear regression of median PY vs λ resulted in PY = 0.032e2.1λ, R2=0.38, p < 0.05. Due to the skewness of the log-normal distribution of PY, the median value is about 50% of <PY> at λ = 1.56 and 30% of <PY> at λ = 2.1. Thus, the lower filtration pressures obtained by Toma et al.56 may be the result of using the filtration pressure at 50% clearance of the filter.
Figure 7.
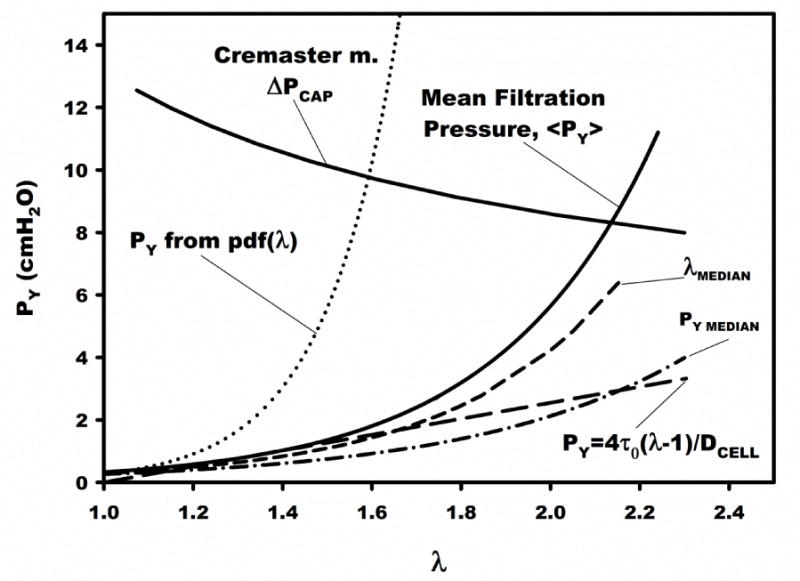
Mean filtration pressure vs ratio of mean cell to pore diameter, λ. The exponential fit of the mean filtration pressure (Fig. 5) is shown (solid curve). A curve of the average pressure drop at a microvessel entrance was constructed from in vivo pressure measurements6. The dotted curve (PY from pdf(λ)) is the filtration pressure computed assuming all cells in the population had a filtration pressure given by the exponential fit of Fig. 5. The short dashed curve (λMEDIAN) corresponds to the variation of PY vs λ calculated from the fit of the experimental data (Fig. 5) for λ at 50% (median) of the cell diameter distribution. The broken curve (PY MEDIAN) represents an exponential fit of the median value of PY in each distribution for measurements at a given λ, and represents the pressure at which 50% of pores are cleared from each filter (e.g. CDF=0.5 in Fig 2C). The dashed straight line represents the relationship between PY and λ for τ0 = 0.99 dyn/cm (Table 1). These curves define the bounds of the anticipated filtration pressure for a given λ, relative to the average microvascular pressure drop.
The effect of skewness of cell diameter in the population of MSCs presented to each filter was estimated by applying the exponential correlation of <PY> vs λ (Fig. 5) to calculate PY for the median λ (= λMEDIAN) of each sample. This trend is shown in Fig. 7 as the dashed curve and reveals a PY that is 80% of the mean filtration pressure (<PY>) at λ = 1.56 that increases to 40% of <PY> at λ = 2.1. Thus within the linear range of <PY> vs λ (i.e. λ ≤ 1.56) the larger diameter cells that skew the diameter distribution contribute to at most about 20% of the mean filtration pressure.
The exponential relationship between <PY> and mean λ (Fig. 5) averages the dependency of <PY> over all cell diameters in a sample for a given pore size. Thus the heterogeneity of mechanical properties in the cell sample is not readily apparent. That heterogeneity could be explicitly demonstrated if cells were separated according to cell size prior to filtration. However, doing so would require additional cell manipulations. Alternatively, the effect of heterogeneous cell properties can be demonstrated by calculating the PY at each value of DCELL in the diameter distribution (Fig. 3A) from the exponential fit (Fig. 5) for a given sample run with a specific DPORE. For a filter with a uniform pore size DPORE, the resultant filtration pressure then takes on the frequency distribution of λ within the sample. This approach was taken by normalizing (to unit area) the frequency distribution of λ for each filter to obtain its probability density distribution (pdf) and then using that pdf as the frequency distribution of PY computed from the mean filtration pressure (Fig. 5) for a given value of λ in the sample. This procedure resulted in the exponential variation of PY (dotted line in Fig. 7) that would be the hypothetical value of filtration pressure if all cells had mechanical properties equal to that of the mean population. These trends were well represented by the exponential fit (dotted line, Fig. 7) of PY = 5×10⁻⁴e6.1λ. Hence with increasing values of λ (i.e. decreasing pore size), the disparity between PY from the pdf of λ and the mean filtration pressure (<PY>) appears to increase dramatically from 5-fold at λ = 1.56 to 200-fold at λ = 2.1. This difference reflects the non-uniform distribution of PY for a given cell sample, as suggested by the log-normal fits of filtration pressure for a given DPORE.
Based upon the linearity of PY vs λ for 1 ≤ λ ≤ 1.56, the best estimate of the cortical tension τ0 was 0.99 dyn/cm. Using this value, PY was calculated over the entire range of λ, as shown by the dashed line in Fig. 7. Interestingly, a comparable value of 0.89 dyn/cm was found by Toma et al.56. In contrast, substantially smaller values of τ0 were found for WBCs; 0.28 dyn/cm for hamster WBCs (DCELL = 6.4 μm) examined by transient filtration21, and 0.035 dyn/cm for human granulocytes (DCELL = 8.5 μm) determined by micropipette aspiration22. These cortical tensions are significantly higher than that found to resist separation of the cell membrane from the cortical cytoskeleton, which was about 0.0015 dyn/cm as determined by laser tweezers55. The much greater apparent cortical tension found by filtration may thus reflect the contribution of the MSC nucleus to resisting deformation upon entry into a pore, as suggested by the micropipette studies of Ribeiro and Dahl47. As shown therein, the creep function representative of a cell entering a pore under constant pressure loading initially rises rapidly as the membrane is aspirated and then much more slowly as the stiffer nucleus enters the pore. Although no studies are shown as a function of pore diameter, this behavior is consistent with the exponential rise in <PY> as λ exceeds 1.56 (Fig. 5). The size of the MSC nucleus relative to cell diameter found here was consistent with the observations of Ribeiro and Dahl. The current measurements of the ratio of cell to nucleus diameter equaled 1.62 ± 0.23 SD. Thus, the exponential rise in yield pressure beginning at λcutoff=1.56 (Fig. 5) occurs when the cell nucleus must begin to deform.
To address the in vivo significance of these data on the potential for microvascular entrapment of MSCs, presented in Fig. 7 is the distribution of microvascular pressures estimated across the capillary bed in cremaster muscle (ΔPCAP). These pressures correspond to a conservatively high estimate of the average pressure drop expected across a cell lodged in the entrance to a microvessel. This distribution of pressures was calculated from the measurements of Bohlen et al. in cremaster muscle of the normotensive rat6. Presented therein are measurements of intravascular pressures in arterioles feeding the true capillaries as a function of arteriolar diameter, and venular pressure draining the true capillaries. The average pressure drop across a sequestered cell (ΔPCAP) was estimated as the difference between arteriolar pressure in a microvessel of a given diameter and venular pressure draining the capillaries. The value of λ was taken as the ratio of average MSC diameter to arteriolar diameter, hence implying a bifurcating arteriole with three equal sized branches. As noted in Fig. 7, all mean filtration pressures (<PY>) were less than the estimated ΔPCAP, which suggests that 100% of the cells would pass through the capillary bed for a mean λ ≤ 2.1 (equivalent microvessel diameter of 7.5 μm). For λ > 2.1, less than 100% of the cells would pass through the capillaries. Based upon the exponential rise of <PY>, for an average capillary diameter6 of 5.4 μm (λ=3.0) mean filtration pressure would exceed capillary pressure drop by a ratio of 97:7. Direct measurements of the in situ distribution of capillary pressures and diameters reveal a substantial coefficient of variation (SD/mean) that ranges from 0.25 in cremaster muscle6 to 0.45 in tenuissimus muscle24. Thus for λ less than the intersection of <PY> and ΔPCAP, passage of MSCs through the capillary bed may be substantially less than 100%, and above it sequestration may be mitigated. It has been reported that on the order of 90% of MSCs injected into arterioles of cremaster muscle became trapped in the capillary network, which resulted in a 27% reduction of flow through the network56. It has been shown previously, for WBCs infused into cremaster muscle, that the effect of cell sequestration on the resistance to flow, and hence throughput of the network, is strongly dependent upon the cumulative number of cells infused19. As shown therein, flow resistance across the capillary bed rose 2.5-fold with successive bolus injections of activated WBCs as the capillary network became plugged. These activated WBCs had an estimated mean filtration pressure comparable to MSCs of about 1 cmH2O with λCAP = 1.321.
Studies of the passage of WBCs through cremaster muscle have suggested that the correspondence between cell deformability and microvascular entrapment depends on network topography and flow conditions20. As shown therein, in response to bolus infusions of WBCs sequestration was mitigated by redistribution of WBCs through pathways of lesser resistance. Based upon the mean transit time of WBCs and plasma, it was demonstrated that effective cell concentration in the cremaster muscle was not significantly different for WBCs vs red cells, until pressure gradients in the network were reduced by hemorrhagic hypotension. Preliminary experiments in this laboratory of bolus infusions of fluorescently labeled MSCs into mouse cremaster muscle (unpublished data) revealed a 50% greater ratio of MSC transit time to plasma compared to WBCs, with about 25% sequestration of the MSCs calculated by conservation of mass flow.
In summary, the current studies have applied the transient filtration method to quantitate MSC deformability. It appears that the cortical shell model of the MSC may be applicable to describing MSC mechanical properties for values of cell to pore diameter λ < 1.56. For a given sample of MSCs, it is apparent that the distribution of filtration (yield pressures) required for cell passage through a pore (or capillary) is well represented by a log-normal distribution that accounts for the distribution of cell size and deformability within the sample. Ignoring the tail of the yield pressure distribution by taking the median value of filtration pressure leads to a significantly lower estimate of filtration pressures. It is clear that although the transient filtration method can delineate the effects of heterogeneity of size and deformability on the mean filtration pressure (<PY>) of a sample additional studies are needed to assess these differences for fractions of cells separated according to size. Doing so may not be straight-forward since harvested MSCs rapidly undergo morphological changes with and without differentiation53 as well as, presumably, changes in their mechanical properties. It is evident that further studies are warranted and the transient filtration method may be a useful tool in establishing a quantitative foundation for these observations.
The current findings also suggest that the heterogeneity in MSC mechanical properties may significantly affect the number of cells sequestered at a desired site, which may in turn influence the regenerative outcome. Less deformable cells may be sequestered upstream and impair flow and convective transport of cells to the targeted site. Conversely, more deformable cells may pass through the microvascular network without entrapment, and lessen the total accumulation of cells. Hence, separating the cell population according to deformability may serve to optimize the fraction of cells trapped. The specific site of sequestration will of course depend on the topography of the network. In the context of cardiac tissue regeneration, the present analysis of potential entrapment has utilized hemodynamic data from the rat cremaster muscle, mainly due to a lack of similar data for the beating heart and human subjects. While there are, however, similarities between the cardiac microvasculature and cremaster muscle, the branching patterns and microvessel diameters are quite different. Nonetheless, the basic cell mechanics described herein may guide the development of future approaches to MSC delivery in cardiac tissue regeneration.
Acknowledgments
Supported in part by NIH research grants HL39286 and AR065192.
Footnotes
Conflict of Interest:
No conflicts of interest are apparent.
References
- 1.Badylak SF, Nerem RM. Progress in tissue engineering and regenerative medicine. Proc Natl Acad Sci U S A. 2010;107:3285–3286. doi: 10.1073/pnas.1000256107. [DOI] [PMC free article] [PubMed] [Google Scholar]
- 2.Barbash IM, Chouraqui P, Baron J, Feinberg MS, Etzion S, Tessone A, Miller L, Guetta E, Zipori D, Kedes LH, Kloner RA, Leor J. Systemic delivery of bone marrow-derived mesenchymal stem cells to the infarcted myocardium: feasibility, cell migration, and body distribution. Circulation. 2003;108:863–868. doi: 10.1161/01.CIR.0000084828.50310.6A. [DOI] [PubMed] [Google Scholar]
- 3.Bartsch T, Brehm M, Zeus T, Kogler G, Wernet P, Strauer BE. Transplantation of autologous mononuclear bone marrow stem cells in patients with peripheral arterial disease (the TAM-PAD study) Clin Res Cardiol. 2007;96:891–899. doi: 10.1007/s00392-007-0569-x. [DOI] [PubMed] [Google Scholar]
- 4.Behr L, Hekmati M, Fromont G, Borenstein N, Noel LH, Lelievre-Pegorier M, Laborde K. Intra renal arterial injection of autologous mesenchymal stem cells in an ovine model in the postischemic kidney. Nephron Physiol. 2007;107:65–76. doi: 10.1159/000109821. [DOI] [PubMed] [Google Scholar]
- 5.Behr L, Hekmati M, Lucchini A, Houcinet K, Faussat AM, Borenstein N, Noel LH, Lelievre-Pegorier M, Laborde K. Evaluation of the effect of autologous mesenchymal stem cell injection in a large-animal model of bilateral kidney ischaemia reperfusion injury. Cell Prolif. 2009;42:284–297. doi: 10.1111/j.1365-2184.2009.00591.x. [DOI] [PMC free article] [PubMed] [Google Scholar]
- 6.Bohlen HG, Gore RW, Hutchins PM. Comparison of microvascular pressures in normal and spontaneously hypertensive rats. Microvascular Research. 1977;13:125–130. doi: 10.1016/0026-2862(77)90121-2. [DOI] [PubMed] [Google Scholar]
- 7.Braide M, Nannmark U, Bagge U. Bolus Filtration of Leukocytes – a Method to Study the Pressure-Dependence of Leukocyte Filter Pore Passage Time Distributions. Clinical Hemorheology. 1991;11:369–382. [Google Scholar]
- 8.Caplan AI, Dennis JE. Mesenchymal stem cells as trophic mediators. J Cell Biochem. 2006;98:1076–1084. doi: 10.1002/jcb.20886. [DOI] [PubMed] [Google Scholar]
- 9.Cha S, Shin T, Lee SS, Shim W, Lee G, Lee SJ, Kim Y, Kim JM. Cell stretching measurement utilizing viscoelastic particle focusing. Anal Chem. 2012;84:10471–10477. doi: 10.1021/ac302763n. [DOI] [PubMed] [Google Scholar]
- 10.Chien S, Schmalzer EA, Lee MM, Impelluso T, Skalak R. Role of white blood cells in filtration of blood cell suspensions. Biorheology. 1983;20:11–27. doi: 10.3233/bir-1983-20102. [DOI] [PubMed] [Google Scholar]
- 11.Dahl KN, Engler AJ, Pajerowski JD, Discher DE. Power-law rheology of isolated nuclei with deformation mapping of nuclear substructures. Biophysical Journal. 2005;89:2855–2864. doi: 10.1529/biophysj.105.062554. [DOI] [PMC free article] [PubMed] [Google Scholar]
- 12.Darling EM, Topel M, Zauscher S, Vail TP, Guilak F. Viscoelastic properties of human mesenchymally-derived stem cells and primary osteoblasts, chondrocytes, and adipocytes. J Biomech. 2008;41:454–464. doi: 10.1016/j.jbiomech.2007.06.019. [DOI] [PMC free article] [PubMed] [Google Scholar]
- 13.Dazzi F, Horwood NJ. Potential of mesenchymal stem cell therapy. Curr Opin Oncol. 2007;19:650–655. doi: 10.1097/CCO.0b013e3282f0e116. [DOI] [PubMed] [Google Scholar]
- 14.Donndorf P, Strauer BE, Haverich A, Steinhoff G. Stem cell therapy for the treatment of acute myocardial infarction and chronic ischemic heart disease. Curr Pharm Biotechnol. 2013;14:12–19. [PubMed] [Google Scholar]
- 15.Donndorf P, Strauer BE, Steinhoff G. Update on cardiac stem cell therapy in heart failure. Curr Opin Cardiol. 2012;27:154–160. doi: 10.1097/HCO.0b013e32834fe969. [DOI] [PubMed] [Google Scholar]
- 16.Downey GP, Doherty DE, Schwab B, 3rd, Elson EL, Henson PM, Worthen GS. Retention of leukocytes in capillaries: role of cell size and deformability. J Appl Physiol (1985) 1990;69:1767–1778. doi: 10.1152/jappl.1990.69.5.1767. [DOI] [PubMed] [Google Scholar]
- 17.Downey GP, Worthen GS. Neutrophil retention in model capillaries: deformability, geometry, and hydrodynamic forces. J Appl Physiol (1985) 1988;65:1861–1871. doi: 10.1152/jappl.1988.65.4.1861. [DOI] [PubMed] [Google Scholar]
- 18.Engler RL, Schmid-Schonbein GW, Pavelec RS. Leukocyte capillary plugging in myocardial ischemia and reperfusion in the dog. Am J Pathol. 1983;111:98–111. [PMC free article] [PubMed] [Google Scholar]
- 19.Eppihimer MJ, Lipowsky HH. Effects of leukocyte-capillary plugging on the resistance to flow in the microvasculature of cremaster muscle for normal and activated leukocytes. Microvascular Research. 1996;51:187–201. doi: 10.1006/mvre.1996.0020. [DOI] [PubMed] [Google Scholar]
- 20.Eppihimer MJ, Lipowsky HH. Leukocyte sequestration in the microvasculature in normal and low flow states. American Journal of Physiology. 1994;267:H1122–1134. doi: 10.1152/ajpheart.1994.267.3.H1122. [DOI] [PubMed] [Google Scholar]
- 21.Eppihimer MJ, Lipowsky HH. The mean filtration pressure of leukocyte suspensions and its relation to the passage of leukocytes through nuclepore filters and capillary networks. Microcirculation. 1994;1:237–250. doi: 10.3109/10739689409146751. [DOI] [PubMed] [Google Scholar]
- 22.Evans E, Yeung A. Apparent viscosity and cortical tension of blood granulocytes determined by micropipet aspiration. Biophysical Journal. 1989;56:151–160. doi: 10.1016/S0006-3495(89)82660-8. [DOI] [PMC free article] [PubMed] [Google Scholar]
- 23.Freyman T, Polin G, Osman H, Crary J, Lu M, Cheng L, Palasis M, Wilensky RL. A quantitative, randomized study evaluating three methods of mesenchymal stem cell delivery following myocardial infarction. Eur Heart J. 2006;27:1114–1122. doi: 10.1093/eurheartj/ehi818. [DOI] [PubMed] [Google Scholar]
- 24.Fronek K, Zweifach BW. Microvascular pressure distribution in skeletal muscle and the effect of vasodilation. American Journal of Physiology. 1975;228:791–796. doi: 10.1152/ajplegacy.1975.228.3.791. [DOI] [PubMed] [Google Scholar]
- 25.Furlani D, Ugurlucan M, Ong L, Bieback K, Pittermann E, Westien I, Wang W, Yerebakan C, Li W, Gaebel R, Li RK, Vollmar B, Steinhoff G, Ma N. Is the intravascular administration of mesenchymal stem cells safe? Mesenchymal stem cells and intravital microscopy. Microvasc Res. 2009;77:370–376. doi: 10.1016/j.mvr.2009.02.001. [DOI] [PubMed] [Google Scholar]
- 26.Giordano A, Galderisi U, Marino IR. From the laboratory bench to the patient’s bedside: an update on clinical trials with mesenchymal stem cells. J Cell Physiol. 2007;211:27–35. doi: 10.1002/jcp.20959. [DOI] [PubMed] [Google Scholar]
- 27.Gnecchi M, He H, Noiseux N, Liang OD, Zhang L, Morello F, Mu H, Melo LG, Pratt RE, Ingwall JS, Dzau VJ. Evidence supporting paracrine hypothesis for Akt-modified mesenchymal stem cell-mediated cardiac protection and functional improvement. FASEB J. 2006;20:661–669. doi: 10.1096/fj.05-5211com. [DOI] [PubMed] [Google Scholar]
- 28.Gossett DR, Tse HT, Lee SA, Ying Y, Lindgren AG, Yang OO, Rao J, Clark AT, Di Carlo D. Hydrodynamic stretching of single cells for large population mechanical phenotyping. Proc Natl Acad Sci U S A. 2012;109:7630–7635. doi: 10.1073/pnas.1200107109. [DOI] [PMC free article] [PubMed] [Google Scholar]
- 29.Gregersen MI, Bryant CA, Hammerle WE, Usami S, Chien S. Flow Characteristics of Human Erythrocytes through Polycarbonate Sieves. Science. 1967;157:825–827. doi: 10.1126/science.157.3790.825. [DOI] [PubMed] [Google Scholar]
- 30.Hochmuth RM, Needham D. The viscosity of neutrophils and their transit times through small pores. Biorheology. 1990;27:817–828. doi: 10.3233/bir-1990-27603. [DOI] [PubMed] [Google Scholar]
- 31.House SD, Lipowsky HH. In vivo determination of the force of leukocyte-endothelium adhesion in the mesenteric microvasculature of the cat. Circ Res. 1988;63:658–668. doi: 10.1161/01.res.63.3.658. [DOI] [PubMed] [Google Scholar]
- 32.Ji QQ, Du GS, van Uden MJ, Fang Q, den Toonder JM. Microfluidic cytometer based on dual photodiode detection for cell size and deformability analysis. Talanta. 2013;111:178–182. doi: 10.1016/j.talanta.2013.03.004. [DOI] [PubMed] [Google Scholar]
- 33.Jungmann PM, Mehlhorn AT, Schmal H, Schillers H, Oberleithner H, Sudkamp NP. Nanomechanics of human adipose-derived stem cells: small GTPases impact chondrogenic differentiation. Tissue Eng Part A. 2012;18:1035–1044. doi: 10.1089/ten.TEA.2011.0507. [DOI] [PubMed] [Google Scholar]
- 34.Kavanagh DP, Yemm AI, Alexander JS, Frampton J, Kalia N. Enhancing the adhesion of hematopoietic precursor cell integrins with hydrogen peroxide increases recruitment within murine gut. Cell Transplant. 2013;22:1485–1499. doi: 10.3727/096368912X653192. [DOI] [PubMed] [Google Scholar]
- 35.Kavanagh DP, Yemm AI, Zhao Y, Frampton J, Kalia N. Mechanisms of adhesion and subsequent actions of a haematopoietic stem cell line, HPC-7, in the injured murine intestinal microcirculation in vivo. PLoS One. 2013;8:e59150. doi: 10.1371/journal.pone.0059150. [DOI] [PMC free article] [PubMed] [Google Scholar]
- 36.Lincoln B, Schinkinger S, Travis K, Wottawah F, Ebert S, Sauer F, Guck J. Reconfigurable microfluidic integration of a dual-beam laser trap with biomedical applications. Biomed Microdevices. 2007;9:703–710. doi: 10.1007/s10544-007-9079-x. [DOI] [PubMed] [Google Scholar]
- 37.Lincoln B, Wottawah F, Schinkinger S, Ebert S, Guck J. High-throughput rheological measurements with an optical stretcher. Methods Cell Biol. 2007;83:397–423. doi: 10.1016/S0091-679X(07)83017-2. [DOI] [PubMed] [Google Scholar]
- 38.Lipowsky HH, Cram LE, Justice W, Eppihimer MJ. Effect of Erythrocyte Deformability on in-Vivo Red-Cell Transit-Time and Hematocrit and Their Correlation with in-Vitro Filterability. Microvascular Research. 1993;46:43–64. doi: 10.1006/mvre.1993.1034. [DOI] [PubMed] [Google Scholar]
- 39.Lipowsky HH, Scott DA, Cartmell JS. Leukocyte rolling velocity and its relation to leukocyte-endothelium adhesion and cell deformability. Am J Physiol. 1996;270:H1371–1380. doi: 10.1152/ajpheart.1996.270.4.H1371. [DOI] [PubMed] [Google Scholar]
- 40.Lo CY, Antonopoulos A, Dell A, Haslam SM, Lee T, Neelamegham S. The use of surface immobilization of P-selectin glycoprotein ligand-1 on mesenchymal stem cells to facilitate selectin mediated cell tethering and rolling. Biomaterials. 2013;34:8213–8222. doi: 10.1016/j.biomaterials.2013.07.033. [DOI] [PMC free article] [PubMed] [Google Scholar]
- 41.Maggakis-Kelemen C, Biselli M, Artmann GM. Determination of the elastic shear modulus of cultured human red blood cells. Biomed Tech (Berl) 2002;47(Suppl 1 Pt 1):106–109. doi: 10.1515/bmte.2002.47.s1a.106. [DOI] [PubMed] [Google Scholar]
- 42.Maloney JM, Nikova D, Lautenschlager F, Clarke E, Langer R, Guck J, Van Vliet KJ. Mesenchymal stem cell mechanics from the attached to the suspended state. Biophysical Journal. 2010;99:2479–2487. doi: 10.1016/j.bpj.2010.08.052. [DOI] [PMC free article] [PubMed] [Google Scholar]
- 43.McBeath R, Pirone DM, Nelson CM, Bhadriraju K, Chen CS. Cell shape, cytoskeletal tension, and RhoA regulate stem cell lineage commitment. Dev Cell. 2004;6:483–495. doi: 10.1016/s1534-5807(04)00075-9. [DOI] [PubMed] [Google Scholar]
- 44.Melder RJ, Kristensen CA, Munn LL, Jain RK. Modulation of A-NK cell rigidity: In vitro characterization and in vivo implications for cell delivery. Biorheology. 2001;38:151–159. [PubMed] [Google Scholar]
- 45.Pittenger MF, Mackay AM, Beck SC, Jaiswal RK, Douglas R, Mosca JD, Moorman MA, Simonetti DW, Craig S, Marshak DR. Multilineage potential of adult human mesenchymal stem cells. Science. 1999;284:143–147. doi: 10.1126/science.284.5411.143. [DOI] [PubMed] [Google Scholar]
- 46.Reinhart WH, Chien S. The Time Course of Filtration Test as a Model for Microvascular Plugging by White Cells and Hardened Red-Cells. Microvascular Research. 1987;34:1–12. doi: 10.1016/0026-2862(87)90075-6. [DOI] [PubMed] [Google Scholar]
- 47.Ribeiro AS, Dahl KN. The nucleus as a central structure in defining the mechanical properties of stem cells. Conf Proc IEEE Eng Med Biol Soc. 2010;2010:831–834. doi: 10.1109/IEMBS.2010.5626785. [DOI] [PubMed] [Google Scholar]
- 48.Ruster B, Gottig S, Ludwig RJ, Bistrian R, Muller S, Seifried E, Gille J, Henschler R. Mesenchymal stem cells display coordinated rolling and adhesion behavior on endothelial cells. Blood. 2006;108:3938–3944. doi: 10.1182/blood-2006-05-025098. [DOI] [PubMed] [Google Scholar]
- 49.Sackstein R, Merzaban JS, Cain DW, Dagia NM, Spencer JA, Lin CP, Wohlgemuth R. Ex vivo glycan engineering of CD44 programs human multipotent mesenchymal stromal cell trafficking to bone. Nat Med. 2008;14:181–187. doi: 10.1038/nm1703. [DOI] [PubMed] [Google Scholar]
- 50.Schlosser S, Dennler C, Schweizer R, Eberli D, Stein JV, Enzmann V, Giovanoli P, Erni D, Plock JA. Paracrine effects of mesenchymal stem cells enhance vascular regeneration in ischemic murine skin. Microvascular Research. 2012;83:267–275. doi: 10.1016/j.mvr.2012.02.011. [DOI] [PubMed] [Google Scholar]
- 51.Segers VF, Van Riet I, Andries LJ, Lemmens K, Demolder MJ, De Becker AJ, Kockx MM, De Keulenaer GW. Mesenchymal stem cell adhesion to cardiac microvascular endothelium: activators and mechanisms. Am J Physiol Heart Circ Physiol. 2006;290:H1370–1377. doi: 10.1152/ajpheart.00523.2005. [DOI] [PubMed] [Google Scholar]
- 52.Skalak R, Impelluso T, Schmalzer EA, Chien S. Theoretical modeling of filtration of blood cell suspensions. Biorheology. 1983;20:41–56. doi: 10.3233/bir-1983-20104. [DOI] [PubMed] [Google Scholar]
- 53.Sliogeryte K, Thorpe SD, Lee DA, Botto L, Knight MM. Stem cell differentiation increases membrane-actin adhesion regulating cell blebability, migration and mechanics. Scientific Reports. 2014;4:7307. doi: 10.1038/srep07307. [DOI] [PMC free article] [PubMed] [Google Scholar]
- 54.Sokolova IB, I, Sergeev V, Bilibina AA, Anisimov SV, Dvoretsky DP. Effect of intracerebral transplantation of mesenchymal stem cells on pial microcirculation in rats. Bull Exp Biol Med. 2013;155:134–138. doi: 10.1007/s10517-013-2098-0. [DOI] [PubMed] [Google Scholar]
- 55.Titushkin I, Cho M. Distinct membrane mechanical properties of human mesenchymal stem cells determined using laser optical tweezers. Biophysical Journal. 2006;90:2582–2591. doi: 10.1529/biophysj.105.073775. [DOI] [PMC free article] [PubMed] [Google Scholar]
- 56.Toma C, Wagner WR, Bowry S, Schwartz A, Villanueva F. Fate of culture-expanded mesenchymal stem cells in the microvasculature: in vivo observations of cell kinetics. Circ Res. 2009;104:398–402. doi: 10.1161/CIRCRESAHA.108.187724. [DOI] [PMC free article] [PubMed] [Google Scholar]
- 57.Tuche F, Menger MD, Korbel C, Nickels RM, Bouskela E, Schramm R. Progenitor cell homing in the postischemic myocardium: just an unmotivated pitstop in the microcirculation? Microcirculation. 2012;19:739–748. doi: 10.1111/j.1549-8719.2012.00212.x. [DOI] [PubMed] [Google Scholar]
- 58.Vajkoczy P, Blum S, Lamparter M, Mailhammer R, Erber R, Engelhardt B, Vestweber D, Hatzopoulos AK. Multistep nature of microvascular recruitment of ex vivo-expanded embryonic endothelial progenitor cells during tumor angiogenesis. J Exp Med. 2003;197:1755–1765. doi: 10.1084/jem.20021659. [DOI] [PMC free article] [PubMed] [Google Scholar]
- 59.Walczak P, Zhang J, Gilad AA, Kedziorek DA, Ruiz-Cabello J, Young RG, Pittenger MF, van Zijl PC, Huang J, Bulte JW. Dual-modality monitoring of targeted intraarterial delivery of mesenchymal stem cells after transient ischemia. Stroke. 2008;39:1569–1574. doi: 10.1161/STROKEAHA.107.502047. [DOI] [PMC free article] [PubMed] [Google Scholar]
- 60.Wang JH, Ka WB, Tang ZY, Sun DG, Wen ZY. Rheological studies on precursor cells at different stages in mice. Clinical Hemorheology and Microcirculation. 2003;29:63–69. [PubMed] [Google Scholar]
- 61.White RL, Nash G, Kavanagh DP, Savage CO, Kalia N. Modulating the Adhesion of Haematopoietic Stem Cells with Chemokines to Enhance Their Recruitment to the Ischaemically Injured Murine Kidney. PLoS One. 2013;8:e66489. doi: 10.1371/journal.pone.0066489. [DOI] [PMC free article] [PubMed] [Google Scholar]
- 62.Wollert KC, Drexler H. Clinical applications of stem cells for the heart. Circ Res. 2005;96:151–163. doi: 10.1161/01.RES.0000155333.69009.63. [DOI] [PubMed] [Google Scholar]
- 63.Zhang W, Kai K, Choi DS, Iwamoto T, Nguyen YH, Wong H, Landis MD, Ueno NT, Chang J, Qin L. Microfluidics separation reveals the stem-cell-like deformability of tumor-initiating cells. Proc Natl Acad Sci U S A. 2012;109:18707–18712. doi: 10.1073/pnas.1209893109. [DOI] [PMC free article] [PubMed] [Google Scholar]
- 64.Zhang W, Liu XC, Yang L, Zhu DL, Zhang YD, Chen Y, Zhang HY. Wharton’s jelly-derived mesenchymal stem cells promote myocardial regeneration and cardiac repair after miniswine acute myocardial infarction. Coron Artery Dis. 2013;24:549–558. doi: 10.1097/MCA.0b013e3283640f00. [DOI] [PubMed] [Google Scholar]