Abstract
Background
We propose a method for estimating the timing of in-bed intervals using objective data in a large representative US sample, and quantify the association between these intervals and age, sex, and day of the week.
Methods
The study included 11,951 participants 6 years and older from the National Health and Nutrition Examination Survey (NHANES) 2003–2006, who wore accelerometers to measure physical activity for seven consecutive days. Participants were instructed to remove the device just before the nighttime sleep period and put it back on immediately after. This nighttime period of non-wear was defined in this paper as the objective bedtime (OBT), an objectively estimated record of the in-bed interval. For each night of the week, we estimated two measures: the duration of the OBT (OBT-D) and, as a measure of the chronotype, the midpoint of the OBT (OBT-M). We estimated day-of-the-week-specific OBT-D and OBT-M using gender-specific population percentile curves. Differences in OBT-M (chronotype) and OBT-D (the amount of time spent in bed) by age and sex were estimated using regression models.
Results
The estimates of OBT-M and their differences among age groups were consistent with the estimates of chronotype obtained via self-report in European populations. The average OBT-M varied significantly by age, while OBT-D was less variable with age. In the reference group (females, aged 17–22 years), the average OBT-M across 7 days was 4:19 AM (SD = 30 min) and the average OBT-D was 9 h 19 min (SD = 12 min). In the same age group the average OBT-D was 18 minutes shorter for males than for females, while the average OBT-M was not significantly different between males and females. The most pronounced differences were observed between OBT-M of weekday and weekend nights. In the reference group, compared to the average OBT-M of 3:50 am on Monday through Thursday nights, there was a 57-minute delay in OBT-M on Friday nights (entering the weekend), a 69-minute delay on Saturday nights (staying in the weekend), and a 23-minute delay on Sunday night (leaving the weekend). For both OBT-M and OBT-D, in most age groups and for most days of the week, there were no statistically significant differences between males and females, except for OBT-D on Wednesdays and Thursdays, with males having 31 (p-value < 0.05) and 45 (p-value < 0.05) minutes shorter OBT-D, respectively.
Conclusions
The proposed measures, OBT-D and OBT-M, provide useful information of time in bed and chronotype in NHANES 2003–2006. They identify within-week patterns of bedtime and can be used to study associations between the bedtime and the large number of health outcomes collected in NHANES 2003–2006.
Keywords: Bedtime, chronotype, life-span, day of the week
Introduction
The importance of sleep and its influence on health is well documented with research interest in sleep and biological rhythms continuing to increase across health research disciplines. Many large epidemiological studies and clinical trials have collected or are in the process of collecting data on sleep and associated health outcomes (Blackwell et al. 2011; Redline et al. 2014; Schrack et al. 2013; Spira et al. 2013). In particular, the timing and duration of sleep have been identified as strong predictors of follow-up comorbidities (Czeisler 2015; Skeldon et al. 2016; Tranah et al. 2011; Wulff et al. 2010; Yaffe et al. 2011). Interestingly, both short and long sleep duration may be associated with adverse health outcomes, including metabolic syndrome, obesity, heart disease, and mortality (Aurora et al. 2016; Baron et al. 2011; Cappuccio et al. 2011; Grandner et al. 2010; Hsieh et al. 2011; Wu et al. 2014). The timing of sleep, hormone release and core body temperature are regulated in large part by the circadian clock (Fuller et al. 2006; Gangwisch 2009), and dysregulation of the circadian clock has been linked to obesity, diabetes, mood, sleep disorders and other comorbidities (Gottlieb et al. 2005; Grandin et al. 2006; Lu and Zee 2006; McClung 2007).
Many large epidemiological studies collect data on sleep duration and timing using self-report questionnaires (Freedman et al. 2011; Spira et al. 2013). For example, the Munich ChronoType Questionnaire (MCTQ) collects information about when respondents prepare for sleep and go to bed, how long they sleep, when they wake up, and when they get out of bed on work and non-work days (Juda et al. 2013b; Roenneberg et al. 2007). Results based on the MCTQ are used to characterize sleep chronotype, a personal preference for timing of sleep. To mitigate the influence of sleep duration, the mid-point of the sleep interval is commonly used as a measure of chronotype (Roenneberg et al. 2007; Wittmann et al. 2006). Based on the mid-point, several chronotype groups are defined ranging from extremely early to extremely late.
Chronotype and sleep duration have been studied in different age and disease cohorts (Borisenkov 2010; Borisenkov et al. 2010; Roenneberg et al. 2007; Wittmann et al. 2006). However, only limited research has been dedicated to objective measures of sleep parameters in nationally representative samples. We propose to objectively estimate the chronotype and time in bed in the National Health and Nutrition Examination Survey (NHANES) 2003–2006. NHANES is a cross-sectional, US nationally representative survey that assessed demographic, dietary and health-related questions to understand differences in health and nutrition across age groups (Troiano et al. 2008). To obtain objective measurements we analyzed nighttime non-wear periods in data from a physical activity monitor. Previous analyses of NHANES data (Healy et al. 2011; Tucker et al. 2011; Tudor-Locke et al. 2011) treated the non-wear data as “missing” because they focused on physical activity rather than sleep. We propose to revisit these data that were thought not to contain relevant information and treat non-wear periods as implicit measures of objective bedtime period (OBT). Using this age-specific approach for the NHANES 2003–2006 accelerometry data, we computed US nationally representative estimates of chronotype and amount of time spent in bed, by age and sex. We also estimated day-of-the-week-specific duration of the OBT (OBT-D) and the midpoint of the OBT (OBT-M) as well as population percentile curves for each gender. Further, we validated our OBT-M index against results reported for midpoints of sleep in European populations using self-administered questionnaires (Juda et al. 2013a; Juda et al. 2013b; Wittmann et al. 2006).
Methods
The NHANES is a cross-sectional, nationally representative survey conducted to better understand differences in health and nutrition across age groups in the U.S. Most NHANES data are publicly available on the website of the National Center for Health Statistics (NCHS) (https://www.cdc.gov/hchs/nhanes). All participants or their legally authorized representative provided informed consent, and the NCHS Ethics Review Board approved all survey protocols. NCHS provided sample weights to allow valid population estimates for specifically defined demographic groups. All results reported in this paper account for the NHANES sampling scheme and are representative of the 2003–2006 US population.
Participants
NHANES 2003–2006 included a representative sample of the US civilian non-institutionalized population selected with a complex, multistage probability design. Here we use data from participants aged 6 years and older. Participants were excluded from the accelerometry portion of the study if: (1) their waist was too large for the accelerometer belt; (2) they were in a wheelchair; (3) they had recently undergone abdominal surgery; or (4) if they were younger than 6 years of age. In total, 14,631 participants completed the accelerometry portion of the study among which 11,951 participants had at least one valid day.
Measures
Accelerometry
NHANES participants were provided with an Actigraph 7164 uni-axial accelerometer (ActiGraph, Pensacola, FL) to wear on the right hip with an elastic belt. Participants were asked to wear the device for 7 consecutive days during the daytime and to take it off for swimming, bathing and showering. They were instructed to remove the monitor before getting into bed and put it back on just after getting out of bed. After completing data collection, participants were instructed to return the device by mail. The activity monitor recorded movement intensity values, expressed in counts per minute (CPM). The NCHS and survey collaborators performed an initial data review to identify outliers, unreasonable values and calibration problems with the monitors. We excluded data with calibration and quality flags indicating problems in these domains. Additionally, we excluded days with 10 or more hours of non-wear time. We defined non-wear periods as intervals of at least 60 consecutive minutes of zero activity counts, with allowance for 1–2 min of counts between 0 and 100 (Atienza et al. 2011; Troiano et al. 2008). For automated identification of non-wear periods we applied the algorithm included in NHANESACCEL R-package (Van Domelen and Pittard 2014).
Sleep questionnaire
Additionally, for comparison to accelerometer non-wear-based estimates, we used data from the sleep disorders questionnaire used in NHANES 2005–2006 [https://wwwn.cdc.gov/Nchs/Nhanes/2005-2006/SLQ_D.htm]. We used self-reported average sleep duration (“How much sleep do you get (hours)?”) and self-reported average sleep onset latency (“How long to fall asleep (minutes)?”). Participants reported average sleep duration between 1 and 11 hours. Sleep duration longer than 11 hours was categorized as 12 hours and longer. Sleep onset latency was reported between 0 and 50 minutes. Values above 50 minutes were categorized as 60 minutes and longer. For this portion of the study, the NHANES protocol focused on the eligible sample of participants 16 years and older. We only use sleep-questionnaire data for participants who completed accelerometry, resulting in 4,357 participants.
Other measures
NHANES participants reported their age, sex, and ethnicity at enrollment. Their weight and height have been measured during the examination. We only used data on age and sex for analyses. Detailed characteristic of study participants across age groups are presented in Table 1.
Table 1.
Survey-weighted demographic characteristics of NHANES participants across 13 age groups.
| 6–10 y.o. | 11–16 y.o. | 17–22 y.o. | 23–28 y.o. | 29–34 y.o. | 35–40 y.o. | 41–46 y.o. | 47–52 y.o. | 53–58 y.o. | 59–64 y.o. | 65–70 y.o. | 71–76 y.o. | 77–84 y.o. | Overall | |
|---|---|---|---|---|---|---|---|---|---|---|---|---|---|---|
| Sex: Male (%) | 51.6 | 51.9 | 50.9 | 49.4 | 49.1 | 48.4 | 48.6 | 48.5 | 49.8 | 45.3 | 46.5 | 44.1 | 42.9 | 48.8 |
| Race (%): | ||||||||||||||
| Mexican | 13.7 | 13.1 | 11.2 | 13.4 | 13.6 | 10.1 | 8 | 6 | 4.2 | 4.6 | 4 | 3.3 | 2.3 | 8.9 |
| American | ||||||||||||||
| Non-Hispanic - Black | 13.6 | 15.5 | 14.4 | 10.8 | 12.5 | 10.1 | 11.1 | 11.3 | 10.1 | 9.1 | 7.6 | 6.8 | 6.7 | 11.2 |
| Non-Hispanic - White | 59.3 | 61.8 | 64 | 64.7 | 63.6 | 66.7 | 73.8 | 75.2 | 76.5 | 80 | 80.6 | 85.8 | 88.5 | 70.6 |
| Other | 4.3 | 4 | 4.2 | 5.6 | 3.9 | 5.5 | 2.9 | 2.5 | 4.3 | 0.7 | 3.6 | 1.2 | 0.8 | 3.6 |
| Missing | 9.1 | 5.7 | 6.2 | 5.4 | 6.5 | 7.6 | 4.3 | 4.9 | 4.8 | 5.6 | 4.2 | 2.9 | 1.7 | 5.6 |
| Weight[kg]: mean (sd) | 32.25 (10.45) | 59.03 (17.74) | 73.89 (21.09) | 77.73 (20.22) | 81.11 (20.90) | 82.45 (21.77) | 85.70 (22.49) | 82.45 (18.93) | 84.25 (20.11) | 83.27 (20.09) | 81.74 (18.93) | 78.11 (17.83) | 72.69 (14.20) | 75.23 (24.21) |
| BMI: mean (sd) | 17.99 (3.60) | 22.31 (5.34) | 25.50 (6.46) | 26.60 (6.17) | 28.02 (6.36) | 28.55 (6.74) | 29.57 (7.18) | 28.79 (6.33) | 29.32 (6.31) | 29.11 (6.32) | 29.13 (5.79) | 28.23 (5.68) | 26.95 (4.46) | 26.91 (6.94) |
| Sample size (% females) | 1268 (51%) | 2187 (49%) | 1415 (51%) | 726 (57%) | 693 (54%) | 665 (50%) | 723 (51%) | 652 (51%) | 539 (50%) | 677 (54%) | 623 (49%) | 506 (46%) | 506 (47%) | 11180 (51%) |
Analyses
Objective bedtime (OBT)
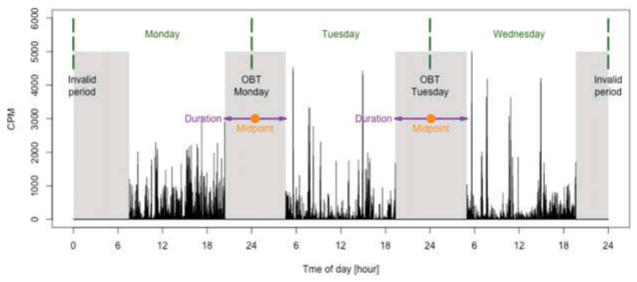
To estimate OBT, we calculated the duration of the longest non-wear period within a 24-hour window, which ranged from 4 to 14 hours. Non-wear duration was restricted to this range to avoid confusion with short periods that are not related to bedtime and long periods that are likely to be invalid data. Only valid days were considered, and only non-wear periods that were preceded and followed by recorded physical activity. If a non-wear period started on an invalid day, or before the 7-day assessment period, it was treated as invalid. Visual examples of valid and invalid OBT estimated using accelerometry data are displayed in Figure 1.
Figure 1.
Graphical representation of OBT. Black vertical lines represent activity counts per minute (CPM), gray areas represent non-wear periods, green dashed lines separate days of the week, purple arrows indicate OBT durations and orange points represent OBT midpoints. The invalid period on the left was considered invalid because no physical activity data were recorded before it. The invalid period on the right was considered invalid because no physical activity data appear after it.
Assignment of OBT to a day of the week
We assigned each OBT to a specific day of the week based on the timing of the OBT. If the OBT ended before noon, it was assigned to the day that preceded the end of that OBT. If the OBT ended in the afternoon, the OBT was assigned to the day on which the period ended. For example, if the OBT started on Monday at 11 PM and ended on Tuesday at 7 AM, the interval was assigned to Monday night. If the OBT started on Tuesday at 9 AM and ended on Tuesday at 1 PM, the OBT was assigned to Tuesday night. Thus, the more typical “nighttime” OBT was assigned to the night on which the OBT was initiated, whereas the less typical “daytime” OBT (participants with sleep disorders, shift workers etc.) was assigned to the day the OBT actually began.
Features of OBT
We focused on two features of OBT: duration and midpoint. We defined the estimated duration of OBT (OBT-D) as the length of the time interval between the beginning and end of the identified OBT expressed in complete hours followed by minutes. For example OBT-D equal to 9 hours and 30 minutes is denoted as 9:30. We defined the midpoint of OBT (OBT-M) as the midpoint between the beginning and end of the OBT period, expressed as time of day (e.g. 4:30 AM). Figure 1 provides a graphical representation of invalid periods, OBT duration, and OBT midpoint. To distinguish features of OBT between different days of the week, we used the lower-index notation. For example, duration of OBT observed on Monday night is denoted by OBT-DMon, while midpoint of OBT observed on Sunday night is denoted by OBT-MSun.
Population percentile curves
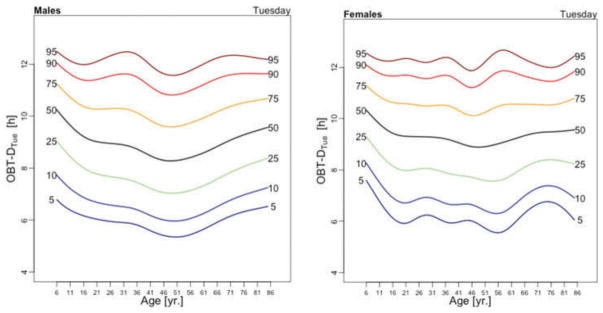
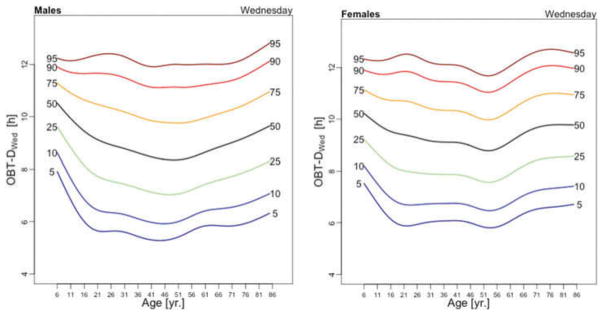
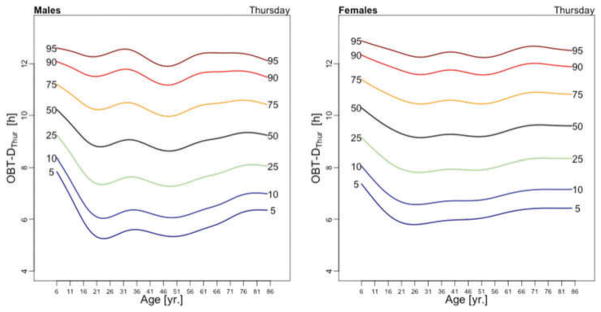
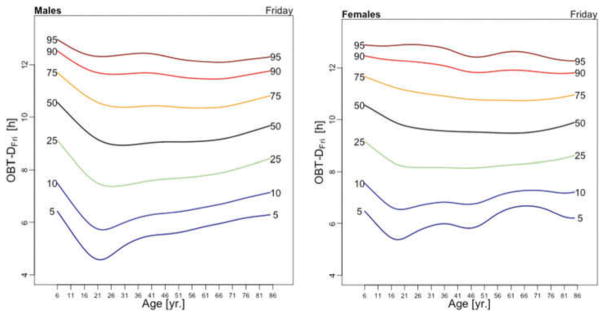
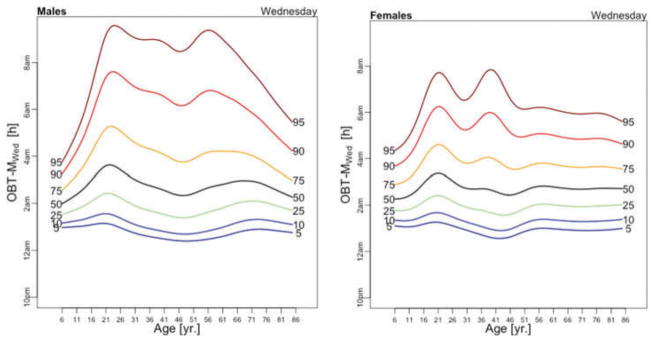
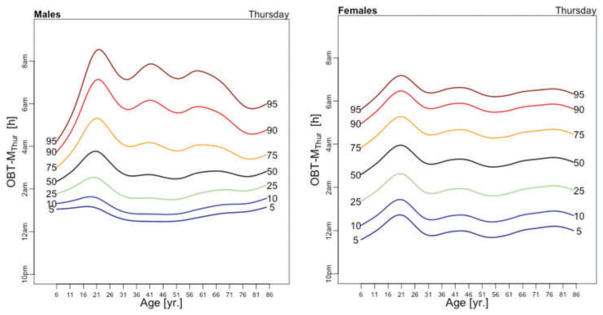
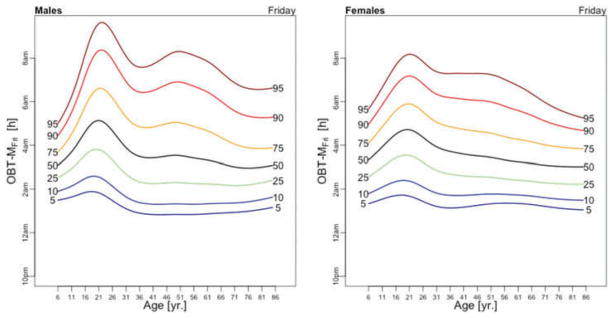
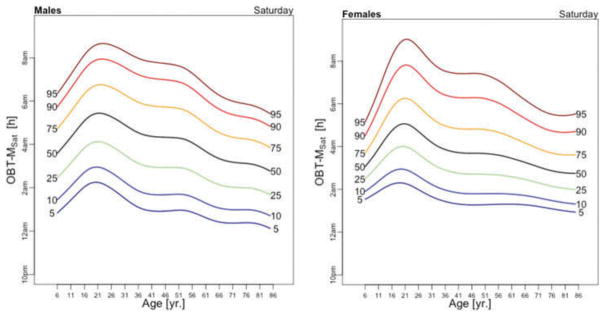
We estimated the age- and sex-specific 5%, 10%, 25%, 50%, 75%, 90%, 95% curves for the OBT measures in NHANES. Figures in the paper focus on the median (50%) curves, while the other percentile curves are reported in the Appendix. Generalized additive models for location, scale and shape (GAMLSS) (Rigby and Stasinopoulos 2006; Stasinopoulos and Rigby 2007) using the Lambda–Mu–Sigma (LMS) method were used to estimate these curves (Cole and Green 1992; Flegal and Cole 2013). LMS transforms data for each age using a Box–Cox transformation with transformation parameters that depend smoothly on age. The transformed data are modeled using a normal or τ-distribution and quantiles are fitted to the transformed data and mapped back onto the original scale. The LMS model was fitted using survey-weighted penalized likelihood (Cole and Green 1992). For computational stability, survey weights were normalized to sum to the sample size. All analyses were performed using the “survey” package in R (Lumley 2011).
Regression analysis
We modeled OBT-M and OBT-D as a function of gender, age, and the gender-by-age interaction separately for each day of the week. To capture the heterogeneous patterns observed in Figure 2–5, 13 age groups, shown in Table 1, were created and the age group indicators were included in all models to represent the age effect. Motivated by the patterns observed in Figure 2–5, indicating a low in OBT-D and a high in OBT-M between 17 and 22 years of age, the 17–22 year old females were chosen to be the reference group. Seven day-of-the-week-specific models were fitted both for OBT-D and OBT-M as follows:
| (1) |
where Yi denotes OBT-D or OBT-M of the ith NHANES participant having gender Genderi and Agei. Thus, gF and gF + gM are the parameters for a female and male, respectively, from the 17 –22 years old reference age group. Similarly, gF + al and gF + gM + al + gal are the parameters for a female and male, respectively, from the age group Agel. This approach allows testing for gender and age differences within a specific day of the week and provides estimates of the group-specific mean effects.
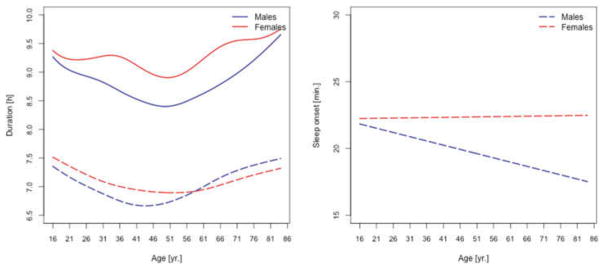
Figure 2.
Left panel: median self-reported sleep duration (dashed lines) and estimated duration of OBT-D (solid lines) for males (blue) and females (red). Right panel: median self-reported sleep onset for males (blue) and females (red).
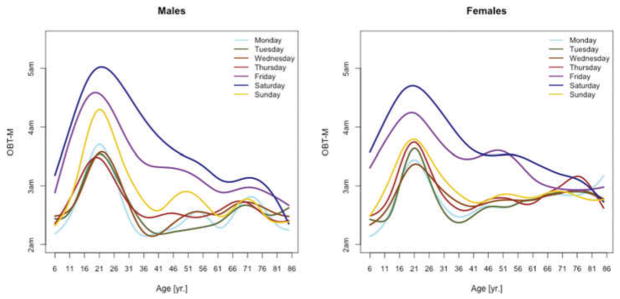
Figure 5.
OBT-M estimated for each day of the week for males (left) and females (right).
Results
Table A.1 reports the details on the number of participants with valid OBT days across age groups and days of the week. The proportions of participants with a given number of valid days of data are displayed in Table A.2. For the majority of participants (24%), 6 valid OBT days are available. However, full 7 days are available only for 4% of participants.
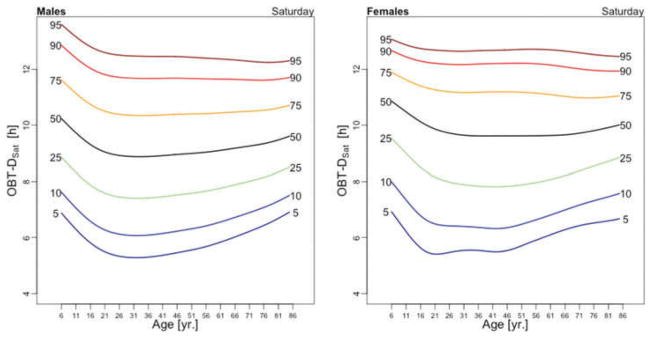
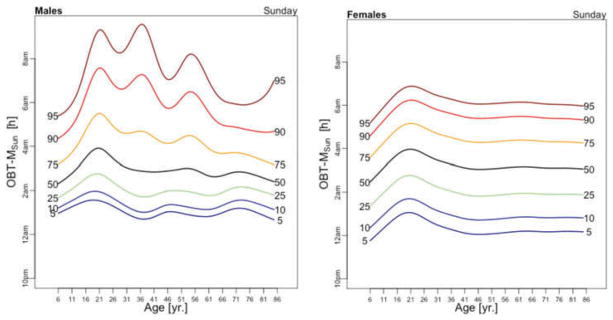
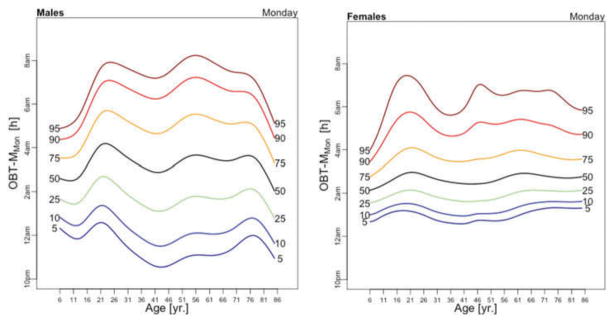
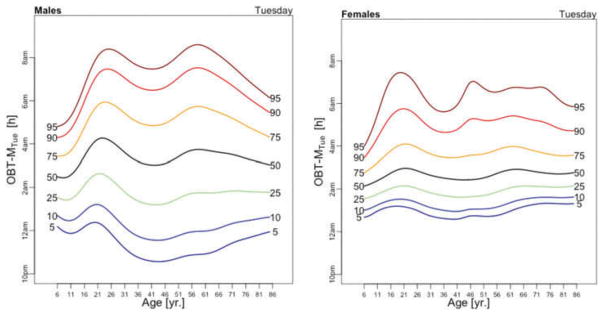
For presentation purposes, we provide and interpret only the median (50%) curves of OBT-M and OBT-D over the lifespan; the other percentile population curves are presented in Figures A.1 and A.2.
We focus first on comparing OBT-D and self-reported sleep duration in the participants of the 2005–06 NHANES older than 16 years of age, who have both of these measures. The subject-specific OBT-D represents an average across all available days for that subject. The left panel in Figure 2 displays age-specific medians of self-reported sleep durations (dashed lines) for males (blue) and females (red), together with medians of subject-specific OBT-D (solid lines). While visually OBT-D is, on average, 2 hours longer than the self-reported sleep duration, both exhibit similar age-related patterns. The minimum of the median self-reported sleep duration occurs between 40 and 50 years of age for males and between 55 and 65 years of age for females. The minimum of the median OBT-D was between 55 and 65 years of age for both males and females. Possible explanations for this observed difference could be the differential report of sleep onset latency for men and women or different behaviors around sleep time. The right panel in Figure 2 indicates that median self-reported sleep onset remains relatively constant for females over the life span and decreases by about 20% (5 minutes) for males.
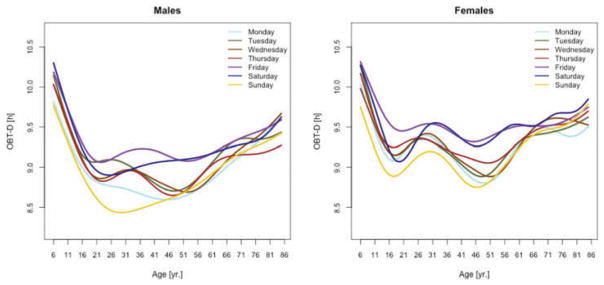
Figure 3 displays the OBT-D medians across the lifespan for each day of the week for males (left panel) and females (right panel). For males, OBT-D decreases as a function of age between the age of 6 and 20 and then exhibits a slight increase as a function of age, though patterns exhibit more heterogeneity depending on the day of the week. Indeed, weekend median OBT-D exhibits a clearer and steadier increase, while weekdays median OBT-D exhibit a wavier pattern with peaks around 30 years of age followed by a slow decrease to around 50 years of age. After 50 years of age the weekdays median OBT-D increases slowly with age to around 9.5 hours. The dissimilarity between weekend and weekdays OBT-D is different for females. Indeed, for females the patterns of median OBT-D are more consistent across the lifespan. Moreover, the median OBT for Sunday (OBT-DSun) has a clearly identifiable minimum around 25 years of age for males, while for females there are two such minima, one around age 16 and one around age 46.
Figure 3.
OBT-D estimated for each day of the week for males (left) and females (right).
The results of the estimated regression model (1) for OBT-D are shown in Table 2. Additionally, Table A.3 shows the fitted values obtained from the estimated regression models for OBT-D for both genders and all age groups. For Wednesdays, the average OBT-D of a female in the reference 17–22 years old age group is 9 hours and 25 minutes, which is 32 minutes longer than the OBT-D of a male from the same group. Compared to the reference group, the 6–10 years old age group has an average OBT-D across all days of the week between 40 and 90 minutes longer. Only Fridays and Saturdays nights have 36 and 63 minutes longer OBT-D in the 11–16 years old group compared to the reference group. Across the life span, Friday and Saturday OBT-D seem to be the longest and, compared to the reference group, the difference increases by 17–70 minutes, depending on the age group. Gender differences are stronger on Wednesdays and Thursdays (all age groups) and Saturdays (23–40 years old and 71–76 years old age groups). The results are mostly consistent with the visual intuition provided by the median plots in Figure 3.
Table 2.
Estimated regression coefficients (hours:minutes) and p-values (in brackets) for the OBT-D. Shaded cells mark statistically significant results (α ≤ 0.05).
| Females |
|
|
|
|
|
|
|
|
|
|
|
|
|
|||||||||||||
|---|---|---|---|---|---|---|---|---|---|---|---|---|---|---|---|---|---|---|---|---|---|---|---|---|---|---|
| Sun. | 0:43 (0.001) | −0:05 (0.711) | 9:03 (<0.001) | 0:02 (0.874) | 0:08 (0.606) | −0:04 (0.753) | −0:05 (0.756) | −0:11 (0.46) | −0:15 (0.316) | 0:23 (0.098) | 0:20 (0.15) | 0:26 (0.05) | 0:31 (0.023) | |||||||||||||
| Mon. | 0:54 (<0.001) | 0:05 (0.653) | 9:13 (<0.001) | 0:08 (0.528) | 0:08 (0.563) | −0:01 (0.96) | −0:13 (0.3) | −0:22 (0.074) | −0:18 (0.158) | 0:11 (0.405) | 0:20 (0.122) | 0:19 (0.147) | 0:05 (0.671) | |||||||||||||
| Tue. | 0:46 (<0.001) | 0:00 (0.966) | 9:18 (<0.001) | −0:08 (0.524) | −0:14 (0.264) | −0:09 (0.469) | −0:16 (0.176) | −0:24 (0.053) | −0:13 (0.34) | 0:03 (0.797) | 0:08 (0.511) | 0:13 (0.301) | 0:14 (0.26) | |||||||||||||
| Wed. | 0:34 (0.004) | −0:01 (0.899) | 9:25 (<0.001) | −0:07 (0.596) | 0:00 (0.988) | −0:14 (0.309) | −0:21 (0.099) | −0:35 (0.005) | −0:38 (0.005) | −0:19 (0.132) | 0:04 (0.741) | 0:20 (0.141) | 0:02 (0.891) | |||||||||||||
| Thur. | 0:45 (<0.001) | −0:09 (0.416) | 9:28 (<0.001) | −0:30 (0.028) | −0:22 (0.09) | −0:15 (0.272) | −0:13 (0.306) | −0:22 (0.077) | −0:21 (0.095) | −0:08 (0.533) | 0:01 (0.918) | 0.05(0.683) | −0:05 (0.721) | |||||||||||||
| Fri. | 1:12 (<0.001) | 0:32 (0.018) | 9:08 (<0.001) | 0:24 (0.13) | 0:25 (0.099) | 0:21 (0.16) | 0:8 (0.626) | 0:31 (0.028) | 0:29 (0.041) | 0:17 (0.224) | 0:17 (0.262) | 0:17 (0.238) | 0:20 (0.178) | |||||||||||||
| Sat. | 1:33 (<0.001) | 1:03 (<0.001) | 8:52 (<0.001) | 0:42 (0.015) | 0:44 (0.016) | 0:53 (0.005) | 0:21 (0.237) | 0:39 (0.017) | 0:44 (0.012) | 0:51 (0.002) | 0:16 (0.293) | 1:09 (<0.001) | 0:50 (0.002) | |||||||||||||
|
| ||||||||||||||||||||||||||
| Males |
|
|
|
|
|
|
|
|
|
|
|
|
|
|||||||||||||
|
| ||||||||||||||||||||||||||
| Sun. | 0:04 (0.84) | 0:30 (0.097) | −0:10 (0.525) | −0:21 (0.363) | −0:21 (0.34) | −0:15 (0.468) | −0:04 (0.867) | −0:01 (0.959) | 0:04 (0.858) | −0:24 (0.246) | −0:07 (0.706) | −0:04 (0.822) | −0:10 (0.626) | |||||||||||||
| Mon. | 0:11 (0.464) | 0:20 (0.196) | −0:21 (0.092) | −0:9 (0.637) | −0:18 (0.324) | −0:11 (0.509) | 0:06 (0.726) | −0:02 (0.892) | 0:14 (0.413) | −0:15 (0.402) | −0:15 (0.414) | 0:04 (0.831) | 0:21 (0.24) | |||||||||||||
| Tue. | 0:06 (0.717) | 0:10 (0.495) | −0:09 (0.467) | 0:23 (0.207) | 0:04 (0.814) | −0:05 (0.755) | −0:20 (0.249) | −0:12 (0.487) | −0:13 (0.49) | −0:18 (0.326) | 0:06 (0.718) | −0:05 (0.762) | −0:06 (0.728) | |||||||||||||
| Wed. | 0:32 (0.051) | 0:28 (0.078) | −0:32 (0.025) | 0:11 (0.57) | 0:13 (0.49) | 0:16 (0.409) | 0:08 (0.688) | 0:16 (0.379) | 0:23 (0.227) | 0:29 (0.134) | 0:05 (0.779) | −0:03 (0.873) | 0:38 (0.065) | |||||||||||||
| Thur. | 0:32 (0.054) | 1:01 (<0.001) | −0:44 (0.001) | 0:48 (0.018) | 0:52 (0.009) | 0:23 (0.24) | 0:04 (0.82) | 0:06 (0.73) | 0:21 (0.277) | 0:34 (0.079) | 0:17 (0.355) | 0:25 (0.174) | 0:26 (0.169) | |||||||||||||
| Fri. | 0:00 (0.997) | 0:16 (0.401) | −0:13 (0.375) | −0:02 (0.931) | −0:12 (0.571) | −0:02 (0.911) | −0:02 (0.934) | −0:20 (0.318) | −0:20 (0.347) | 0:08 (0.688) | −0:05 (0.825) | 0:14 (0.476) | 0:15 (0.476) | |||||||||||||
| Sat. | −0:25 (0.25) | −0:37 (0.07) | 0:18 (0.285) | −0:50 (0.057) | −0:56 (0.028) | −1:09 (0.007) | −0:25 (0.315) | −0:48 (0.035) | −0:55 (0.027) | −0:47 (0.042) | −0:10 (0.643) | −1:04 (0.002) | −0:50 (0. | |||||||||||||
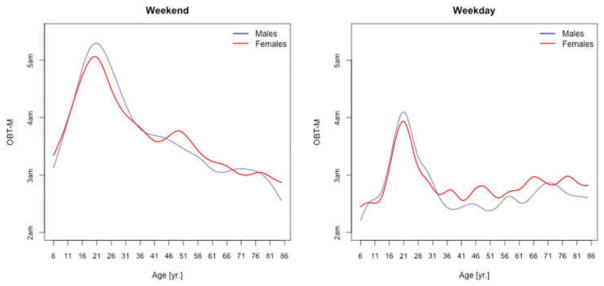
Figure 4 displays the medians of OBT-M across the lifespan for weekdays (left panel) and weekends (right panel) for males (blue) and females (red). Estimates for weekends and weekdays are shown separately to compare the OBT-MWeekend and the estimates of self-reported sleep-midpoints in the work-free days in European populations provided in Figure 1.D in Roenneberg et al. (2004). Strikingly, the left panel in Figure 4 is almost identical to Figure 1.D in Roenneberg et al. (2004) for the work-free-days. For both weekdays and weekends, the maximum of median OBT-M value is attained around 20 years of age. For weekdays, the maximum is around 4 AM for both genders, whereas for weekends is around 5:20 AM for males and 5 AM for females. During weekdays, OBT-M has a slight upward trend after age 35 for both genders, while during weekends OBT-M decreases roughly linearly from around 3:45 AM at age 35 to around 3 AM at age 85.
Figure 4.
OBT-M estimated for weekdays (left panel) and weekends (right panel) for males (blue) and females (red).
Figure 5 displays medians of OBT-M estimated across the lifespan for each day of the week for males (left) and females (right). For weekend days the median OBT-M peaks around 20 years of age for both males and females. For weekdays, median OBT-M also peaks around 20 years of age and then starts to decrease to its minimum around 2:30 AM around 40 years of age. The median OBT-M stabilizes after 40 years of age for males but increases for females to around 2:45 AM at 85 years of age. The maximum value of the median OBT-MSat is around 5 AM for males and 4:45 AM for females. The maximum value of the median OBT-MFri is around 4:30 AM for males and 4:15 AM for females, about 30 minutes less than the values for Saturday. For males around 20 years of age OBT-MSun is about 30 minutes later than other weekdays. This difference does not seem to exist for females. The medians OBT-M across weekdays are quite consistent with each other indicating a level of homogeneity of the sleep chronotype across weekdays across the life span with a peak value hovering around 3:30 AM for individuals who are around 20 years of age.
Table 3 shows the estimated coefficients for OBT-M using the regression model (1). Table A.4 shows the fitted values obtained from the estimated regression models for OBT-M for both genders and all age groups. The main results statistically confirm the patterns observed in Figure 5 over the entire life span. Only on Saturdays, the reference group is not statistically different from the 11–16 years old and 23–29 years old age groups. Males have approximately 12–38 minutes larger OBT-M than females on Sundays (71–84 years old age groups) and on Mondays (59–64 and 77–84 years old age groups).
Table 3.
Estimated regression coefficients (hours:minutes AM) p-values (in brackets) for the OBT-M. Shaded cells mark statistically significant results (α ≤ 0.05).
| Females |
|
|
|
|
|
|
|
|
|
|
|
|
|
|||||||||||||
|---|---|---|---|---|---|---|---|---|---|---|---|---|---|---|---|---|---|---|---|---|---|---|---|---|---|---|
| Sun. | −1:35 (<0.001) | −1:07 (<0.001) | 4:16 (<0.001) | −1:00 (0.001) | −0:56 (<0.001) | −1:18 (<0.001) | −1:27 (<0.001) | −1:08 (<0.001) | −1:29 (<0.001) | −1:44 (<0.001) | −1:08 (<0.001) | −1:21 (<0.001) | −1:22 (<0.001) | |||||||||||||
| Mon. | −1:21 (<0.001) | −1:05 (<0.001) | 3:44 (<0.001) | −0:35 (0.019) | −1:06 (<0.001) | −1:22 (<0.001) | −0:56 (<0.001) | −0:57 (<0.001) | −0:57 (<0.001) | −0:49 (<0.001) | −0:48 (<0.001) | −0:54 (<0.001) | −0:42 (<0.001) | |||||||||||||
| Tue. | −1:12 (<0.001) | −1:10 (<0.001) | 3:44 (<0.001) | −0:46 (0.014) | −1:04 (<0.001) | −1:09 (<0.001) | −1:11 (<0.001) | −0:58 (<0.001) | −0:53 (<0.001) | −0:49 (0.002) | −0:51 (<0.001) | −0:53 (<0.001) | −0:47 (<0.001) | |||||||||||||
| Wed. | −1:27 (<0.001) | −1:12 (<0.001) | 3:52 (<0.001) | −0:45 (0.005) | −0:59 (<0.001) | −1:02 (<0.001) | −1:18 (<0.001) | −1:06 (<0.001) | −1:06 (<0.001) | −0:56 (<0.001) | −0:58 (<0.001) | −0:57 (<0.001) | −0:57 (<0.001) | |||||||||||||
| Thur. | −1:24 (<0.001) | −0:52 (<0.001) | 3:58 (<0.001) | −0:43 (0.011) | −1:22 (<0.001) | −1:15 (<0.001) | −1:19 (<0.001) | −1:04 (<0.001) | −1:12 (<0.001) | −1:18 (<0.001) | −1:07 (<0.001) | −0:53 (<0.001) | −0:55 (<0.001) | |||||||||||||
| Fri. | −1:23 (<0.001) | −0:48 (0.002) | 4:45 (<0.001) | −0:51 (0.009) | q−0:57 (<0.001) | −1:22 (<0.001) | −1:04 (<0.001) | −0:56 (<0.001) | −1:13 (<0.001) | −1:37 (<0.001) | −1:39 (<0.001) | −1:46 (<0.001) | −1:25 (<0.001) | |||||||||||||
| Sat. | −1:24 (<0.001) | −0:26 (0.132) | 5:00 (<0.001) | −0:27 (0.213) | −0:39 (0.041) | −1:19 (<0.001) | −1:26 (0.002) | −1:14 (<0.001) | −1:11 (<0.001) | −1:45 (<0.001) | −1:48 (<0.001) | −1:56 (<0.001) | −1:58 (<0.001) | |||||||||||||
|
| ||||||||||||||||||||||||||
| Males |
|
|
|
|
|
|
|
|
|
|
|
|
|
|||||||||||||
|
| ||||||||||||||||||||||||||
| Sun. | −0:21 (0.28) | −0:24 (0.275) | 0:29 (0.096) | −0:16 (0.595) | −0:44 (0.081) | −0:43 (0.094) | −0:24 (0.332) | −0:43 (0.057) | −0:21 (0.364) | −0:34 (0.137) | −0:36 (0.073) | −0:41 (0.042) | −1:07 (0.002) | |||||||||||||
| Mon. | −0:02 (0.926) | 0:08 (0.695) | 0:07 (0.713) | −0:28 (0.331) | −0:22 (0.395) | −0:10 (0.693) | −0:27 (0.248) | −0:34 (0.161) | −0:14 (0.565) | −0:48 (0.031) | −0:15 (0.473) | −0:12 (0.579) | −0:51 (0.023) | |||||||||||||
| Tue. | 0:01 (0.968) | 0:10 (0.637) | 0:04 (0.835) | 0:15 (0.584) | 0:06 (0.794) | −0:14 (0.558) | −0:16 (0.497) | −0:41 (0.081) | −0:32 (0.179) | −0:31 (0.195) | −0:04 (0.835) | −0:16 (0.497) | −0:41 (0.078) | |||||||||||||
| Wed. | 0:01 (0.968) | −0:03 (0.888) | 0:08 (0.627) | 0:12 (0.622) | −0:34 (0.155) | −0:34 (0.115) | −0:13 (0.518) | −0:31 (0.151) | −0:21 (0.358) | −0:38 (0.077) | 0:03 (0.871) | −0:18 (0.389) | −0:34 (0.119) | |||||||||||||
| Thur. | 0:13 (0.541) | −0:01 (0.949) | −0:04 (0.849) | −0:01 (0.97) | 0:22 (0.397) | −0:19 (0.435) | 0:17 (0.493) | −0:11 (0.639) | −0:16 (0.51) | −0:02 (0.946) | 0:11 (0.638) | −0:16 (0.489) | −0:40 (0.102) | |||||||||||||
| Fri. | 0:09 (0.726) | 0:15 (0.534) | −0:05 (0.797) | 0:40 (0.188) | −0:20 (0.52) | 0:14 (0.618) | −0:12 (0.663) | −0:28 (0.286) | −0:15 (0.581) | −0:20 (0.438) | 0:19 (0.468) | 0:16 (0.511) | −0:37 (0.154) | |||||||||||||
| Sat. | 0:07 (0.818) | 0:05 (0.871) | −0:13 (0.663) | 0:24 (0.522) | 0:35 (0.342) | 0:43 (0.248) | 0:22 (0.597) | −0:28 (0.434) | −0:00 (0.994) | −0:17 (0.608) | 0:15 (0.622) | 0:12 (0.707) | −0:15 (0.653) | |||||||||||||
Discussion
In the present study, we developed a novel use for the 2003–2006 NHANES accelerometry data, by interpreting the night time non-wear of the accelerometer as an objective measure of the in-bed period. This approach uses the NHANES accelerometry data that so far has been used exclusively to explore physical activity.
Based on non-wear data we have introduced two new measures of the in-bed period: duration (OBT-D) and midpoint (OBT-M). We showed that these objective non-wear periods could be used in addition to self-reported sleep characteristics when they are available or as a proxy when they are not. Thus, OBT provides objective and quantifiable indirect information about the timing (OBT-M) and duration of the in-bed interval (OBT-D). The weekend OBT-M is strikingly similar to the midpoints of self-reported sleep on work-free days reported by Roenneberg et al. (2004) and by Fischer et al. (2017). This suggests that OBT-M is a robust estimator of the midpoint of sleep.
We have also quantified and illustrated the differences in OBT-D and OBT-M over age groups covering most of the lifespan. The differences in OBT-M across the lifespan are statistically significant for all age groups for each day of the week. The differences in OBT-D across age groups are relatively small within adulthood, but are relatively large between children and adults. Our approach allows the objective analysis of OBT periods for each day of the week, which provides an in-depth analysis of within-week chronobiology. This allows characterizing and quantifying the dynamics of the chronobiology of sleep as a function of entering, staying in, and leaving the weekend, relative to the rest of week. These results complement the literature on sleep and bedtime that typically use coarser categories such as weekend/weekday, referred to as weekend delay (Zhang et al. 2016) or work/work-free days, referred to as social jetlag (Roenneberg et al. 2004; Zavada et al. 2005). Since information on specific workdays is not available in NHANES 2003–06 dataset, OBT equivalent of social jetlag cannot be estimated. However, it is possible to quantify within-subject differences in weekend/weekday OBT, which allows the inclusion of children, unemployed adults and retirees.
Results also indicate that for some age groups, OBT on different days of the week may differ between males and females. For example, OBT-MSun is statistically significantly different between men and women in the 71 to 84 years old age group with an observed average difference of between 12 to 38 minutes. Also, OBT-DWed in the reference 17–22 years old age group is 32 minutes longer for females than the OBT-D of men from the same group. Although the underlying biological or social factors driving these differences require further investigation, our findings suggest that sex-specific OBT may be an important factor in aging and health research. It is important to note, however, that our results include data from both regular- and shift-working participants. Because information on regular/shift work was available only for a subsample of 2695 participants in NHANES 2005–06, of whom 398 (15%) were night or evening shift workers, we omitted this information from our models to maximize the sample size and expand our analysis to both children and adults.
Accurate estimation of OBT in NHANES is dependent on participants’ adherence to the physical activity data-collection protocol and on the definition of non-wear periods themselves. Incorrect identification of non-wear periods may indeed lead to biased results. It is important to note, however, that the interpretation of all previously published results concerning physical activity in NHANES 2003–2006 also rests on an assumption of participant adherence to the protocol. Given the large sample size, striking similarities with the results published by Roenneberg et al. (2004) and by Fischer et al. (2017) as well as qualitative similarities with self reported sleep duration (Figure 2) we are confident that OBT represents participants’ in-bed periods and can be a useful tool to address research questions concerning links of chronotype with health outcomes in NHANES.
An important limitation of OBT is that it does not contain the activity levels and fragmentation of rest/wake during time-in-bed because the device is simply off during this period. Therefore, the OBT features should be interpreted as measures of bedtime and not of sleep. Another limitation is that not all subjects had seven days of data, which could be due to lack of compliance or equipment failure. Thus, OBT measurements are available for valid days/nights only. Data availability needs to be taken into consideration when calculating and interpreting characteristics of within-week chronobiology, including weekend bedtime delay and weekend oversleep (Zhang et al. 2016). Further, we followed the accepted NHANES protocol for estimation of sleep durations by limiting the maximum duration of OBT to 14 hours. This may have resulted in the exclusion of participants with hypersomnia. However, the prevalence of such individuals in the population is expected to be very low (Coleman et al. 1982; Dauvilliers and Buguet 2005).
Despite these limitations, the present study has several strengths. First, we analyzed data from a very large US-representative sample (11,180 subjects). Another important contribution of our approach is that the OBT features can now be used to link sleep/wake schedules or chronotypes to the multiple NHANES health and mortality outcomes. Moreover, the relative predictive power of these proxies of chronobiology can be used to compare them to other established biomarkers. Future work may focus on studying the association between the proposed OBT measures and health and mortality outcomes in NHANES as well as on estimating systematic within-week variability in the OBT measures including social jet lag.
Acknowledgments
Funding: This work is supported by National Institutes of Health grant number NIH/NHLBI R01HL123407, grant number NIH/NIA R01AG049872-01, grant number NIH/NIA R01AG050507. Dr. Spira is supported by grant number AG049872, grant number AG050507, grant number AG050745, grant number AG052445 from the National Institute on Aging. Dr. Spira agreed to serve as a consultant to Awarables, Inc., in support of an NIH grant.
Appendix
Table A1.
Number of participants per age group and day of the week. Values in brackets represent percentage of females. Last column represents number of subjects per age group.
| 6–10 y.o. |
11–16 y.o. |
17–22 y.o. |
23–28 y.o. |
29–34 y.o. |
35–40 y.o. |
41–46 y.o. |
47–52 y.o. |
53–58 y.o. |
59–64 y.o. |
65–70 y.o. |
71–76 y.o. |
77–84 y.o. |
||
|---|---|---|---|---|---|---|---|---|---|---|---|---|---|---|
| Sun. | 568 (53%) | 922 (49%) | 592 (51%) | 307 (57%) | 314 (55%) | 318 (49%) | 335 (51%) | 331 (48%) | 284 (50%) | 404 (54%) | 421 (46%) | 352 (46%) | 363 (48%) | |
| Mon. | 767 (50%) | 1242 (49%) | 740 (49%) | 407 (55%) | 432 (53%) | 450 (48%) | 450 (50%) | 431 (51%) | 353 (50%) | 454 (53%) | 428 (50%) | 359 (47%) | 347 (47%) | |
| Tue. | 805 (51%) | 1353 (49%) | 768 (49%) | 449 (59%) | 460 (52%) | 470 (48%) | 508 (50%) | 475 (51%) | 385 (50%) | 493 (51%) | 465 (49%) | 376 (47%) | 374 (50%) | |
| Wed. | 810 (51%) | 1336 (48%) | 777 (51%) | 440 (54%) | 466 (53%) | 464 (48%) | 511 (50%) | 460 (50%) | 373 (50%) | 495 (53%) | 444 (49%) | 365 (46%) | 346 (46%) | |
| Thur. | 727 (53%) | 1190 (50%) | 737 (52%) | 416 (55%) | 432 (52%) | 438 (47%) | 479 (49%) | 452 (52%) | 371 (50%) | 485 (54%) | 454 (47%) | 391 (45%) | 367 (49%) | |
| Fri. | 570 (52%) | 904 (49%) | 602 (48%) | 322 (56%) | 329 (53%) | 358 (51%) | 388 (52%) | 393 (51%) | 326 (51%) | 402 (51%) | 378 (49%) | 318 (45%) | 327 (45%) | |
| Sat. | 408 (49%) | 738 (49%) | 514 (48%) | 255 (56%) | 256 (54%) | 230 (53%) | 282 (52%) | 293 (53%) | 264 (52%) | 366 (53%) | 375 (49%) | 331 (48%) | 325 (47%) | |
| Total | 4655 (51%) | 7685 (49%) | 4730 (50%) | 2596 (56%) | 2689 (53%) | 2728 (49%) | 2953 (50%) | 2835 (51%) | 2356 (50%) | 3099 (53%) | 2965 (49%) | 2492 (46%) | 2449 (48%) | 44232 (50%) |
| Subjects | 1268 (51%) | 2187 (49%) | 1415 (51%) | 726 (57%) | 693 (54%) | 665 (50%) | 723 (51%) | 652 (51%) | 539 (50%) | 677 (54%) | 623 (49%) | 506 (46%) | 506 (47%) | 11180 (51%) |
Table A2.
Percentage of participants with OBT estimated for N valid days. Values in brackets represent percentage of females.
| No. of days | 1 | 2 | 3 | 4 | 5 | 6 | 7 | Total |
|---|---|---|---|---|---|---|---|---|
| % of participants (% women) | 13% (54%) | 13% (52%) | 14% (51%) | 17% (51%) | 15% (49%) | 24% (51%) | 4% (43%) | 11180 (51%) |
Table A3.
Fitted values of OBT-D from the regression models (hours:minutes) with standard errors in the brackets (in minutes) for females (upper row) and males (bottom row).
| Females Males |
6–10 y.o. | 11–16 y. o. |
17–22 y. o. |
23–28 y. o. |
29–34 y. o. |
35–40 y. o. |
41–46 y. o. |
47–52 y. o. |
53–58 y. o. |
59–64 y. o. |
65–70 y. o. |
71–76 y. o. |
77–84 y. o. |
|---|---|---|---|---|---|---|---|---|---|---|---|---|---|
| Sun. | 9:45(08) | 8:58(08) | 9:03(10) | 9:05(12) | 9:11(11) | 8:58(09) | 8:58(11) | 8:52(10) | 8:48(10) | 9:26(09) | 9:22(09) | 9:29(09) | 9:34(09) |
| 9:40(09) | 9:19(07) | 8:53(11) | 8:35(12) | 8:40(11) | 8:34(09) | 8:45(10) | 8:41(11) | 8:42(10) | 8:52(10) | 9:05(08) | 9:15(09) | 9:15(09) | |
| Mon. | 10:07(06) | 9:18(07) | 9:13(09) | 9:21(09) | 9:20(10) | 9:12(08) | 8:60(09) | 8:51(08) | 8:55(09) | 9:23(09) | 9:33(09) | 9:32(10) | 9:18(09) |
| 9:57(06) | 9:17(06) | 8:52(09) | 8:51(11) | 8:42(09) | 8:40(09) | 8:45(10) | 8:28(10) | 8:48(09) | 8:47(10) | 8:57(10) | 9:15(08) | 9:18(09) | |
| Tue. | 10:04(06) | 9:18(06) | 9:18(09) | 9:10(08) | 9:04(09) | 9:09(09) | 9:02(08) | 8:54(08) | 9:05(10) | 9:21(10) | 9:26(09) | 9:31(08) | 9:32(09) |
| 10:00(07) | 9:20(06) | 9:09(09) | 9:24(10) | 8:59(10) | 8:54(08) | 8:33(09) | 8:33(09) | 8:43(09) | 8:54(09) | 9:24(09) | 9:16(09) | 9:17(08) | |
| Wed. | 9:59(06) | 9:24(05) | 9:25(10) | 9:18(09) | 9:25(09) | 9:11(10) | 9:04(08) | 8:50(08) | 8:47(09) | 9:06(08) | 9:29(09) | 9:45(09) | 9:27(11) |
| 9:59(05) | 9:20(05) | 8:53(10) | 8:57(10) | 9:06(09) | 8:55(08) | 8:40(10) | 8:34(09) | 8:38(09) | 9:02(10) | 9:03(09) | 9:10(10) | 9:33(10) | |
| Thur. | 10:13(07) | 9:19(07) | 9:28(09) | 8:58(10) | 9:06(09) | 9:14(10) | 9:15(09) | 9:06(09) | 9:07(09) | 9:20(09) | 9:30(10) | 9:33(09) | 9:24(10) |
| 10:01(06) | 9:35(06) | 8:44(10) | 9:02(11) | 9:14(11) | 8:52(10) | 8:35(10) | 8:28(08) | 8:44(10) | 9:10(11) | 9:03(09) | 9:14(09) | 9:05(09) | |
| Fri. | 10:19(09) | 9:40(09) | 9:08(11) | 9:32(12) | 9:33(11) | 9:29(11) | 9:15(12) | 9:38(09) | 9:36(09) | 9:25(10) | 9:24(10) | 9:25(10) | 9:28(10) |
| 10:06(09) | 9:43(08) | 8:54(11) | 9:17(12) | 9:07(12) | 9:13(11) | 9:00(11) | 9:05(10) | 9:04(11) | 9:20(11) | 9:06(11) | 9:26(10) | 9:29(10) | |
| Sat. | 10:25(10) | 9:55(07) | 8:52(12) | 9:34(12) | 9:36(13) | 9:45(14) | 9:13(13) | 9:31(11) | 9:36(12) | 9:44(11) | 9:08(09) | 10:01(09) | 9:42(10) |
| 10:18(10) | 9:36(09) | 9:10(11) | 9:02(17) | 8:58(14) | 8:54(13) | 9:06(14) | 9:01(11) | 8:59(14) | 9:14(12) | 9:16(10) | 9:15(08) | 9:11(10) |
Table A4.
Fitted values of OBT-M from the regression models (hours:minutes AM) with standard errors in the brackets (in minutes) for females (upper row) and males (bottom row).
| Females Males |
6–10 y.o. | 11–16 y.o. | 17–22 y.o. | 23–28 y.o. | 29–34 y.o. | 35–40 y.o. | 41–46 y.o. | 47–52 y.o. | 53–58 y.o. | 59–64 y.o. | 65–70 y.o. | 71–76 y.o. | 77–84 y.o. |
|---|---|---|---|---|---|---|---|---|---|---|---|---|---|
| Sun. | 2:41AM(07) | 3:09AM(10) | 4:16AM(12) | 3:16AM(14) | 3:20AM(11) | 2:58AM(08) | 2:49AM(11) | 3:07AM(09) | 2:47AM(09) | 2:32AM(11) | 3:07AM(06) | 2:55AM(07) | 2:53AM(07) |
| 2:49AM(07) | 3:14AM(08) | 4:45AM(12) | 3:29AM(20) | 3:05AM(15) | 2:43AM(18) | 2:54AM(14) | 2:53AM(12) | 2:54AM(13) | 2:26AM(10) | 3:01AM(07) | 2:42AM(08) | 2:16AM(11) | |
| Mon. | 2:24AM(04) | 2:39AM(08) | 3:44AM(09) | 3:09AM(12) | 2:38AM(13) | 2:22AM(11) | 2:48AM(09) | 2:47AM(09) | 2:47AM(09) | 2:55AM(09) | 2:56AM(07) | 2:51AM(09) | 3:02AM(07) |
| 2:28AM(07) | 2:54AM(06) | 3:51AM(16) | 2:48AM(18) | 2:23AM(14) | 2:19AM(13) | 2:27AM(12) | 2:19AM(13) | 2:40AM(12) | 2:14AM(09) | 2:47AM(08) | 2:45AM(08) | 2:18AM(11) | |
| Tue. | 2:32AM(04) | 2:34AM(07) | 3:44AM(12) | 2:58AM(15) | 2:40AM(07) | 2:35AM(08) | 2:34AM(08) | 2:46AM(09) | 2:51AM(09) | 2:55AM(11) | 2:53AM(06) | 2:51AM(08) | 2:58AM(06) |
| 2:37AM(05) | 2:48AM(06) | 3:48AM(15) | 3:17AM(14) | 2:50AM(11) | 2:25AM(11) | 2:21AM(12) | 2:09AM(11) | 2:23AM(11) | 2:28AM(09) | 2:52AM(08) | 2:39AM(12) | 2:20AM(12) | |
| Wed. | 2:25AM(07) | 2:40AM(07) | 3:52AM(10) | 3:07AM(13) | 2:53AM(08) | 2:50AM(10) | 2:34AM(07) | 2:47AM(09) | 2:46AM(10) | 2:56AM(09) | 2:54AM(07) | 2:55AM(07) | 2:55AM(08) |
| 2:34AM(05) | 2:45AM(07) | 4:00AM(14) | 3:27AM(12) | 2:27AM(15) | 2:24AM(09) | 2:29AM(10) | 2:24AM(11) | 2:33AM(12) | 2:27AM(09) | 3:05AM(07) | 2:45AM(10) | 2:29AM(11) | |
| Thur. | 2:34AM(06) | 3:06AM(08) | 3:58AM(12) | 3:15AM(12) | 2:36AM(12) | 2:43AM(09) | 2:39AM(12) | 2:54AM(07) | 2:47AM(07) | 2:40AM(08) | 2:51AM(10) | 3:05AM(08) | 3:03AM(09) |
| 2:43AM(05) | 3:01AM(07) | 3:55AM(15) | 3:10AM(12) | 2:54AM(12) | 2:21AM(12) | 2:52AM(10) | 2:40AM(11) | 2:27AM(14) | 2:35AM(09) | 2:58AM(07) | 2:45AM(11) | 2:19AM(12) | |
| Fri. | 3:22AM(12) | 3:57AM(09) | 4:45AM(12) | 3:55AM(15) | 3:48AM(10) | 3:24AM(11) | 3:41AM(13) | 3:49AM(09) | 3:33AM(08) | 3:08AM(09) | 3:06AM(10) | 2:59AM(09) | 3:20AM(08) |
| 3:26AM(11) | 4:07AM(09) | 4:40AM(17) | 4:29AM(16) | 3:23AM(20) | 3:32AM(15) | 3:24AM(12) | 3:16AM(12) | 3:12AM(14) | 2:43AM(11) | 3:19AM(11) | 3:10AM(09) | 2:38AM(12) | |
| Sat. | 3:36AM(07) | 4:34AM(07) | 5:00AM(16) | 4:34AM(14) | 4:21AM(11) | 3:41AM(12) | 3:35AM(23) | 3:46AM(12) | 3:49AM(08) | 3:15AM(08) | 3:12AM(08) | 3:04AM(07) | 3:02AM(08) |
| 3:31AM(09) | 4:27AM(09) | 4:48AM(25) | 4:45AM(18) | 4:43AM(19) | 4:11AM(19) | 3:44AM(20) | 3:06AM(16) | 3:36AM(15) | 2:45AM(12) | 3:15AM(07) | 3:03AM(10) | 2:34AM(13) |
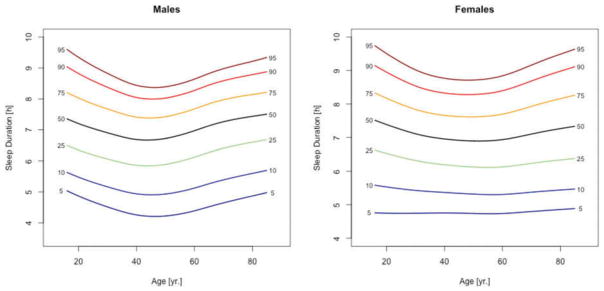
Figure A1.
Percentile curves for self-reported sleep duration for males (left) and females (right).
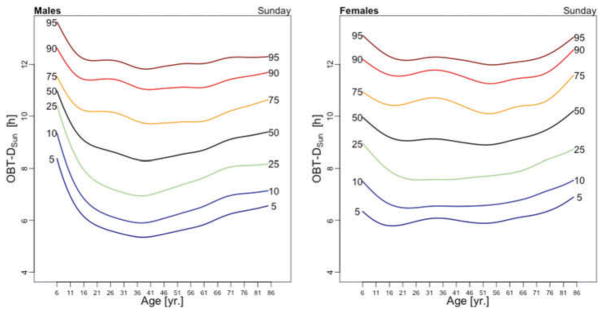
Figure A2.
Percentile curves for OBT-DSun for males (left) and females (right).
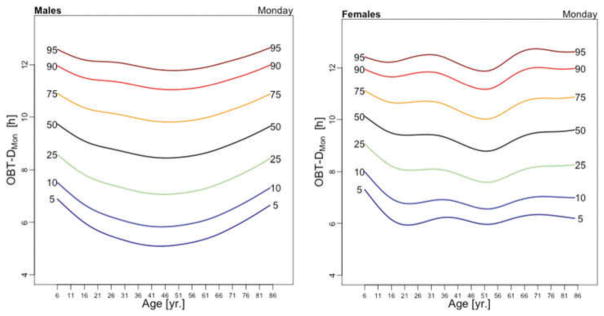
Figure A3.
Percentile curves for OBT-DMon for males (left) and females (right).
Figure A4.
Percentile curves for OBT-DTue for males (left) and females (right).
Figure A5.
Percentile curves for OBT-DWed for males (left) and females (right).
Figure A6.
Percentile curves for OBT-DThur for males (left) and females (right).
Figure A7.
Percentile curves for OBT-DFri for males (left) and females (right).
Figure A8.
Percentile curves for OBT-DSat for males (left) and females (right).
Figure A9.
Percentile curves for OBT-MSun for males (left) and females (right).
Figure A10.
Percentile curves for OBT-MMon for males (left) and females (right).
Figure A11.
Percentile curves for OBT-MTue for males (left) and females (right).
Figure A12.
Percentile curves for OBT-MWed for males (left) and females (right).
Figure A13.
Percentile curves for OBT-MThur for males (left) and females (right).
Figure A14.
Percentile curves for OBT-MFri for males (left) and females (right).
Figure A15.
Percentile curves for OBT-MSat for males (left) and females (right).
Footnotes
Color versions of one or more of the figures in the article can be found online at www.tandfonline.com/ICBI.
References
- Atienza AA, Moser RP, Perna F, Dodd K, Ballard-Barbash R, Troiano RP, Berrigan D. Self-reported and objectively measured activity related to biomarkers using NHANES. Med Sci Sports Exerc. 2011;43(5):815–21. doi: 10.1249/MSS.0b013e3181fdfc32. [DOI] [PubMed] [Google Scholar]
- Aurora RN, Kim JS, Crainiceanu C, O’Hearn D, Punjabi NM. Habitual sleep duration and all-cause mortality in a general community sample. Sleep. 2016;39(11):1903. doi: 10.5665/sleep.6212. [DOI] [PMC free article] [PubMed] [Google Scholar]
- Baron KG, Reid KJ, Kern AS, Zee PC. Role of sleep timing in caloric intake and BMI. Obesity. 2011;19(7):1374–81. doi: 10.1038/oby.2011.100. [DOI] [PubMed] [Google Scholar]
- Blackwell T, Yaffe K, Ancoli-Israel S, Redline S, Ensrud KE, Stefanick ML, Stone KL, et al. Associations between sleep architecture and sleep-disordered breathing and cognition in older community-dwelling men: The osteoporotic fractures in men sleep study. J Am Geriatr Soc. 2011;59(12):2217–25. doi: 10.1111/j.1532-5415.2011.03731.x. [DOI] [PMC free article] [PubMed] [Google Scholar]
- Borisenkov M. Human chronotypes in the north. Hum Physiol. 2010;36(3):348–52. doi: 10.1134/S0362119710030151. [DOI] [Google Scholar]
- Borisenkov MF, Perminova EV, Kosova AL. Chronotype, sleep length, and school achievement of 11-to 23-year-old students in northern European Russia. Chronobiol Int. 2010;27(6):1259–70. doi: 10.3109/07420528.2010.487624. [DOI] [PubMed] [Google Scholar]
- Cappuccio FP, Cooper D, D’Elia L, Strazzullo P, Miller MA. Sleep duration predicts cardiovascular outcomes: A systematic review and meta-analysis of prospective studies. Eur Heart J. 2011;32(12):1484–92. doi: 10.1093/eurheartj/ehr007. [DOI] [PubMed] [Google Scholar]
- Cole TJ, Green PJ. Smoothing reference centile curves: The LMS method and penalized likelihood. Stat Med. 1992;11(10):1305–19. doi: 10.1002/(ISSN)1097-0258. [DOI] [PubMed] [Google Scholar]
- Coleman RM, Roffwarg HP, Kennedy SJ, Guilleminault C, Cinque J, Cohn MA, Miles LE, et al. Sleep-wake disorders based on a polysomnographic diagnosis: A national cooperative study. Jama. 1982;247(7):997–1003. doi: 10.1001/jama.1982.03320320033026. [DOI] [PubMed] [Google Scholar]
- Czeisler CA. Duration, timing and quality of sleep are each vital for health, performance and safety. Sleep Health: J Natl Sleep Found. 2015;1(1):5–8. doi: 10.1016/j.sleh.2014.12.008. [DOI] [PubMed] [Google Scholar]
- Dauvilliers Y, Buguet A. Hypersomnia. Dialogues Clin Neurosci. 2005;7(4):347. doi: 10.31887/DCNS.2005.7.4/ydauvilliers. [DOI] [PMC free article] [PubMed] [Google Scholar]
- Fischer D, Lombardi DA, Marucci-Wellman H, Roenneberg T. Chronotypes in the US – Influence of age and sex. PLoS One. 2017;12(6):e0178782. doi: 10.1371/journal.pone.0178782. [DOI] [PMC free article] [PubMed] [Google Scholar]
- Flegal KM, Cole TJ. Construction of LMS parameters for the Centers for Disease Control and Prevention 2000 growth charts. Natl Health Stat Report. 2013;63:1–4. [PubMed] [Google Scholar]
- Freedman VA, Kasper JD, Cornman JC, Agree EM, Bandeen-Roche K, Mor V, Wolf DA, et al. Validation of new measures of disability and functioning in the National Health and Aging Trends Study. J Gerontol Ser A: Biol Sci Med Sci. 2011;66(9):1013–21. doi: 10.1093/gerona/glr087. [DOI] [PMC free article] [PubMed] [Google Scholar]
- Fuller PM, Gooley JJ, Saper CB. Neurobiology of the sleep-wake cycle: Sleep architecture, circadian regulation, and regulatory feedback. J Biol Rhythms. 2006;21(6):482–93. doi: 10.1177/0748730406294627. [DOI] [PubMed] [Google Scholar]
- Gangwisch J. Epidemiological evidence for the links between sleep, circadian rhythms and metabolism. Obes Reviews. 2009;10(s2):37–45. doi: 10.1111/obr.2009.10.issue-s2. [DOI] [PMC free article] [PubMed] [Google Scholar]
- Gottlieb DJ, Punjabi NM, Newman AB, Resnick HE, Redline S, Baldwin CM, Nieto FJ. Association of sleep time with diabetes mellitus and impaired glucose tolerance. Arch Intern Med. 2005;165(8):863–67. doi: 10.1001/archinte.165.8.863. [DOI] [PubMed] [Google Scholar]
- Grandin LD, Alloy LB, Abramson LY. The social zeitgeber theory, circadian rhythms, and mood disorders: Review and evaluation. Clin Psychol Rev. 2006;26(6):679–94. doi: 10.1016/j.cpr.2006.07.001. [DOI] [PubMed] [Google Scholar]
- Grandner MA, Hale L, Moore M, Patel NP. Mortality associated with short sleep duration: The evidence, the possible mechanisms, and the future. Sleep Med Rev. 2010;14(3):191–203. doi: 10.1016/j.smrv.2009.07.006. [DOI] [PMC free article] [PubMed] [Google Scholar]
- Healy GN, Matthews CE, Dunstan DW, Winkler EA, Owen N. Sedentary time and cardio-metabolic biomarkers in US adults: NHANES 2003–06. Eur Heart J. 2011;32(5):590–597. doi: 10.1093/eurheartj/ehq451. [DOI] [PMC free article] [PubMed] [Google Scholar]
- Hsieh SD, Muto T, Murase T, Tsuji H, Arase Y. Association of short sleep duration with obesity, diabetes, fatty liver and behavioral factors in Japanese men. Intern Med. 2011;50(21):2499–502. doi: 10.2169/internalmedicine.50.5844. [DOI] [PubMed] [Google Scholar]
- Juda M, Vetter C, Roenneberg T. Chronotype modulates sleep duration, sleep quality, and social jet lag in shift-workers. J Biol Rhythms. 2013a;28(2):141–51. doi: 10.1177/0748730412475042. [DOI] [PubMed] [Google Scholar]
- Juda M, Vetter C, Roenneberg T. The Munich chron-otype questionnaire for shift-workers (MCTQShift) J Biol Rhythms. 2013b;28(2):130–40. doi: 10.1177/0748730412475041. [DOI] [PubMed] [Google Scholar]
- Lu BS, Zee PC. Circadian rhythm sleep disorders. Chest J. 2006;130(6):1915–23. doi: 10.1378/chest.130.6.1915. [DOI] [PubMed] [Google Scholar]
- Lumley T. Complex surveys: A guide to analysis using R. Vol. 565. Hoboken, NJ: John Wiley & Sons; 2011. [Google Scholar]
- McClung CA. Circadian genes, rhythms and the biology of mood disorders. Pharmacol Ther. 2007;114(2):222–32. doi: 10.1016/j.pharmthera.2007.02.003. [DOI] [PMC free article] [PubMed] [Google Scholar]
- Redline S, Sotres-Alvarez D, Loredo J, Hall M, Patel SR, Ramos A, Barnhart J, et al. Sleep-disordered breathing in Hispanic/Latino individuals of diverse backgrounds. The Hispanic community health study/study of Latinos. Am J Respir Crit Care Med. 2014;189(3):335–44. doi: 10.1164/rccm.201309-1735OC. [DOI] [PMC free article] [PubMed] [Google Scholar]
- Rigby RA, Stasinopoulos DM. Using the Box-Cox t distribution in GAMLSS to model skewness and kurtosis. Stat Modelling. 2006;6(3):209–29. doi: 10.1191/1471082X06st122oa. [DOI] [Google Scholar]
- Roenneberg T, Kuehnle T, Juda M, Kantermann T, Allebrandt K, Gordijn M, Merrow M. Epidemiology of the human circadian clock. Sleep Med Rev. 2007;11(6):429–38. doi: 10.1016/j.smrv.2007.07.005. [DOI] [PubMed] [Google Scholar]
- Roenneberg T, Kuehnle T, Pramstaller PP, Ricken J, Havel M, Guth A, Merrow M. A marker for the end of adolescence. Curr Biol. 2004;14(24):R1038–R1039. doi: 10.1016/j.cub.2004.11.039. [DOI] [PubMed] [Google Scholar]
- Schrack JA, Zipunnikov V, Goldsmith J, Bai J, Simonsick EM, Crainiceanu C, Ferrucci L. Assessing the “physical cliff”:Detailed quantification of age-related differences daily patterns of physical activity. J Gerontol Ser A: Biol Sci Med Sci. 2013;69(8):973–979. doi: 10.1093/gerona/glt199. [DOI] [PMC free article] [PubMed] [Google Scholar]
- Skeldon AC, Derks G, Dijk D-J. Modelling changes in sleep timing and duration across the lifespan: Changes in circadian rhythmicity or sleep homeostasis? Sleep Med Rev. 2016;28:96–107. doi: 10.1016/j.smrv.2015.05.011. [DOI] [PubMed] [Google Scholar]
- Spira AP, Gamaldo AA, An Y, Wu MN, Simonsick EM, Bilgel M, Resnick SM, et al. Self-reported sleep and β-amyloid deposition in community-dwelling older adults. JAMA Neurol. 2013;70(12):1537–43. doi: 10.1001/jamaneurol.2013.4258. [DOI] [PMC free article] [PubMed] [Google Scholar]
- Stasinopoulos DM, Rigby RA. Generalized additive models for location scale and shape (GAMLSS) in R. J Stat Softw. 2007;23(7):1–46. doi: 10.18637/jss.v023.i07. [DOI] [Google Scholar]
- Tranah GJ, Blackwell T, Stone KL, Ancoli-Israel S, Paudel ML, Ensrud KE, Cummings SR, et al. Circadian activity rhythms and risk of incident dementia and mild cognitive impairment in older women. Ann Neurol. 2011;70(5):722–32. doi: 10.1002/ana.22468. [DOI] [PMC free article] [PubMed] [Google Scholar]
- Troiano RP, Berrigan D, Dodd KW, Masse LC, Tilert T, McDowell M. Physical activity in the United States measured by accelerometer. Med Sci Sports Exerc. 2008;40(1):181. doi: 10.1249/mss.0b013e31815a51b3. [DOI] [PubMed] [Google Scholar]
- Tucker JM, Welk GJ, Beyler NK. Physical activity in US adults: Compliance with the physical activity guidelines for Americans. Am J Prev Med. 2011;40(4):454–61. doi: 10.1016/j.amepre.2010.12.016. [DOI] [PubMed] [Google Scholar]
- Tudor-Locke C, Camhi SM, Leonardi C, Johnson WD, Katzmarzyk PT, Earnest CP, Church TS. Patterns of adult stepping cadence in the 2005–2006 NHANES. Prev Med. 2011;53(3):178–81. doi: 10.1016/j.ypmed.2011.06.004. [DOI] [PubMed] [Google Scholar]
- Van Domelen DR, Pittard WS. A peer-reviewed, open-access publication of the R Foundation for Statistical Computing. A peer-reviewed, open-access publication of the R Foundation for Statistical Computing. 2014:52. [Google Scholar]
- Wittmann M, Dinich J, Merrow M, Roenneberg T. Social jetlag: Misalignment of biological and social time. Chronobiol Int. 2006;23(1–2):497–509. doi: 10.1080/07420520500545979. [DOI] [PubMed] [Google Scholar]
- Wu Y, Zhai L, Zhang D. Sleep duration and obesity among adults: A meta-analysis of prospective studies. Sleep Med. 2014;15(12):1456–62. doi: 10.1016/j.sleep.2014.07.018. [DOI] [PubMed] [Google Scholar]
- Wulff K, Gatti S, Wettstein JG, Foster RG. Sleep and circadian rhythm disruption in psychiatric and neurode-generative disease. Nat Rev Neurosci. 2010;11(8):589–99. doi: 10.1038/nrn2868. [DOI] [PubMed] [Google Scholar]
- Yaffe K, Laffan AM, Harrison SL, Redline S, Spira AP, Ensrud KE, Stone KL, et al. Sleep-disordered breathing, hypoxia, and risk of mild cognitive impairment and dementia in older women. Jama. 2011;306(6):613–19. doi: 10.1001/jama.2011.1115. [DOI] [PMC free article] [PubMed] [Google Scholar]
- Zavada A, Gordijn MC, Beersma DG, Daan S, Roenneberg T. Comparison of the Munich Chronotype Questionnaire with the Horne-Östberg’s morningness-eveningness score. Chronobiol Int. 2005;22(2):267–78. doi: 10.1081/CBI-200053536. [DOI] [PubMed] [Google Scholar]
- Zhang J, Paksarian D, Lamers F, Hickie IB, He J, Merikangas KR. Sleep patterns and mental health correlates in US adolescents. J Pediatr. 2016;182:137–43. doi: 10.1016/j.jpeds.2016.11.007. [DOI] [PubMed] [Google Scholar]


