

Abstract
Objective
To examine the relationship between Tpeak- Tend interval (Tpe) and Tpe/QT ratio with occurrence of ventricular premature beats (VPBs) and left ventricular remodeling in hypertension.
Methods
A total of 52 patients with mild to moderate essential hypertension were included, undergoing echocardiography and 24-hours Holter monitoring. Ventricular remodeling was assessed by left ventricular mass index (LVMI) using the Devereux formula and diastolic function by transmitral E and A wave velocities and E/A ratio. Tpe was measured in the precordial leads. The end of the T wave was set by the method of the tangent to the steepest descending slope of the T wave.
Results
Tpe and Tpe/QT in leads V2 (r = 0.33, P = 0.01; r = 0.27, P = 0.04 respectively) and V3 (r = 0.40, P = 0.002; r = 0.40, P = 0.003, respectively) correlated significantly with LVMI. A significant inverse relationship was observed between E/A ratio and QT (r = −0.33, P = 0.01), Tpe in V3 (r = −0.39, P = 0.003) and Tpe/QT in V3 (r = −0.31, P = 0.02). Tpe in V3, V5, mean Tpe and maximum Tpe with cut-off values of 60 ms, 59 ms, 62 ms and 71 ms, respectively, associated with the occurrence of ventricular premature beats.
Conclusions
The repolarization parameters Tpe interval and Tpe/QT ratio correlate with LVMI and indices of left ventricular diastolic function and show better predictive values than traditional parameters such as QT interval and QT dispersion. Lead V3 is the best lead for measuring Tpe and Tpe/QT. These ECG indices can therefore be used in clinical practice to monitor LV remodeling and predict occurrence of VPBs.
Keywords: Hypertension, Repolarization, Tpeak-Tend, Ventricular remodeling
1. Introduction
The association between left ventricular hypertrophy (LVH) and sudden cardiac death (SCD) is well-established. A number of mechanisms, which generate structural and electrophysiological substrates, have been proposed to explain this increased arrhythmic risk. The hypertrophied myocardium contains increased collagen deposition and interstitial fibrosis, in turn leading to conduction defects, favoring re-entrant activity.[1] Electrophysiological remodeling can occur in the form of nonuniform action potential duration (APD) prolongation leading to increased incidence of early afterdepolarization phenomena and transmural dispersion of repolarization, favoring both triggered and reentrant arrhythmogenesis.[2]
The discovery and characterization of distinct myocardial cell types, have provided insights into the mechanisms underlying these electrophysiological heterogeneities. Thus, the ventricular myocardium contains three distinct cell populations, epicardial, endocardial and midmyocardial (M) cells, with distinct electrophysiological characteristics as well as different responses to pharmacological agents and various pathophysiological conditions.[3] Normally, the epicardial cells have the shortest APD and M-cells have the longest APD, whereas endocardial cells have an intermediate APD. These differing electrophysiological properties of these cell types are thought to underlie the inscription of the T-wave, with its peak corresponding to the end of epicardial repolarization and T-wave end to the end of-M cell repolarization.[3]
Several electrocardiographic indices for the quantitative assessment of repolarization have been proposed: QT duration, QT dispersion (QTd), T wave microvolt alternans, and more recently, Tpeak - Tend interval (Tpe), Tpeak - Tend /QT ratio (Tpe/QT) and Tpeak - Tend dispersion (Tped). Although all these parameters often change simultaneously, each provides different information and has different predictive value for disease progression, arrhythmogenesis and sudden cardiac death.[4] Thus, Tpe and Tpe/QT, correlated with dispersion of ventricular repolarization in experimental models but have at the same time generated controversy in terms of the optimal method of determination as well as their prognostic significance. The aim of this study is to examine classical parameters of repolarization and its dispersion (QT interval, QTd) versus Tpe, Tpe/QT and Tped in relation to the risk for occurrence of ventricular premature beats (VPBs) and to left ventricular geometry and diastolic function in essential hypertension.
2. Methods
We performed a cross-sectional study. The study was conducted according to the ethical principles stated in the Declaration of Helsinki. The study protocol has been approved by the local ethics committee and the informed consent was obtained from each patient. Consecutive patients with grades I and II essential hypertension, diagnosed according to the European Guidelines for the Management of Hypertension[5] and in sinus rhythm were included. The exclusion criteria were the presence of secondary hypertension, documented ischemic heart disease (positive ECG stress test, coronary angiography with significant stenosis, prior myocardial infarction), heart failure, severe valvular heart disease, chronic kidney disease stages III-V, diabetic autonomic neuropathy, atrial fibrillation, bundle branch blocks, pre-excitation syndromes, electrolyte disturbances, treatment with antiarrhythmic drugs.
Two-dimensional and Doppler echocardiography were performed to quantify cardiac chamber function and structure. Ventricular remodeling was assessed by calculating the left ventricular mass index (LVMI) using Devereux formula and relative wall thickness and classified into normal, concentric remodeling, concentric hypertrophy and eccentric hypertrophy.[6] Diastolic function was evaluated by transmitral E and A wave velocities and the E/A ratio.
Holter ECG monitoring was performed with a 12-lead continuous recording device and used for manual measuring of the dispersion of ventricular repolarization parameters. QT interval was defined as the interval between the onset of the QRS complex and the end of the T-wave and was measured in all leads. The maximum value of QT was determined. The interval between the peak and the end of the T-wave (Tpe) was measured in the precordial leads. The end of the T-wave was measured by the method of the tangent to the steepest slope of the descending portion of the T wave (Figure 1). These parameters were determined on three different complexes for each lead and their mean values were calculated. QTd and Tped were defined as the difference between the highest and lowest value of QT and Tpe intervals. QT, QTd, Tpe and Tped were corrected for heart rate using Bazett formula (QTc = QT/√RR). The leads were considered uninterpretable if the T-wave amplitude was lower than 0.1 mV or if biphasic T-waves were present. The measurements of dispersion of repolarization were made on a stable RR interval (with a heart rate between 55 and 85 beats per minute), during the declared wake-up period and at rest, in order to have the same conditions as during echocardiography. To determine inter-observer variability, a colleague who was not involved in our study was asked to measure ECG parameters in ten patients. Inter-observer variability was estimated by the intra-class correlation coefficient using an absolute agreement definition. There was excellent agreement between the observers (Supplementary Table 1 ).
Figure 1. Measurement of Tpe interval.
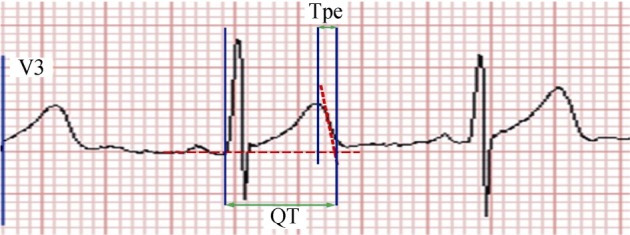
The end of the T wave was measured by convention using the method of the tangent to the steepest slope of the descending portion of the T wave. Tpe: Tpeak - Tend.
The occurrence of VPBs was also assessed using 24-hour Holter monitoring. The entire recording was analyzed and corrections were made manually for artifacts, normal beats and atrial ectopy (especially atrial ectopy with aberrancy). Patients in the no VPBs subgroup did not exhibit a single VPB during the 24-hour monitoring. Complex VPBs were defined as occurrence of bigeminy, trigeminy and couplets during the 24-hour monitoring.
The data are presented as means ± standard deviation for numerical variables and as absolute numbers and percentages for categorical variables. For numerical variables, parametric (Student's t-test, ANOVA) or non-parametric (Mann-Withney, Kruskal-Wallis) tests were used, according to the distribution of data. Also, Bartlett's test was used for assessment of the homogeneity of variances. Linear regression and Pearson correlation coefficient were used to examine correlation between different numerical variables.
For assessment of associations between specific values of the parameters measured and the occurrence of VPBs, the means of the parameters were calculated in the group with VPBs and the value obtained by subtracting the standard deviation from the mean was then assessed by chi-squared test to see if a value higher than that would be associated with occurrence of VPBs. If so, a smaller and a higher value were also examined and we compared the power of those associations. Two-tailed chi-squared test was used and the results are expressed as odds ratio (OR) and the respective 95% confidence interval (CI). The value with the best power was then reported.
A P-value of < 0.05 was considered statistically significant.
3. Results
A total of 52 patients (mean age 54.9 ± 11.2 years, 44.2% men) were included in this study. Their basic demographic characteristics are shown in Table 1. The electrocardiographic parameters of ventricular repolarization are listed in Table 2. Maximum values of Tpe and Tpe/QT occurred most frequently in leads V2 and V3. The repolarization parameters were evaluated in relation to left ventricular remodeling but none of these differed between the types of ventricular geometry (Table 2). Moreover, 11 patients (21.2%) showed evidence of complex VPBs. However, it appeared to be evenly distributed amongst the differing geometric subtypes. Thus, it was observed in two patients with normal geometry, six with concentric remodeling and three with concentric hypertrophy (P > 0.05). By contrast, Tpe in lead V2 (r = 0.34, P = 0.01), Tpe and Tpe/QT in lead V3 (r = 0.40, P = 0.003) significantly correlated with LVMI (Figure 2 and Figure 3, Table 3).
Table 1. Basic characteristics of the study group.
| Parameter (n = 52) | Value |
| Age, yrs | 54.9 ± 11.2 |
| Male gender | 23 (44.2%) |
| Body mass index, kg/m2 | 29.3 ± 4.9 |
| Cardiovascular risk factors | |
| Smoking | 11 (21.1%) |
| Dislipidemia | 30 (57.6%) |
| Intermediate hyperglycemia | 22 (42.3%) |
| Diabetes | 5 (9.6%) |
| Obesity | 27 (51.9%) |
| Left ventricular geometry | |
| Normal | 9 (17.3%) |
| Concentric remodeling | 30 (57.7%) |
| Concentric hypertrophy | 8 (15.4%) |
| Eccentric hypertrophy | 5 (9.6%) |
| Left ventricular mass index, g/m2 | 92.40 ± 20.37 |
| Relative wall thickness | 0.47 ± 0.07 |
| Left ventricular diastolic function | |
| E, m/s | 0.68 ± 0.15 |
| A, m/s | 0.62 ± 0.15 |
| E/A ratio | 1.14 ± 0.39 |
| Normal diastolic function | 32 (61.5%) |
| Impaired relaxation pattern | 20 (38.4%) |
| Ventricular arrhythmias | |
| Ventricular premature complexes | 31 (59.6%) |
| Complex ventricular arrhythmias | 11 (21.1%) |
Data were presented as mean ± SD and n (%).
Table 2. Values of dispersion of repolarization parameters between the types of left ventricular geometry.
| Parameter (n = 52) | Mean value | Normal geometry (n = 9; 17.3%) | Concentric remodeling (n = 30; 57.7%) | Eccentric hypertrophy (n = 8; 15.4%) | Concentric hypertrophy (n = 5; 9.6%) | P |
| QT | 420.5 ± 26.3 | 412.7 ± 27.2 | 418.5 ± 25.9 | 424.9 ± 17.1 | 434.3 ± 29.9 | 0.36 |
| QTd | 47.8 ± 19.3 | 53.1 ± 17.1 | 46.5 ± 17.4 | 40.6 ± 21.9 | 51.4 ± 27.2 | 0.48 |
| Tpe V1 | 57.9 ± 9.7 | 59.8 ± 13.8 | 57.7 ± 9.1 | 56.6 ± 7.4 | 58.0 ± 11.1 | 0.97 |
| Tpe/QT V1 | 0.1496 ± 0.0253 | 0.1577 ± 0.0362 | 0.1496 ± 0.0227 | 0.1384 ± 0.0143 | 0.1499 ± 0.0303 | 0.75 |
| Tpe V2 | 71.8 ± 10.5 | 72.6 ± 7.9 | 70.1 ± 10.5 | 76.7 ± 16.2 | 74.0 ± 9.8 | 0.53 |
| Tpe/QT V2 | 0.1815 ± 0.0238 | 0.1874 ± 0.0184 | 0.1845 ± 0.0239 | 0.1877 ± 0.0296 | 0.1844 ± 0.0272 | 0.64 |
| Tpe V3 | 73.4 ± 13.4 | 68.9 ± 13.7 | 72.7 ± 12.8 | 74.4 ± 18.2 | 80.2 ± 12.5 | 0.37 |
| Tpe/QT V3 | 0.1819 ± 0.0306 | 0.1734 ± 0.0328 | 0.1809 ± 0.0286 | 0.1800 ± 0.0374 | 0.1963 ± 0.0327 | 0.48 |
| Tpe V4 | 70.2 ± 12.4 | 68.0 ± 11.3 | 72.1 ± 11.1 | 72.7 ± 11.6 | 62.7 ± 18.0 | 0.30 |
| Tpe/QT V4 | 0.1745 ± 0.0301 | 0.1702 ± 0.0295 | 0.1794 ± 0.0250 | 0.1773 ± 0.0279 | 0.1562 ± 0.0479 | 0.46 |
| Tpe V5 | 68.2 ± 11.6 | 61.7 ± 8.2 | 70.4 ± 12.3 | 71.1 ± 12.7 | 65.6 ± 9.9 | 0.26 |
| Tpe/QT V5 | 0.1675 ± 0.0262 | 0.1536 ± 0.0200 | 0.1728 ± 0.0260 | 0.1743 ± 0.0352 | 0.1594 ± 0.0254 | 0.28 |
| Tpe V6 | 63.0 ± 10.9 | 60.5 ± 9.0 | 63.5 ± 10.9 | 65.9 ± 9.9 | 62.0 ± 14.1 | 0.82 |
| Tpe/QT V6 | 0.1540 ± 0.0243 | 0.1529 ± 0.0203 | 0.1556 ± 0.0249 | 0.1578 ± 0.0189 | 0.1467 ± 0.0315 | 0.81 |
| Mean Tpe | 68.1 ± 8.2 | 65.7 ± 6.3 | 68.6 ± 8.4 | 69.6 ± 10.4 | 67.6 ± 8.9 | 0.79 |
| Mean Tpe/QT | 0.1698 ± 0.0199 | 0.1665 ± 0.0173 | 0.1714 ± 0.0194 | 0.1691 ± 0.0234 | 0.1673 ± 0.0255 | 0.90 |
| Maximum Tpe | 79.2 ± 10.8 | 76.8 ± 6.3 | 79.2 ± 11.2 | 79.7 ± 14.3 | 81.4 ± 12.1 | 0.86 |
| Maximum Tpe/QT | 0.1963 ± 0.0232 | 0.1968 ± 0.0148 | 0.1957 ± 0.0230 | 0.1924 ± 0.0287 | 0.2003 ± 0.0312 | 0.94 |
| Tped | 23.5 ± 9.7 | 23.3 ± 8.2 | 22.1 ± 10.2 | 24.8 ± 12.3 | 27.9 ± 8.2 | 0.52 |
Data were presented as mean ± SD. QTd: QT dispersion; Tpe: Tpeak - Tend; Tped: Tpeak - Tend dispersion.
Figure 2. Scatterplot of Tpe in leads V2 and V3 against LVMI.
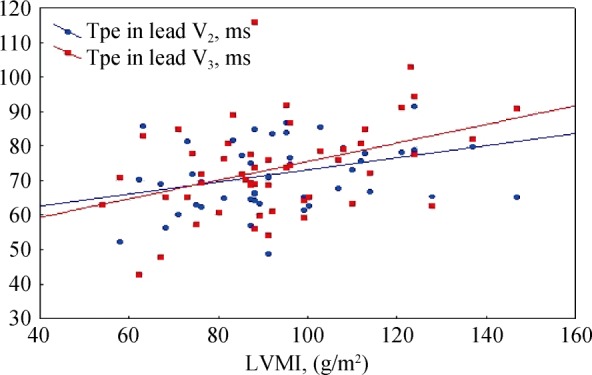
There were significant correlations between Tpe measured in leads V2 and V3 with LVMI. LVMI: left ventricular mass index; Tpe: Tpeak - Tend.
Figure 3. Scatterplot of Tpe/QT in leads V2 and V3 against LVMI.

There were significant correlations between Tpe/QT measured in leads V2 and V3 with LVMI. LVMI: left ventricular mass index; Tpe: Tpeak - Tend.
Table 3. Correlations between dispersion of repolarization parameters, left ventricular mass index and diastolic function parameters.
| Parameter | LVMI |
E |
A |
E/A |
||||
| r | P | r | P | r | P | r | P | |
| QT (n = 52) | 0.05 | 0.68 | −0.21 | 0.13 | 0.41 | 0.002 | −0.33 | 0.01 |
| QTd (n = 52) | −0.10 | 0.46 | 0.01 | 0.92 | 0.18 | 0.20 | −0.06 | 0.65 |
| Tpe V1 (n = 30) | 0.17 | 0.35 | 0.09 | 0.60 | −0.10 | 0.59 | 0.22 | 0.23 |
| Tpe/QT V1(n = 30) | 0.06 | 0.72 | 0.19 | 0.30 | −0.27 | 0.14 | 0.33 | 0.07 |
| Tpe V2 (n = 51) | 0.34 | 0.01 | 0.02 | 0.84 | 0.27 | 0.04 | −0.14 | 0.30 |
| Tpe/QT V2 (n = 51) | 0.27 | 0.05 | 0.03 | 0.81 | 0.11 | 0.43 | −0.04 | 0.75 |
| Tpe V3 (n = 52) | 0.40 | 0.003 | −0.15 | 0.27 | 0.46 | 0.001 | −0.39 | 0.004 |
| Tpe/QT V3 (n = 52) | 0.40 | 0.003 | −0.09 | 0.52 | 0.35 | 0.009 | −0.31 | 0.02 |
| Tpe V4 (n = 50) | −0.02 | 0.88 | −0.11 | 0.41 | 0.00 | 0.97 | −0.09 | 0.50 |
| Tpe/QT V4 (n = 50) | −0.02 | 0.84 | −0.05 | 0.71 | −0.10 | 0.45 | −0.01 | 0.92 |
| Tpe V5 (n = 49) | −0.11 | 0.41 | −0.07 | 0.60 | 0.07 | 0.60 | −0.14 | 0.30 |
| Tpe/QT V5 (n = 51) | −0.11 | 0.44 | −0.04 | 0.74 | −0.05 | 0.72 | −0.06 | 0.65 |
| Tpe V6 (n = 51) | 0.08 | 0.55 | −0.15 | 0.28 | 0.05 | 0.70 | −0.06 | 0.67 |
| Tpe/QT V6 (n = 51) | 0.09 | 0.52 | −0.09 | 0.48 | −0.05 | 0.69 | 0.02 | 0.86 |
| mean Tpe (n = 52) | 0.16 | 0.24 | −0.13 | 0.34 | 0.17 | 0.21 | −0.18 | 0.19 |
| mean Tpe/QT (n = 52) | 0.12 | 0.36 | −0.04 | 0.73 | 0.00 | 0.99 | −0.04 | 0.74 |
| maximum Tpe (n = 52) | 0.20 | 0.15 | −0.09 | 0.50 | 0.31 | 0.02 | −0.23 | 0.09 |
| maximum Tpe/QT (n = 52) | 0.22 | 0.11 | 0.00 | 0.97 | 0.17 | 0.20 | −0.12 | 0.38 |
| Tped (n = 52) | 0.24 | 0.07 | 0.04 | 0.74 | 0.34 | 0.01 | −0.22 | 0.10 |
LVMI: left ventricular mass index; QTd: QT dispersion; r: Pearson correlation coefficient; Tpe: Tpeak - Tend; Tped: Tpeak - Tend dispersion.
The relationship between repolarization parameters and indices of diastolic function were then examined (Table 3). A wave velocity correlated with QT (r = 0.41; P = 0.002), Tpe in lead V2 (r = 0.27; P = 0.04), Tpe and Tpe/QT in lead V3 (r = 0.46, P = 0.001; r = 0.35, P = 0.009, respectively), maximum Tpe (r = 0.31, P = 0.02) and Tpe dispersion (r = 0.34; P = 0.01); E/A ratio was inversely correlated with QT (r = −0.33, P = 0.01), Tpe and Tpe/QT in lead V3 (r = −0.39, P = 0.004; r = −0.31, P = 0.02, respectively; Figure 4 and Figure 5). Moreover, Tpe, Tpe/QT and Tped showed statistically significant associations with the occurrence of VPBs (Table 4). Dividing hypertensive patients with and without VPBs, no difference in ECG or echocardiographic parameters were observed (P > 0.05 in all cases). By contrast, comparing patients with and without complex VPBs, E velocity was lower, A velocity was greater leading to a lower E/A ratio in those with complex VPBs (P < 0.05), suggesting that abnormal diastolic function was observed in hypertensive patients with complex VPBs (Table 5). LVMI was similar in both groups (P > 0.05). Among the ECG parameters, Tped was the only one significantly greater in patients with VPBs (P = 0.03).
Figure 4. Scatterplot of Tpe in lead V3 against E/A ratio.
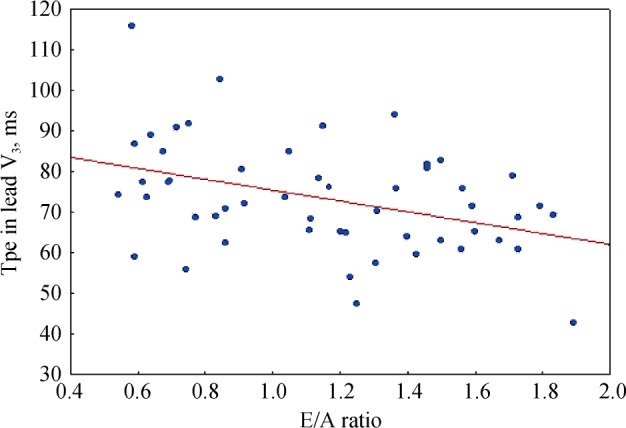
There was a significant correlation between Tpe measured in V3 and E/A ratio. Tpe: Tpeak - Tend.
Figure 5. Scatterplot of Tpe/QT in lead V3 against E/A ratio.
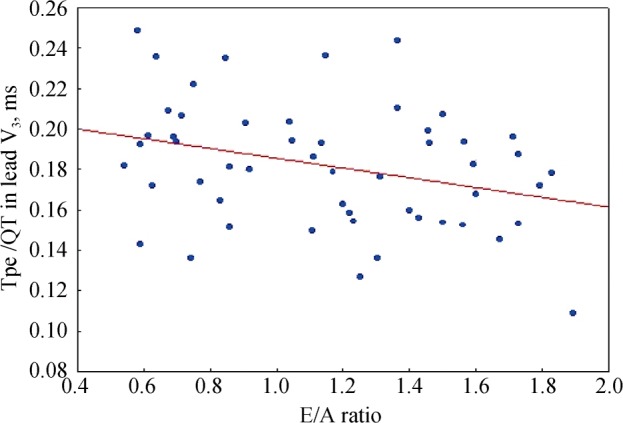
There was a significant correlation between Tpe/QT measured in V3 and E/A ratio. Tpe: Tpeak - Tend.
Table 4. Odds ratio for predicting occurrence of ventricular premature beats using different repolarization indices from univariate analysis.
| Parameter | Odds ratio | 95% Confidence interval | P |
| Tpe V3 > 60 ms | 12 | 1.3218; 108.9418 | 0.008 |
| Tpe V5 > 59 ms | 10.5926 | 2.3999; 46.7524 | 0.0006 |
| mean Tpe > 62 ms | 13.1818 | 2.4831; 69.9772 | 0.0005 |
| maximum Tpe > 71 ms | 5.0625 | 1.2993; 19.7249 | 0.01 |
| Tped > 13 ms | 7.25 | 1.3297; 39.5283 | 0.01 |
| Tpe/QT V5 > 0.151 | 3.8413 | 1.1289; 13.0703 | 0.02 |
| mean Tpe/QT > 0.150 | 9.375 | 1.0069; 87.2874 | 0.01 |
Tpe: Tpeak - Tend; Tped: Tpeak - Tend dispersion.
Table 5. Values of echocardiographic and electrocardiographic parameters in patients with and without complex ventricular premature beats.
| Parameter | Mean value (n = 52) | With complex VPBs (n = 11; 21.2%) | Without complex VPBs (n = 41; 78.8%) | P |
| LVMI, g/m2 | 92.40 ± 20.37 | 97.54 ± 24.46 | 91.02 ± 19.24 | 0.35 |
| E, m/s | 0.68 ± 0.15 | 0.58 ± 0.11 | 0.71 ± 0.15 | 0.01 |
| A, m/s | 0.62 ± 0.15 | 0.72 ± 0.13 | 0.60 ± 0.14 | 0.01 |
| E/A ratio | 1.14 ± 0.39 | 0.83 ± 0.21 | 1.23 ± 0.39 | 0.002 |
| QT | 420.5 ± 26.3 | 425.4 ± 27.6 | 419.2 ± 26.1 | 0.49 |
| QTd | 47.8 ± 19.3 | 47.8 ± 15.3 | 47.8 ± 20.4 | 0.99 |
| Tpe V1 | 57.9 ± 9.7 | 57.6 ± 10.5 | 58.1 ± 9.61 | 0.89 |
| Tpe/QT V1 | 0.1496 ± 0.0253 | 0.1485 ± 0.0288 | 0.1501 ± 0.0243 | 0.87 |
| Tpe V2 | 71.8 ± 10.5 | 72.8 ± 11.3 | 71.5 ± 10.4 | 0.71 |
| Tpe/QT V2 | 0.1815 ± 0.0238 | 0.1856 ± 0.0281 | 0.1804 ± 0.0227 | 0.53 |
| Tpe V3 | 73.4 ± 13.4 | 79.0 ± 7.5 | 71.9 ± 14.3 | 0.11 |
| Tpe/QT V3 | 0.1819 ± 0.0306 | 0.1941 ± 0.0152 | 0.1786 ± 0.0329 | 0.13 |
| Tpe V4 | 70.2 ± 12.4 | 75.4 ± 7.7 | 69.0 ± 13.0 | 0.16 |
| Tpe/QT V4 | 0.1745 ± 0.0301 | 0.1843 ± 0.0169 | 0.1723 ± 0.0320 | 0.28 |
| Tpe V5 | 68.2 ± 11.6 | 72.2 ± 12.8 | 67.1 ± 11.2 | 0.21 |
| Tpe/QT V5 | 0.1675 ± 0.0262 | 0.1752 ± 0.0260 | 0.1656 ± 0.0262 | 0.30 |
| Tpe V6 | 63.0 ± 10.9 | 66.7 ± 12.8 | 62.0 ± 10.2 | 0.20 |
| Tpe/QT V6 | 0.1540 ± 0.0243 | 0.1600 ± 0.0263 | 0.1523 ± 0.0238 | 0.35 |
| Mean Tpe | 68.1 ± 8.2 | 70.9 ± 6.0 | 67.3 ± 8.6 | 0.20 |
| Mean Tpe/QT | 0.1698 ± 0.0199 | 0.1752 ± 0.0128 | 0.1683 ± 0.021 | 0.30 |
| Maximum Tpe | 79.2 ± 10.8 | 83.4 ± 7.9 | 78.1 ± 11.2 | 0.14 |
| Maximum Tpe/QT | 0.1963 ± 0.0232 | 0.2048 ± 0.0124 | 0.1941 ± 0.0250 | 0.17 |
| Tped | 23.5 ± 9.7 | 29.0 ± 5.8 | 22.0 ± 10.1 | 0.03 |
LVMI: left ventricular mass index; QTd: QT dispersion; Tpe: Tpeak - Tend; Tped: Tpeak - Tend dispersion; VPBs: ventricular premature beats.
4. Discussion
Previous clinical studies have demonstrated an association between increased QT interval duration and the risk of cardiovascular events in hypertensive patients, whether in the presence or absence of left ventricular remodeling, and with or without controlled blood pressure.[7],[8] Prolonged QT intervals are observed in left ventricular hypertrophy diagnosed by ECG voltage criteria[9] or echocardiography,[10]–[12] and correlate with LVMI.[10] Our study showed that QT durations did not alter with LVMI or left ventricular geometry. This may be explained by differing severity of hypertrophy, genetic factors and the presence of additional comorbidities. Our study group included patients with grades I and II hypertension without electrocardiographic evidence of LVH, with low values of LVMI (mean LVMI of 92.40 ± 20.37 g/m2).
Our findings on the correlations of QT duration with indices of left ventricular diastolic function are consistent with those published in the literature. Thus, Mayet, et al. [10] reported an inverse correlation of QT with E/A ratio in hypertensive subjects and Gunduz, et al.[13] demonstrated increased QT intervals with higher levels of left ventricular diastolic dysfunction. These findings are supported by reports from a subsequent study[14] that used tissue Doppler echocardiography and showed a positive correlation between QT and E/e' ratio and also variations of QT interval with the degree of left ventricular diastolic dysfunction, in patients with ischemic cardiomyopathy and patients with hypertension.
Several studies have demonstrated increased QT dispersion in hypertensive cardiomyopathy.[10],[15] However, its association with LVMI and whether it varies with different ventricular geometry are controversial.[15],[16] Furthermore, QT dispersion was not found to have independent predictive value for sudden death or cardiovascular mortality in hypertensive patients.[17] QT dispersion is nowadays regarded as an insufficient and inaccurate marker of repolarization dispersion.[18] In our study, QT dispersion did not vary significantly with the parameters of left ventricular remodeling.
Our study also measured additional repolarization parameters such as Tpe, Tpe/QT and Tpe dispersion. Experiments conducted in arterially-perfused canine wedge preparations demonstrated that the end of epicardial repolarization coincided with the Tpeak and at the M-cell coincided with Tend, suggesting that Tpeak - Tend reflected higher transmural dispersion of repolarization.[19] However, subsequent experiments in pig hearts showed that Tpe was instead a marker of global dispersion of repolarization.[20]–[22] A recent systematic review and meta-analysis found that Tpe was a significant predictor of ventricular arrhythmias and sudden cardiac death.[23] Other repolarization indices have also demonstrated variable predictive values for ventricular arrhythmias.[21]
In our study, repolarization indices from leads V2 and V3 correlated significantly with left ventricular diastolic parameters. Since these leads reflect the electrical activity of the right ventricle and inter-ventricular septum, respectively, this may suggest remodeling of the right ventricle and septum. Other possibilities include a counterclockwise rotation. The fact that V3 showed the best correlations would suggest that septum involvement was greater. The repolarization markers, Tpe and Tpe/QT, were also examined previously in patients with hypertension.[11],[12],[24] Firstly, the Wolk study determined Tpe interval from 12 leads in hypertensive subjects with and without LVH.[24] It found similar Tpe intervals between the groups, with the exception of lead V2, in which Tpe was significantly higher in the presence of LVH. A different study evaluated Tpe values from V4-V6 in normotensive subjects versus hypertensive patients with or without LVH.[11] The conclusion was that LVH increases Tpe interval and Tpe/QT ratio. Finally, a study analyzed a cohort of grade II hypertensive patients, demonstrating that QT and Tpe intervals were higher in those with LVH than those without LVH.[12]
These findings differed from those of our study in many respects. Higher values of QT interval, Tpe interval and Tpe/QT ratio observed in previous cohorts[11],[12] than those reported in our study. This may be due to less stringent and more sensitive criteria for the diagnosis of LVH used in the current study, which is in accordance with current guideline recommendations (LVMI > 115 g/m2 in men and > 95 in women).[6] By contrast, the Wolk study used LVMI > 134 g/m2 in men and > 110 g/m2 in women,[24] the Zhao study used LVMI > 125 g/m2 in men and > 110 g/m2 in women and additionally the thickness of the interventricular septum and posterior wall ≥ 12 mm,[11] and the Mozos study used a combination of ECG voltage and echocardiographic criteria (thickness of interventricular septum and posterior wall > 10 mm in women and > 11 mm in men).[12] Moreover, these studies did not examine the correlation between ECG repolarization indices and echocardiographic indices of ventricular remodeling such as LVMI. The novelty of our study is that we showed significant correlations of the LVMI with Tpe and Tpe/QT measured in leads V2 and V3.
Data with respect to the relationship between Tpe and left ventricular diastolic function indices is scarce and controversial. Sauer et al. found higher values of Tpe measured in V5 in patients with left ventricular diastolic dysfunction compared with normal subjects[25] while Tamer et al. found no correlation.[26] We found a significant reverse correlation between Tpe and Tpe/QT in lead V3 and E/A ratio.
In addition, Tpe, Tpe/QT and Tped had significant association with occurrence of VPBs.
Subgroup analysis was performed for ventricular geometry, for which we have identified correlations with LVMI and the diastolic parameters. However, parameters of repolarization dispersion did not vary with different geometric types. This may be attributed to our selection of mild to moderate hypertensive patients who had no electrocardiographic evidence of hypertrophy. Our results suggest increasing duration of the markers of dispersion of ventricular repolarization with the progression of diastolic dysfunction in patients with mild to moderate hypertension and early changes of hypertensive cardiomyopathy. Lead V3 is the most relevant for the assessment of dispersion of ventricular repolarization in hypertensive patients due to its correlations with the parameters of left ventricular remodeling and diastolic function and its associations with increased ventricular arrhythmic risk.
5. Limitations
There are several limitations of this study which should be noted. Firstly, we examined a small group of patients with mild to moderate hypertension, without electrocardiographic criteria of left ventricular hypertrophy, thus without or with incipient changes of hypertensive cardiomyopathy. Secondly, the measurements of dispersion of repolarization were made on a stable RR interval (with a heart rate between 55 and 85 bpm; we used 3 consecutive complexes which were then averaged), during the declared wake-up period and at rest, in order to have the same conditions as during echocardiography. However, we cannot exclude variability in these indices throughout the day.
6. Conclusions
In summary, Tpe interval and Tpe/QT ratio appear to perform better in distinguishing hypertensive patients with adverse ventricular remodeling and increased risk for occurrence of ventricular premature beats compared to classical parameters (QT interval and QT dispersion). Lead V3 is more sensitive in detecting alterations in these ECG parameters. Further studies are needed to assess the utility of Tpe dispersion for risk stratification in hypertensive patients.
Acknowledgments
This paper was supported by the Sectoral Operational Programme Human Resources Development (SOP HRD) 2007–2013, financed from the European Social Fund and by the Romanian Government under the contract number POSDRU/107/1.5/S/82839.
References
- 1.Tse G, Yeo JM. Conduction abnormalities and ventricular arrhythmogenesis: The roles of sodium channels and gap junctions. Int J Cardiol Heart Vasc. 2015;9:75–82. doi: 10.1016/j.ijcha.2015.10.003. [DOI] [PMC free article] [PubMed] [Google Scholar]
- 2.Davidenko JM, Cohen L, Goodrow R, et al. Quinidine-induced action potential prolongation, early afterdepolarizations, and triggered activity in canine Purkinje fibers. Effects of stimulation rate, potassium, and magnesium. Circulation. 1989;79:674–686. doi: 10.1161/01.cir.79.3.674. [DOI] [PubMed] [Google Scholar]
- 3.Antzelevitch C, Fish J. Electrical heterogeneity within the ventricular wall. Basic Res Cardiol. 2001;96:517–527. doi: 10.1007/s003950170002. [DOI] [PubMed] [Google Scholar]
- 4.Tse G, Yan BP. Traditional and novel electrocardiographic conduction and repolarization markers of sudden cardiac death. Europace. 2016;5:712–721. doi: 10.1093/europace/euw280. [DOI] [PubMed] [Google Scholar]
- 5.Mancia G, Fagard R, Narkiewicz K, et al. 2013 ESH/ESC guidelines for the management of arterial hypertension: the task force for the management of arterial hypertension of the European Society of Hypertension (ESH) and of the European Society of Cardiology (ESC) Eur Heart J. 2013;34:2159–2219. doi: 10.1093/eurheartj/eht151. [DOI] [PubMed] [Google Scholar]
- 6.Lang RM, Bierig M, Devereux RB, et al. Recommendations for chamber quantification: a report from the American Society of Echocardiography's Guidelines and Standards Committee and the Chamber Quantification Writing Group, developed in conjunction with the European Association of Echocardiography, a branch of the European Society of Cardiology. J Am Soc Echocardiogr. 2005;18:1440–1463. doi: 10.1016/j.echo.2005.10.005. [DOI] [PubMed] [Google Scholar]
- 7.Oikarinen L, Nieminen MS, Viitasalo M, et al. QRS duration and QT interval predict mortality in hypertensive patients with left ventricular hypertrophy: the Losartan Intervention for Endpoint Reduction in Hypertension Study. Hypertension. 2004;43:1029–1034. doi: 10.1161/01.HYP.0000125230.46080.c6. [DOI] [PubMed] [Google Scholar]
- 8.Schillaci G, Pirro M, Ronti T, et al. Prognostic impact of prolonged ventricular repolarization in hypertension. Arch Intern Med. 2006;166:909–913. doi: 10.1001/archinte.166.8.909. [DOI] [PubMed] [Google Scholar]
- 9.Oikarinen L, Nieminen MS, Viitasalo M, et al. Relation of QT interval and QT dispersion to echocardiographic left ventricular hypertrophy and geometric pattern in hypertensive patients. The LIFE study. The Losartan intervention for endpoint reduction. J Hypertens. 2001;19:1883–1891. doi: 10.1097/00004872-200110000-00025. [DOI] [PubMed] [Google Scholar]
- 10.Mayet J, Shahi M, McGrath K, et al. Left ventricular hypertrophy and QT dispersion in hypertension. Hypertension. 1996;28:791–796. doi: 10.1161/01.hyp.28.5.791. [DOI] [PubMed] [Google Scholar]
- 11.Zhao Z, Yuan Z, Ji, Wu Y, et al. Left ventricular hypertrophy amplifies the QT, and Tp-e intervals and the Tp-e/ QT ratio of left chest ECG. J Biomed Res. 2010;24:69–72. doi: 10.1016/S1674-8301(10)60011-5. [DOI] [PMC free article] [PubMed] [Google Scholar]
- 12.Mozos I, Serban C. The relation between QT interval and T-wave variables in hypertensive patients. J Pharm Bioallied Sci. 2011;3:339–344. doi: 10.4103/0975-7406.84433. [DOI] [PMC free article] [PubMed] [Google Scholar]
- 13.Gunduz H, Akdemir R, Binak E, et al. Relation between stage of left ventricular diastolic dysfunction and QT dispersion. Acta Cardiol. 2003;58:303–308. doi: 10.2143/AC.58.4.2005287. [DOI] [PubMed] [Google Scholar]
- 14.Wilcox JE, Rosenberg J, Vallakati A, et al. Usefulness of electrocardiographic QT interval to predict left ventricular diastolic dysfunction. Am J Cardiol. 2011;108:1760–1766. doi: 10.1016/j.amjcard.2011.07.050. [DOI] [PMC free article] [PubMed] [Google Scholar]
- 15.Tomiyama H, Doba N, Fu Y, et al. Left ventricular geometric patterns and QT dispersion in borderline and mild hypertension: their evolution and regression. Am J Hypertens. 1998;11:286–292. doi: 10.1016/s0895-7061(97)00460-3. [DOI] [PubMed] [Google Scholar]
- 16.Kohno I, Takusagawa M, Yin D, et al. QT dispersion in dipper- and nondipper-type hypertension. Am J Hypertens. 1998;11:280–285. doi: 10.1016/s0895-7061(97)00474-3. [DOI] [PubMed] [Google Scholar]
- 17.Galinier M, Balanescu S, Fourcade J, et al. Prognostic value of arrhythmogenic markers in systemic hypertension. Eur Heart J. 1997;18:1484–1491. doi: 10.1093/oxfordjournals.eurheartj.a015476. [DOI] [PubMed] [Google Scholar]
- 18.Malik M, Batchvarov VN. Measurement, interpretation and clinical potential of QT dispersion. J Am Coll Cardiol. 2000;36:1749–1766. doi: 10.1016/s0735-1097(00)00962-1. [DOI] [PubMed] [Google Scholar]
- 19.Antzelevitch C, Shimizu W, Yan GX, et al. The M cell: its contribution to the ECG and to normal and abnormal electrical function of the heart. J Cardiovasc Electrophysiol. 1999;10:1124–1152. doi: 10.1111/j.1540-8167.1999.tb00287.x. [DOI] [PubMed] [Google Scholar]
- 20.Xia Y, Liang Y, Kongstad O, et al. Tpeak-Tend interval as an index of global dispersion of ventricular repolarization: evaluations using monophasic action potential mapping of the epi- and endocardium in swine. J Interv Card Electrophysiol. 2005;14:79–87. doi: 10.1007/s10840-005-4592-4. [DOI] [PubMed] [Google Scholar]
- 21.Xia Y, Liang Y, Kongstad O, et al. In vivo validation of the coincidence of the peak and end of the T wave with full repolarization of the epicardium and endocardium in swine. Heart Rhythm. 2005;2:162–169. doi: 10.1016/j.hrthm.2004.11.011. [DOI] [PubMed] [Google Scholar]
- 22.Opthof T, Coronel R, Wilms-Schopman FJ, et al. Dispersion of repolarization in canine ventricle and the electrocardiographic T wave: Tp-e interval does not reflect transmural dispersion. Heart Rhythm. 2007;4:341–348. doi: 10.1016/j.hrthm.2006.11.022. [DOI] [PubMed] [Google Scholar]
- 23.Tse G, Gong M, Wong WT, et al. The Tpeak - Tend interval as an electrocardiographic risk marker of arrhythmic and mortality outcomes: A systematic review and meta-analysis. Heart Rhythm. 2017;14:639–640. doi: 10.1016/j.hrthm.2017.05.031. [DOI] [PubMed] [Google Scholar]
- 24.Wolk R, Mazurek T, Lusawa T, et al. Left ventricular hypertrophy increases transepicardial dispersion of repolarisation in hypertensive patients: a differential effect on QTpeak and QTend dispersion. Eur J Clin Invest. 2001;31:563–569. doi: 10.1046/j.1365-2362.2001.00850.x. [DOI] [PubMed] [Google Scholar]
- 25.Sauer A, et al. Diastolic electromechanical coupling: association of the electrocardiographic T-peak to T-end interval with echocardiographic markers of diastolic dysfunction. Circ Arrhythm Electrophysiol. 2012;5:537–543. doi: 10.1161/CIRCEP.111.969717. [DOI] [PMC free article] [PubMed] [Google Scholar]
- 26.Tamer T, Sayed K, Saad M, et al. How accurate can electrocardiogram predict left ventricular diastolic dysfunction? Egypt Heart J. 2016;68:117–123. [Google Scholar]
Associated Data
This section collects any data citations, data availability statements, or supplementary materials included in this article.