Abstract
In this paper, we investigate the effects of increasing mechanical stress on the knee joints by recording knee acoustical emissions and analyze them using an unsupervised graph mining algorithm. We placed miniature contact microphones on four different locations: on the lateral and medial sides of the patella and superficial to the lateral and medial meniscus. We extracted audio features in both time and frequency domains from the acoustical signals and calculated the graph community factor (GCF): an index of heterogeneity (variation) in the sounds due to different loading conditions enforced on the knee. To determine the GCF, a k-Nearest Neighbor graph was constructed and an Infomap community detection algorithm was used to extract all potential clusters within the graph – the number of detected communities were then quantified with GCF. Measurements from twelve healthy subjects showed that the GCF increased monotonically and significantly with vertical loading forces (mean GCF for no load = 30 and mean GCF for maximum load [body weight] = 39). This suggests that the increased complexity of the emitted sounds is related to the increased forces on the joint. In addition, microphones placed on the medial side of the patella and superficial to the lateral meniscus produced the most variation in the joint sounds. This information can be used to determine the optimal location for the microphones to obtain acoustical emissions with greatest sensitivity to loading. In future work, joint loading quantification based on acoustical emissions and derived GCF can be used for assessing cumulative knee usage and loading during activities, for example for patients rehabilitating knee injuries.
Index Terms: Joint acoustical emissions, graph community factor, Infomap, loading
I. Introduction
Wearable knee health sensing technologies can benefit patients, athletes, and warfighters in myriad applications, ranging from knee injury rehabilitation assistance to quantifying cumulative knee usage and loading during normal activities. Existing technologies for monitoring knee health are mainly confined to clinical or laboratory settings only, consisting of approaches such as medical imaging [1] (i.e., magnetic resonance imaging [MRI] or ultrasound), motion capture and equipment for quantifying kinematics [2], and other expensive and bulky instrumentation requiring a trained clinician or operator. While these technologies provide great value in facilitating one-time assessments like those needed for acute injury diagnosis [3], they are not well-suited for continuous monitoring needs. For example, an athlete rehabilitating a knee injury cannot feasibly receive an MRI every week just to assess their progress. An MRI is time intensive, confined to a clinical setting, difficult to schedule, and its high cost is prohibitive – particularly for underserved population. There is a compelling need to enable continuous knee health sensing using inexpensive technologies that still provide in-depth information regarding knee physiology or function, and that can potentially be used ubiquitously.
Recent work has shown that robust and repeatable measurements of knee electrical bioimpedance (EBI) and acoustical emissions can be obtained using inexpensive and wearable sensors [4–6]. Hersek, et al. demonstrated high resolution EBI measurements from the knee with a combination of a custom discrete analog circuit and algorithms for self-calibration and automatic body position determination [4]. These EBI measures were shown to be significantly different for subjects following acute knee injury, since local fluid accumulation (edema) reduced the overall resistance of the knee and damage to cell membranes from the injury reduced the capacitive component of the impedance. Teague, et al. demonstrated, for the first time, wearable measurements of knee acoustical emissions [5]. The measurements were found to be consistent for healthy subjects in terms of the characteristics of the knee sounds in the context of joint angle during unloaded flexion/extension exercises. Toreyin, et al. established the consistency in the measurements of wearable knee acoustical emissions during complex motions even in the presence of loud background noise [6]. The researchers were successful in extracting joint sound features in loud environments and demonstrated the consistency of these features in ambulatory subjects performing everyday activities such as walking and sit-to-stand.
The ability to measure such parameters of the knee with wearable technologies introduces the possibility of quantifying aspects of knee health and use that were previously infeasible. One such aspect that is of interest clinically and scientifically is the quantification of vertical loading forces experienced by the knee throughout daily living activities and exercises. Prior work in estimating knee loading forces has used instrumented knee implants to quantify loading in vivo [7], or biomechanical modeling techniques to estimate loading profiles [8]. However, estimation of vertical loading forces in the knee using wearable, non-invasive sensing has never been previously demonstrated.
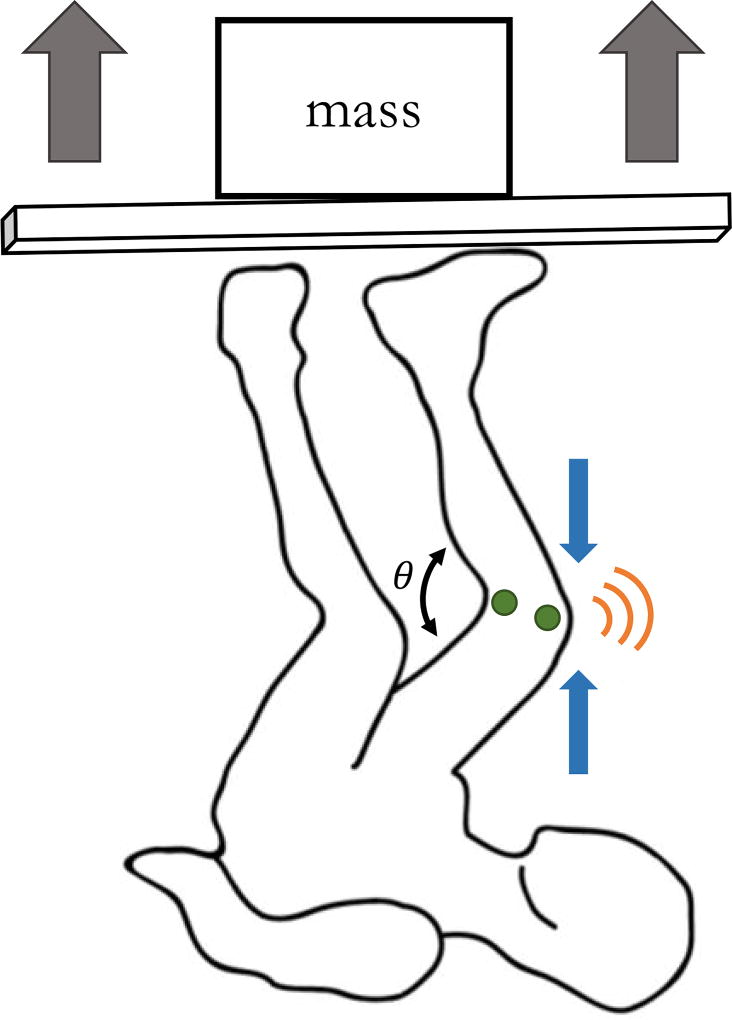
In this work, we investigate whether the characteristics of acoustical emissions from the joint change in a quantifiable and monotonic manner in response to increased biomechanical stress on the joint during a standard movement. We predict that as the internal stress on the knee increases, additional interactions between the articulating surfaces may occur and cause a more complex acoustic profile. Fig. 1 provides an illustration of our hypothesis and Fig. 2 shows the measurement setup used for assessing loading effects, based on a vertical leg press with varying weight and the measurement of acoustical emissions from the knee.
Fig. 1.
Illustration of the effects of vertical loading forces on the acoustic emissions resulting from increased biomechanical stress on the internal surfaces in the knee.
Fig. 2.
Illustration of the measurement setup, with the subject performing vertical leg press at varying weights up to the body weight, and the measurements of acoustical emission
We leveraged graph mining algorithms [9] to quantify this complexity, and evaluated our approach in a study of able-bodied subjects. To the best of our knowledge, this is the first-time the effects of joint loading forces on acoustical emissions is quantified. We expect that this work will form a foundation for future efforts aimed at quantifying loading based on wearable measurements of joint acoustical emissions throughout activities of daily living and in a broader range of movements and exercises.
II. Methodology
A. Human Subjects Study and Measurement Protocol
Twelve healthy subjects with no prior injuries were recruited for the study which was approved by the Georgia Institute of Technology Institutional Review Board (IRB). Subject demographics are described in Table 1.
TABLE I.
Demographic Data for Study Participants
| Male | Female | |
|---|---|---|
| Number of Subjects | 9 | 3 |
| Age (mean ± σ, in years) | 24.3 ± 1.9 | 25.3 ± 2.1 |
| Height (mean ± σ, in cm) | 175.1 ± 3.5 | 155 ± 2.7 |
| Weight (mean ± σ, in kg) | 74.3 ± 9.9 | 50.7 ± 7.2 |
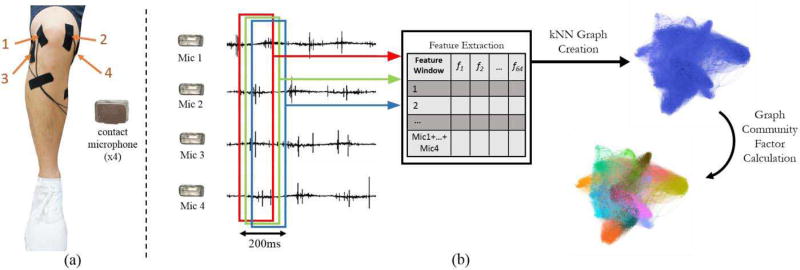
For each subject, four miniature (7.9 × 5.5 × 4.1 mm) contact microphones (BU-23173-000, Knowles Electronics LLC., USA) were attached to the medial and lateral sides of the patella and superficial to the lateral and medial meniscus using Kinesio Tex tape (see Fig. 3(a)). 4 microphones were used to capture a broad range of the acoustical emissions. The anatomic positions were selected because of their ease of use as prominent landmarks for repeated placement of the microphones between subjects. The biomechanics of the joint was also considered in choosing these placement locations. The patella experiences significant frictional forces from the movement of the quadriceps tendon during flexion extension and is directly superior to the articulating surfaces of the femur and tibia. The menisci are a pair of crescent-shaped, fibrocartilaginous pads that provide structural integrity to the knee when it undergoes torsion and tension, and can disperse the load and relieve friction over the articular surfaces of the femur and tibia in the knee. As we increase the compressive forces to these locations with external loading, we expect to see a change in the emitted sounds by the complex interaction between these surfaces. The contact microphone, which are piezoelectric sensors with broad bandwidth (>20 kHz) and low output noise (7 μVrms “A” weighted), were selected as they provide high quality acoustical pick-up from the body while maintaining a small footprint amenable for wearable use. The subjects were then asked to perform ten repetitions of vertical leg press with different loading conditions. Vertical leg press was selected as the exercise for this study since it allows for vertical loading at the knee joint to be varied in a controlled manner up to a sufficiently large load (i.e. body weight) to notice effects on the acoustical emissions. There was a total of four loading conditions, starting with zero load (no weights), and increasing by a third of the subject’s body weight up to the full weight of the subject. The audio signals from each microphone were pre-amplified using a custom analog front-end consisting of a voltage regulator, setting a 3V supply used for powering the microphones and amplifiers, a low noise amplifier with a voltage gain of 100, and 180 kHz bandwidth, and a bandpass filter (bandwidth: 16 Hz–20 kHz, Butterworth). The amplified signals were then sampled at 50 kHz (16bits/sample) using NI USB-6225 data acquisition hardware (NI, Austin, TX, USA). All signals were recorded on a laptop using LabVIEW System Design Software (NI, Austin, TX, USA) and were processed using MATLAB (The Mathworks, Naticks, MA, USA) and RStudio (RStudio, Boston, MA, USA).
Fig. 3.
Sensor placement and overview of the method of how the signals acquired are analyzed. (a) Four contact microphones are placed on the medial and lateral sides of the patella and superficially to the medial and lateral meniscus (b) The signal analysis workflow for knee joint sounds. The signals from the dominant knee of the subjects are filtered and standardized (to zero mean and unity variance) and windowed (frame length of 200 ms with 90% overlap). The features are extracted for all four mics and vertically concatenated where columns represent the features and rows represent all the windowed segments. The rows represent all the windows in microphone 1 to microphone 4 and the columns represent the 64 features. A k-Nearest Neighbor graph (kNN graph) is constructed from the matrix formed using data from the dominant knee and calculates the graph community factor (GCF) using the graph community detection algorithm.
B. Joint Sound Pre-Processing and Feature Extraction
The overall signal processing and feature extraction steps are illustrated in Fig. 3(b). The acoustical signals were acquired during ten repetitions of vertical leg press cycles on the dominant leg of the subject. The signals were digitally filtered using a Kaiser-window finite impulse response bandpass filter with a bandwidth of 400 Hz – 20 kHz to remove the low-frequency interface noise between the tape, the skin and the microphone. The filtered signals were standardized with zero mean and unity variance to balance out any variations in the signal amplitude among sensors that could result from differences in contact pressure against the skin.
The normalized signals were then divided into segments (windows) with a duration of 200 ms and 90% overlap between successive segments. This segment duration and the overlap allowed multiple joint sound signatures to be present within a given frame. The features derived from each segment are summarized in Table 2 and many of them are described in detail in Giannakopoulos, et al. [10]. The features were selected empirically, and are commonly used in other audio signal processing applications. For example, the mel-frequency cepstrum coefficient (MFCC) [11] is prevalent in speech recognition analysis, for discriminating speech, music, and background noise [12].
TABLE II.
Audio Features for Knee Joint Sounds
| Feature Name | Equation | General Description and Significance | |
|---|---|---|---|
| Energy |
|
Total signal energy
|
|
| Zero CrossingRate |
|
Rate of sign changes:
|
|
| Energy Entropy |
|
Measure of abrupt changes in the energy level:
|
|
| Spectral Centroid and Spread |
|
Center of gravity of spectrum/ second central moment of spectrum:
|
|
| Spectral Entropy |
|
Like entropy but in frequency domain:
|
|
| Spectral Flux |
|
Measure of spectral change between two successive frames:
|
|
| Spectral Rolloff |
|
Frequency below which 90% of the signal energy (magnitude) is concentrated:
|
|
| MFCCs |
|
Coefficients that make up a representation of the short-term power spectrum of a sound, based on a linear cosine transform of a log power spectrum on a nonlinear mel scale of frequency:
|
|
| Band Powers |
|
Power of the signal in 29 distinct frequency bands, between 30 logarithmically spaced frequencies in the range of lkHz–15kHz:
|
For each windowed segment of each microphone, a total of 64 features were extracted and stored in a vector. For each loading condition, we vertically concatenated the features extracted from the windowed segments of all four microphones into one single matrix. Based on the common statistical learning rules found in [13] and [14], the number of features acquired for our dataset is a reasonable value.
C. Repeatability Testing
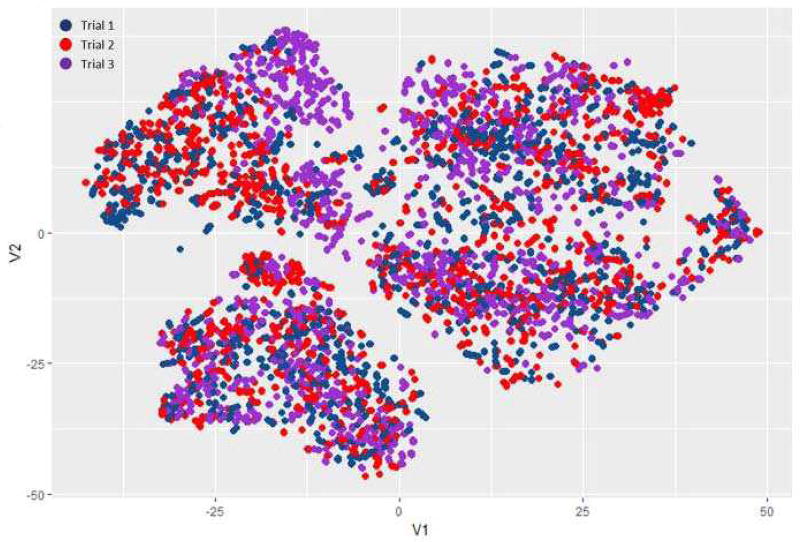
To test the repeatability of the measurements of placing the sensors and loading the joint, we have analyzed the acoustical emissions from five subjects over three different trials from different days using t-Stochastic Neighbor Embedding (t-SNE). This technique, t-SNE, reduces dimensionality by constructing a probability distribution over the points in the high-dimensional feature space and a similar probability distribution over the points in the low-dimensional map while minimizing Kullback-Leibler divergence between the two distributions with respect to the locations of the points in the feature space [15]. This minimization ensures that the mappings maintain the relations between each data point in the high dimensional space in the newly calculated low dimensional space. Each data point represents a 200 ms frame of the acoustical signals acquired while the subject performed one leg press. For visual representation, 64 feature set (64 dimensions) is reduced to two dimensions as shown in Fig. 5. Note the labels on the axis do not have any physical meaning, and instead describe the two calculated axes from the t-SNE dimension reduction. For each loading conditions, the plot showed little to no separation within the clusters of data points for three different trials. This indicates that the signals can be consistently measured from one day to the next.
Fig. 5.
A visual representation of the audio signal frames for three different trials on one subject for one of the loading conditions (two loads) using t-Stochastic Neighbor Embedding (t-SNE). The clusters from the three different trials heavily overlap indicating that the measurements are repeatable.
D. Proof-Of-Concept Study of Loading Effects During Walking
We considered an alternative exercise using an AlterG (AlterG, Inc., Fermont CA., USA), an anti-gravity treadmill that assists patients with fast recovery [16]. Illustrations for the measurement setup and the exercise movement are depicted in Fig. 9(a) and 9(b). The microphone placements were the same as the locations for the vertical leg press. Testing was performed on the AlterG treadmill because of its ability to alter the body weight (or load) on the knee joints while walking. This exercise provides a more real-world context to the nature of joint acoustical emissions during an everyday activity. The AlterG assessments further tested our proposed concept that an increased load on the joint leads to an increasingly complex acoustical emission. In the case of the AlterG device, we were able to decrease the load on the joint and thus test our hypothesis on joint loading conditions that were less than body weight during walking. Given that this exercise, and thus the movement/loads of the joint, are different between walking and performing leg presses, no cross comparisons across exercise are performed.
Fig. 9.
Alternative exercise that can measure joint sounds with different loads. (a) AlterG device allows the user to reduce their body weight by a designated percentage down to 20 percent. (b) Illustration of the activity and measurements of acoustical emissions from the joint with contact microphones with respect to the angle of the dominant knee. (c) Graphs created based on the sound features for all windows of the recording, and calculating the GCF score. Example graph from one subject is shown with different percentage of the body weight.
As a proof-of-concept, we recruited three subjects, under an IRB approved protocol, to perform 20 seconds of walking on the treadmill with two different weight conditions: 20% of the body weight (minimum), and 100% of the body weight (maximum). The swing phase was kept constant at a speed of 2.0mph. During the stance phase, the knee joint is relatively static and thus had relatively no acoustical emissions resulting from movement of the joint. Instead, it only depicts the noise caused by the foot hitting the ground which overpowers any knee joint sounds we hoped to record. As such, this period was omitted from the analysis. Same signal processing and feature extraction methods were used to extract the signals.
III. Graph Mining Algorithm
Our hypothesis is that increasing the vertical loading forces on the knee would increase heterogeneity among acoustical signals captured by the microphones. To investigate this matter, we utilized the concept in graph theory of quantifying heterogeneity by locating, and computing the number of, communities within the graph. We considered the combined features from microphones for a single loading condition as a data matrix X.
Our idea is that more loads should increase the number of sound sources in the knee and this would increase the heterogeneity within the captured signals by different microphones. Accordingly, the distribution of X should be modeled. Although this can be done using some statistical models such as Gaussian or student t-distributions [17], these techniques require strong assumptions about the high-dimensional shape of the data (e.g., ellipsoid versus convex) and model parameters (e.g. mean and standard deviation) which can cause many problems, such as unreliable bandwidth estimation for applied kernel density function.
To overcome these challenges, we reconstructed a k-Nearest Neighbor graph (kNN) from graph theory which previously has been successfully used by researchers to model and cluster high dimensional bioinformatics data [18, 19]. Our idea is that the constructed graph from a knee which experienced smaller loads should be less heterogeneous than the one that experiences higher loads. This heterogeneity can be modeled with the number of complex communities in the related graph: a greater number of graph “communities” should be needed to describe sounds emitted from a knee which is loaded with higher forces.
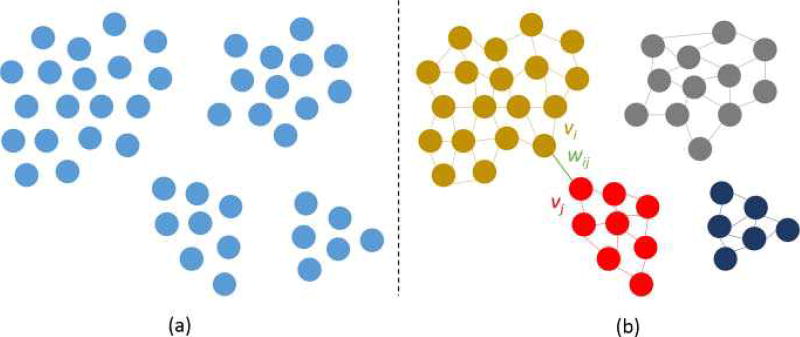
In this work, we define a kNN graph for each dataset X. Let KG = {V, E} indicate the kNN graph corresponding to X where V = {υ1, υ2, …, υN } is the set of vertices and E ⊆ V × V represents the set of edges among υi. In this graph, each vertex υi indicates one row (acoustical window) in X. To model the local neighbor of each window xi in X, the corresponding vertex υi is connected to its k nearest neighbors using Euclidean distance. Fig. 4 illustrates how each windowed segment will be grouped and differentiated into separate clusters. In this work, k was chosen to be 10 empirically. Other values were also investigated (e.g. 5–15) and similar results were obtained.
Fig. 4.
An example illustration of the clustering of the node (degree of 4). (a) General depiction of the dataset (b) Example graph where vi and vj represents vertex in the nodes and wij represents the weight of an edge between the two nodes.
If we only consider the Euclidean distance values [20] to assign related weights of edges between υi with its nearest neighbors, noisy data points would engender many problems. If there are some υi s expanding the dispersed zones between two different communities, we may not distinguish these two communities and merge them as one single community incorrectly. Hence, weights are reassigned to each graph edge using dice similarity [21], such that we incorporate the properties of each point’s neighborhood rather than relying on Euclidean distance alone in attributing points to clusters or communities. The dice similarity of υi and υj means twice the number of common neighbors divided by the sum of the degrees of υi and υj. Assuming υi and υj indicate two connected vertices within the kNN graph, the assigned weight for the edge between these two vertices is defined as,
| (1) |
where Ai and Bj denotes the set of the neighbors of υi and υj, respectively. Also, the degree of υi and υj are represented as Di and Dj, respectively and finally, the notation |*| is the number of elements in a set. Fig. 4(b) shows how the calculated weight will allow two edges, υi and υj, from different clusters not to be merged.
Once the weighted kNN graph is extracted, a community detection algorithm is applied to extract all the potential communities (clusters) within the kNN graph [22]. There are several community detection algorithms studied in graph theory that could be applied [23]. In this work, the Infomap community detection algorithm [24] is employed to quantify the communities of the kNN graph, since Infomap has been applied successfully in various areas of graph mining in different fields such as bioinformatics [25].
Infomap uses the probability flow of random walks on the network as a proxy for information flows and clusters the graph into multiple communities [26]. The algorithm searches for a partitioning of the kNN graph to minimize the expected description length of a random walk, and seeks to compress the description of information flow visited by a random walker on the network. Using Huffman code [27], all υi visited by a walker are recorded and coded. The walker takes a reasonable amount of time within the same community which results in longer walking process. The computational complexity of this algorithm is approximately O(|E|). For more detail, the reader is referred to [24]. In this work, the number of detected communities is shown with “GCF” (Graph Community Factor) which represents the heterogeneity of extracted kNN graph from the data matrix X.
One important note is that discovering of the potential communities in the kNN graph is tantamount to finding the number of clusters (dense areas) in a high dimensional dataset X. Applying regular clustering methodologies such as K-means and Gaussian Mixture Models are not possible in this problem, as these methods require the knowledge of the number of clusters (dense populations of acoustical windows) within the data matrix. We also note that applying a kernel-based density clustering algorithm [28] (as it automatically estimates the number of dense areas in data) on a 64-dimensional dataset X to find the clusters is challenging and not practical. The difficulty is that the curse of dimensionality causes the density detection in high dimension (in this problem 64) to be very time consuming and statistically not robust.
IV. Results and Discussion
A. Changes in the Gcf With Loading for All Microphones
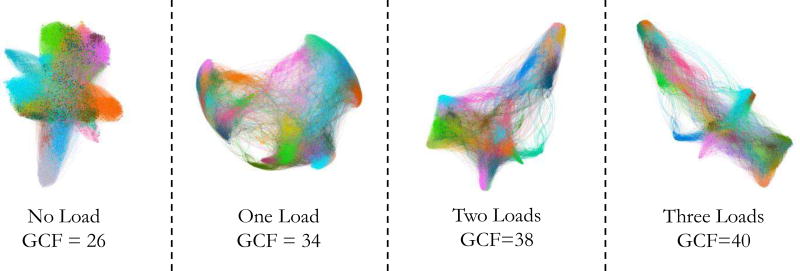
We evaluated the use of the graph mining algorithm to quantify the changes of acoustical emissions from the knee joints with respect to different vertical loading forces on twelve subjects. Four contact microphones were used to collect the joint sounds from various locations on the knee (medial and lateral of patella and meniscus). Fig. 6 illustrates the increasing trend of heterogeneity and the calculated GCF value with respect to different loading conditions for one representative subject. The knee graph is constructed from the individual loading data matrix where each data point (vertex in the graph) represents all the time and frequency domain features for one windowed frame of the acoustical emissions and different colors characterize different communities. The graph on the far left of Fig. 6 represents densely clustered nodes that are more homogeneous and close to one another in high dimensional space. As the loading conditions increase, the set of nodes in the graph become heterogeneous and geometrically more dispersed in space indicating a more variable feature set. The mean GCF values for no loading, one-third body weight (BW), two-thirds BW, and BW were 26, 34, 38, 40, respectively.
Fig. 6.
Graphs created based on the sound features for all windows of the recording, and calculating the GCF score. Example graph from one subject are shown with the associated loading condition and GCF. Different colors correspond to different groups of clusters, implying that higher GCF value represents more variation of colors in the graph.
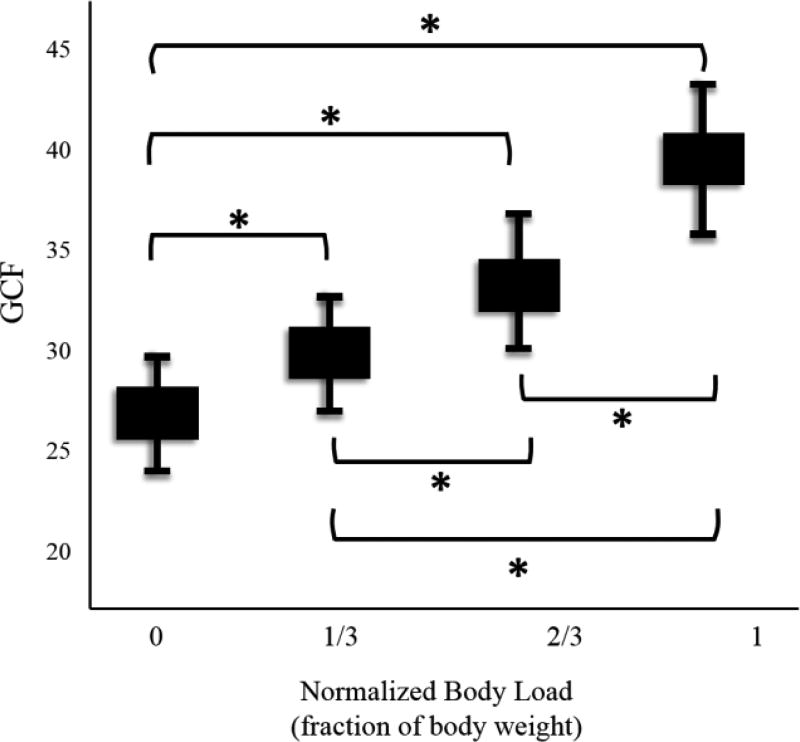
Fig. 7 provides a boxplot of the GCF values calculated for all subjects for each loading condition. The mean values for no load, one-third BW, two-thirds BW, and BW were 30, 32, 36, and 39. Since the sample size is not large, the non-parametric paired Kolmogorov-Smirnov test [29] was used to calculated the p-value (p<0.01). For twelve subjects, we demonstrated the increase in GCF of the acoustic emissions from the joints with respect to the increasing load level on the knee.
Fig. 7.
Boxplot showing GCF increases with loading for subject (n=12), indicating more heterogeneity for all acoustical signatures. The asterisk (*) represents the p-value less than 0.01 which is calculated using a non-parametric paired Kolmogorov-Smirnov test.
B. Changes in Gcf Across Microphone Locations
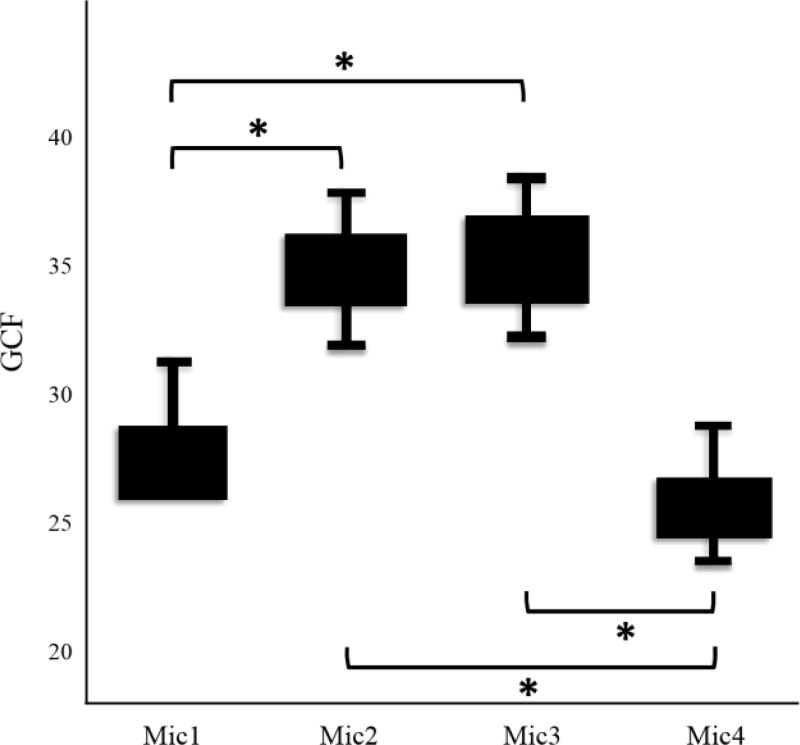
We also evaluated the characteristics of the acoustical signals across four different microphone locations to determine which locations had the most heterogeneity. Each microphone data matrix consists of all the segments and the features for the four loading conditions. Fig. 8 shows the boxplot of average GCF value for all subjects with respect to the microphone locations (numbers). Microphones 1,2,3, and 4 have mean GCF values of 26.4, 32.6, 33.5, and 23.8 respectively. We used the same non-parametric paired Kolmogorov-Smirnov test to calculate the p-value (p<0.01). Referring to Fig. 3(a), the results showed that locations 2 and 3 (medial side of the patella and superficial to the lateral meniscus, respectively) seem to show higher variation than the microphones placed on 1 and 4 (lateral side of the patella and superficial to the medial meniscus, respectively). The underlying anatomical sources of this variation are hypothesized as follows: microphone 1 is located on the superior lateral aspect of the knee which is principally superficial to the femur, quadriceps tendons, muscle, and fat. Microphone 3 placement includes the tibia collateral ligament, muscles, and the semi-membranous bursae, a jelly filled sacs in between ligament and bone, along with the previously mentioned lateral meniscus and associated connective tissue. In addition, the fibula connects to the tibia on this side of the leg, which could cause considerable differences from the sounds produced on the opposite side. The fibular collateral ligaments are located on the lateral side, close to microphone 3, which could contribute to more heterogeneity in that location since it is another source of tension on the joint when load is applied. Locations 1 to 4 (lower heterogeneity) and locations 2 to 3 (higher heterogeneity) makes an ‘X’ through the knee. There are several anatomical structures that follow a similar course through the region, and as such may be particularly potent contributors to the variations and heterogeneity seen. These structures include the two proximal heads of the gastrocnemius, the popliteus muscle/ligaments, and the anterior cruciate ligament (ACL) and posterior cruciate ligament (PCL).
Fig. 8.
Boxplot showing GCF for different microphones (locations on the knee). The data matrix consists of all loading conditions per microphone for each subject. The asterisk (*) indicates the p-value less than 0.01 which is calculated using a non-parametric paired Kolmogorov-Smirnov test.
C. Changes in Gcf During Walking With Loading
Using the graph mining technique from the acoustical signal obtained from three subjects, we found that the average GCF value increased from 26 to 33 as the body weight changed from 20% (minimum) to 100% (maximum), respectively (see Fig. 9(c)). This showed that changing the loading on the knee while walking has an impact on the knee joint acoustical emissions.
V. Conclusion and Future Work
This paper established a method of using a graph mining algorithm to quantify the impact that mechanical loading of the knee has on the joint sounds produced. We demonstrated that with increasing loading conditions, the acoustical emissions became more heterogeneous. Furthermore, we observed that there were more variations in microphone placement at the medial side of the patella and the lateral side of the meniscus.
Future work will include investigating the causes for the variation in signals due to microphone placement and which locations would provide the best signal quality. This will include a cadaveric dissection with microphones placed on the aforementioned anatomical structures. On the skin, microphones will continue to be placed on different parts of the knees superficially to find the optimal locations for maximizing signal quality. In addition, more subjects will be recruited for investigating how different loading and joint angle speed on different rehabilitation exercises can impact the acoustical emissions using the AlterG and their importance in the rehabilitation process. Longitudinal measurements of cumulative joint loading forces in athletes or patients rehabilitating knee injuries may provide a means of assessing knee use during normal activities or exercises, which can then be provided to the user as feedback.
Acknowledgments
This material is based upon work supported in part by the Defense Advanced Research Projects Agency, Arlington, VA under Contract No. W911NF-14-C-0058, and in part by the National Institutes of Health, National Institute of Biomedical Imaging and Bioengineering, Grant No. 1R01EB023808, as part of the NSF/NIH Smart and Connected Health Program.
Biographies

Hyeon Ki Jeong received the B.S. degree in electrical engineering from Georgia Institute of Technology, Atlanta, GA, USA, in 2016. He will be pursuing the M.S. degree in the School of Electrical and Computer Engineering. In 2015, he received the President’s Undergraduate Research Award from Georgia Tech. For his senior capstone, his team developed a gaming headband that uses motion control and brainwave signals to control a video game on the personal computer. His research interests include bio-signal processing and wearable device for biomedical applications.
Maziyar Baran Pouyan received the B.S. degree from the University of Isfahan, Isfahan, Iran, and the PhD. degree from the University of Texas at Dallas, Dallas, TX, USA, in 2006 and 2016, respectively, both in computer engineering. He is currently working as a postdoctoral researcher in Georgia Institute of Technology. His research interests include machine learning with an emphasis on single-cell data analysis, wearable sensing systems, and graph theory.

Venu G. Ganti received the B.S. degree in Electrical Engineering from the Georgia Institute of Technology, Atlanta, GA, USA, in 2017. He is currently working towards a Bioengineering Ph.D. degree within the Department of Electrical and Computer Engineering at Georgia Tech. He is a research assistant in Dr. O.T. Inan’s lab.
His research interests include non-invasive, real-time physiological monitoring devices that leverage novel signal processing and machine learning algorithms for predictive success.

Daniel C. Whittingslow received his B.S. degree in biomedical engineering from the Georgia Institute of Technology, Atlanta, GA, USA, in 2013. He is now working toward both his M.D. and Ph.D. degrees at the Emory School of Medicine and the Department of Biomedical Engineering at Georgia Tech.
He is currently working as a Research Assistant in Dr. O. T. Inan’s lab. His research interests include developing platforms for enabling long-term healthcare monitoring and helping to bring new technologies into the clinic.

Omer T. Inan (S’06–M’09–SM’15) received the B.S., M.S., and Ph.D. degrees in electrical engineering from Stanford University, Stanford, CA, in 2004, 2005, and 2009, respectively.
He joined ALZA Corporation (a Johnson and Johnson Company) in 2006, where he designed micropower circuits for iontophoretic drug delivery. In 2007, he joined Countryman Associates, Inc., Menlo Park, CA, USA, where he was Chief Engineer, involved in designing and developing high-end professional audio circuits and systems. From 2009 to 2013, he was also a Visiting Scholar with the Department of Electrical Engineering, Stanford University. Since 2013, he has been an Assistant Professor of Electrical and Computer Engineering at the Georgia Institute of Technology. He is also an Adjunct Assistant Professor with the Wallace H. Coulter Department of Biomedical Engineering. His research focuses on noninvasive physiologic sensing and modulation for human health and performance, including for chronic disease management, acute musculoskeletal injury recovery, and pediatric care.
He has published more than 100 technical articles in peerreviewed international journals and conferences, and has four issued and seven pending patents. He received the Gerald J. Lieberman Fellowship in 2008–2009 for outstanding scholarship, the Lockheed Dean’s Excellence in Teaching Award in 2016, and the Sigma Xi Young Faculty Award in 2017. He was a National Collegiate Athletic Association AllAmerican in the discus throw for three consecutive years from 2001 to 2003). He is an Associate Editor of the IEEE Journal of Biomedical Health and Informatics, an Associate Editor of the IEEE Engineering in Medicine and Biology Conference and the IEEE Biomedical and Health Informatics Conference, an Invited Member of the IEEE Technical Committee on Translational Engineering for Healthcare Innovation and the IEEE Technical Committee on Cardiopulmonary Systems, and Technical Program Committee Member or Track Chair for several other major international biomedical engineering conferences.
Contributor Information
Hyeon-Ki Jeong, the School of Electrical and Computer Engineering, Georgia Institute of Technology.
Maziyar Baran Pouyan, the School of Electrical and Computer Engineering, Georgia Institute of Technology.
Daniel C. Whittingslow, Wallace H. Coulter Department of Bio-medical Engineering, Georgia Institute of Technology, and Emory University School of Medicine
Venu Ganti, School of Electrical and Computer Engineering, Georgia Institute of Technology.
Omer T. Inan, School of Electrical and Computer Engineering and, as an adjunct, the Wallace H. Coulter Department of Biomedical Engineering, Georgia Institute of Technology, Atlanta, GA 30308 USA.
References
- 1.Braun HJ, Gold GE. Diagnosis of osteoarthritis: imaging. Bone. 2012 Aug;51(2):278–88. doi: 10.1016/j.bone.2011.11.019. [DOI] [PMC free article] [PubMed] [Google Scholar]
- 2.Reinschmidt C, van den Bogert AJ, Nigg BM, Lundberg A, Murphy N. Effect of skin movement on the analysis of skeletal knee joint motion during running. J Biomech. 1997 Jul;30(7):729–32. doi: 10.1016/s0021-9290(97)00001-8. [DOI] [PubMed] [Google Scholar]
- 3.el-Khoury GY, Kathol MH, Daniel WW. Imaging of acute injuries of the cervical spine: value of plain radiography, CT, and MR imaging. AJR Am J Roentgenol. 1995 Jan;164(1):43–50. doi: 10.2214/ajr.164.1.7998567. [DOI] [PubMed] [Google Scholar]
- 4.Hersek S, et al. Wearable Vector Electrical Bioimpedance System to Assess Knee Joint Health. IEEE Trans Biomed Eng. 2016 Dec 22; doi: 10.1109/TBME.2016.2641958. [DOI] [PMC free article] [PubMed] [Google Scholar]
- 5.Teague CN, et al. Novel Methods for Sensing Acoustical Emissions From the Knee for Wearable Joint Health Assessment. IEEE Trans Biomed Eng. 2016 Aug;63(8):1581–90. doi: 10.1109/TBME.2016.2543226. [DOI] [PubMed] [Google Scholar]
- 6.Toreyin H, Jeong HK, Hersek S, Teague CN, Inan OT. Quantifying the Consistency of Wearable Knee Acoustical Emission Measurements During Complex Motions. IEEE J Biomed Health Inform. 2016 Sep;20(5):1265–72. doi: 10.1109/JBHI.2016.2579610. [DOI] [PubMed] [Google Scholar]
- 7.Kim HJ, Fernandez JW, Akbarshahi M, Walter JP, Fregly BJ, Pandy MG. Evaluation of predicted knee-joint muscle forces during gait using an instrumented knee implant. J Orthop Res. 2009 Oct;27(10):1326–31. doi: 10.1002/jor.20876. [DOI] [PubMed] [Google Scholar]
- 8.D’Lima DD, Fregly BJ, Patil S, Steklov N, Colwell CW., Jr Knee joint forces: prediction, measurement, and significance. Proc Inst Mech Eng H. 2012 Feb;226(2):95–102. doi: 10.1177/0954411911433372. [DOI] [PMC free article] [PubMed] [Google Scholar]
- 9.Cook DJ, Holder LB. Graph-based data mining. Ieee Intelligent Systems & Their Applications. 2000 Mar-Apr;15(2):32-+. (in English) [Google Scholar]
- 10.Giannakopoulos T, Pikrakis A. Introduction to audio analysis: a MATLAB approach. First. Kidlington, Oxford: Academic Press is an imprint of Elsevier; 2014. p. xvi.p. 266. [Google Scholar]
- 11.Vergin R, O’Shaughnessy D, Farhat A. Generalized mel frequency cepstral coefficients for large-vocabulary speaker-independent continuous-speech recognition. Ieee Transactions on Speech and Audio Processing. 1999 Sep;7(5):525–532. (in English) [Google Scholar]
- 12.Burred JJ, Lerch A. A hierarchical approach to automatic musical genre classification. Dafx-03: 6th International Conference on Digital Audio Effects, Proceedings. 2003:308–311. (in English) [Google Scholar]
- 13.Hua J, Xiong Z, Lowey J, Suh E, Dougherty ER. Optimal number of features as a function of sample size for various classification rules. Bioinformatics. 2005 Apr 15;21(8):1509–15. doi: 10.1093/bioinformatics/bti171. [DOI] [PubMed] [Google Scholar]
- 14.Hastie T, Tibshirani R, Friedman JH SpringerLink (Online service) The elements of statistical learning data mining, inference, and prediction. 2. New York, NY: Springer-Verlag New York; 2009. p. xxii.p. 745. [Google Scholar]
- 15.. Available: http://link.springer.com/book/10.1007/978-0-387-84858-7.
- 16.Maaten LJPvd, Hinton GE. Visualizing High-Dimensional Data Using t-SNE. Journal of Machine Learning Research. 2008 Nov;9:2579–2605. [Google Scholar]
- 17.Thomson A, Einarsson E, Witvrouw E, Whiteley R. Running speed increases plantar load more than per cent body weight on an AlterG (R) treadmill. Journal of Sports Sciences. 2017 Feb;35(3):277–282. doi: 10.1080/02640414.2016.1163401. (in English) [DOI] [PubMed] [Google Scholar]
- 18.Xu DJ, Shen C, Shen F. A Robust Particle Filtering Algorithm With Non-Gaussian Measurement Noise Using Student-t Distribution. Ieee Signal Processing Letters. 2014 Jan;21(1):30–34. (in English) [Google Scholar]
- 19.Levine JH, et al. Data-Driven Phenotypic Dissection of AML Reveals Progenitor-like Cells that Correlate with Prognosis. Cell. 2015 Jul 02;162(1):184–97. doi: 10.1016/j.cell.2015.05.047. [DOI] [PMC free article] [PubMed] [Google Scholar]
- 20.Pouyan M, Nourani M. Clustering Single-Cell Expression Data Using Random Forest Graphs. IEEE J Biomed Health Inform. 2016 May 10; doi: 10.1109/JBHI.2016.2565561. [DOI] [PubMed] [Google Scholar]
- 21.Felzenszwalb PF, Huttenlocher DP. Efficient graph-based image segmentation. International Journal of Computer Vision. 2004 Sep;59(2):167–181. (in English) [Google Scholar]
- 22.Kosman E, Leonard KJ. Similarity coefficients for molecular markers in studies of genetic relationships between individuals for haploid, diploid, and polyploid species. Mol Ecol. 2005 Feb;14(2):415–24. doi: 10.1111/j.1365-294X.2005.02416.x. [DOI] [PubMed] [Google Scholar]
- 23.Malliaros FD, Vazirgiannis M. Clustering and community detection in directed networks: A survey. Physics Reports-Review Section of Physics Letters. 2013 Dec 30;533(4):95–142. (in English) [Google Scholar]
- 24.Lancichinetti A, Fortunato S. Benchmarks for testing community detection algorithms on directed and weighted graphs with overlapping communities. Phys Rev E Stat Nonlin Soft Matter Phys. 2009 Jul;80(1 Pt 2):016118. doi: 10.1103/PhysRevE.80.016118. [DOI] [PubMed] [Google Scholar]
- 25.Rosvall M, Bergstrom CT. Maps of random walks on complex networks reveal community structure. Proc Natl Acad Sci U S A. 2008 Jan 29;105(4):1118–23. doi: 10.1073/pnas.0706851105. [DOI] [PMC free article] [PubMed] [Google Scholar]
- 26.Cahan P, Li H, Morris SA, Lummertz da Rocha E, Daley GQ, Collins JJ. CellNet: network biology applied to stem cell engineering. Cell. 2014 Aug 14;158(4):903–15. doi: 10.1016/j.cell.2014.07.020. [DOI] [PMC free article] [PubMed] [Google Scholar]
- 27.Newman ME, Girvan M. Finding and evaluating community structure in networks. Phys Rev E Stat Nonlin Soft Matter Phys. 2004 Feb;69(2 Pt 2):026113. doi: 10.1103/PhysRevE.69.026113. [DOI] [PubMed] [Google Scholar]
- 28.Gallager RG. Variations on a Theme by Huffman. Ieee Transactions on Information Theory. 1978;24(6):668–674. (in English) [Google Scholar]
- 29.Kriegel HP, Kroger P, Sander J, Zimek A. Density-based clustering. Wiley Interdisciplinary Reviews-Data Mining and Knowledge Discovery. 2011 May-Jun;1(3):231–240. (in English) [Google Scholar]
- 30.Mousseau TA, Roff DA. Natural selection and the heritability of fitness components. Heredity (Edinb) 1987 Oct;59(Pt 2):181–97. doi: 10.1038/hdy.1987.113. [DOI] [PubMed] [Google Scholar]


