

Abstract
Background
Task-oriented therapies have been developed to address significant upper extremity disability that persists after stroke. Yet, the extent of and approach to rehabilitation and recovery remains unsatisfactory to many.
Objective
To compare a skill-directed investigational intervention with usual care treatment for body functions and structures, activities, participation, and quality of life outcomes.
Methods
On average, 46 days post stroke, 361 patients were randomized to one of three outpatient therapy groups: a patient-centered Accelerated Skill Acquisition Program (ASAP), dose-equivalent usual occupational therapy (DEUCC), or usual therapy (UCC). Outcomes were taken at baseline, post-treatment, 6 months, and 1 year after randomization. Longitudinal mixed effect models compared group differences in post-stroke improvement during treatment and follow-up phases.
Results
Across all groups, most improvement occurred during the treatment phase, followed by change more slowly during follow-up. Compared to DEUCC and UCC, ASAP group gains were greater during treatment for Stroke Impact Scale Hand, Strength, Mobility, Physical Function, and Participation scores, self-efficacy, perceived health, reintegration, patient-centeredness, and quality of life outcomes. ASAP participants reported higher Motor Activity Log-28 Quality of Movement than UCC post-treatment and perceived greater study-related improvements in quality of life. By end of study, all groups reached similar levels with only limited group differences.
Conclusions
Customized task-oriented training can be implemented to accelerate gains across a full spectrum of patient-reported outcomes. While group differences for most outcomes disappeared at 1 year, ASAP participants achieved these outcomes on average 8 months earlier.
Keywords: rehabilitation, task-oriented, patient-centered, quality of life, ICF
Introduction
The consequences of stroke are complex, multifaceted, and uniquely personal. Residual disability related to the affected arm and hand is common and often substantial after stroke and formal rehabilitation.1 The Interdisciplinary Comprehensive Arm Rehabilitation Evaluation (ICARE) stroke initiative was a pragmatic phase 3 randomized controlled trial (RCT) that compared the effectiveness of an investigational intervention (Accelerated Skill Acquisition Program, ASAP) for paretic arm recovery in the outpatient setting post-stroke with dose-matched usual and customary occupational therapy (DEUCC) and usual doses of such care (UCC).2 The primary outcome, motor performance of the affected upper extremity as measured by the laboratory-based timed assessment of performance, the Wolf Motor Function Test3 at 1 year, improved substantially, but not differently, in the three groups. Here, we report the results of planned analyses focused on group comparisons of secondary outcomes beyond motor performance. These outcomes span a continuum from isolated upper extremity impairment (body function and structure) mitigation to contextualized or integrated recovery from stroke captured by the activity and participation levels of the International Classification of Disability and Functioning (ICF)25 as well as quality of life. Implicit in the ICF characterization is the recognition that resolution of impairments may not be sufficient to produce full recovery of functional performance capabilities or reintegration into life roles. Consideration of a full range of outcomes can provide patients, clinicians, and policy makers with important insights for decisions pertaining to stroke rehabilitation and aftercare.4
Task-oriented training for rehabilitation emanates substantially from pre-clinical animal-model research.5–7 That research demonstrates neuroplastic change and more effective behavioral recovery from progressive and intensive task practice.8, 9 A number of challenges to human translation exist.5 Further, animal research cannot account for some critical elements known to be important for human skill acquisition and behavior change.10, 11 Among the elements missing from the translation are contributions of human expectations and self-determination to recovery-relevant behavior beyond the structure of the clinic.
The investigational Accelerated Skill Acquisition Program was developed to capitalize on first-generation human clinical applications that utilized animal-model work7, 12, 13 and known human motor learning, cognitive, and social-cognitive influences on skill and behavior. These determinants include self-efficacy and self-determination.11, 14–18 For ASAP, participant-selected practiced tasks were seen as the vehicles or context for the acquisition of skilled movements, a method to promote capacity and confidence, and as a means to foster meaningful task engagement in the natural environment. Task practice, therefore, favored high-quality (i.e., coordinated and efficient), challenging and progressive, skill-directed, movement rather than high volumes of repetitions per se. This aim stands in important yet subtle contrast to the promotion of immediate functional use per se or the reversal of learned-non-use for activities of daily living and self-care.19
Beyond these scientific origins, those who have experienced stroke care have been consistent in their perspective that a greater emphasis on rehabilitation customization and patient-centeredness is desired.20–24 We reasoned that an effective integration of task-oriented training research and the human psychological evidence would include elements of skill acquisition (including challenging practice), capacity building (e.g., impairment mitigation), and intrinsic motivational enhancement (patient empowerment) known to be important for skill and behavior change.10 The aims of these analyses are to examine the trajectory of change for treatment and follow-up phases across outcomes that span the levels of the International Classification of Disability and Functioning (ICF).25
Methods
Overview
The ICARE trial was conducted in the outpatient setting of seven sites with eligible individuals who were enrolled and randomized during a dynamic window of recovery, between 14 and 106 days after stroke. Details of the trial design, inclusion criteria, and measurement have been reported previously.26 All research procedures were approved by institutional review boards at each site (coordinating site: University of Southern California Health Sciences Campus Institutional Review Board, protocol #HS-07-00148). We highlight here key features of ICARE that are most relevant to the secondary outcome analyses and were not featured in the primary outcome paper.2 The content of usual therapy comparison groups was determined by the treating clinicians, outpatient occupational therapists who worked within the academic medical systems and affiliated clinics associated with this trial, and was based upon usual and customary practices, payer guidelines, and participant preferences. The investigational treatment arm was a fully defined, evidence-based, and theoretically informed intervention, Accelerated Skill Acquisition Program, that integrates contemporary principles of motor learning and other key elements noted above.10
Participants
Our inclusion criteria enabled recruitment of a cohort with mild to moderate upper-extremity motor impairment and primarily motor stroke. A stratified block randomization scheme was used within each recruitment site to balance assignment by motor severity (using the Fugl-Meyer Assessment of Upper Extremity motor score27, more impaired ≤ 35, less impaired ≥ 36, eligible range 19-58) and time from stroke onset (early ≤ 59 days and late 60+ days, eligible range 14-106). The final study cohort included 361 individuals, with a mean age of 61 years of whom 56% were male, and 42% of African-American ethnicity. They were randomized on average 46 days after stroke, had a mean National Institutes of Health Stroke Scale (NIHSS) score of 3.6 out of 42 (mild stroke) and a mean upper extremity Fugl-Meyer Assessment score of 42 out of 66 (moderate arm and hand impairment). Further demographic details of this sample, as well as participant flow through the protocol, are provided elsewhere.2
Interventions
An overview of the ASAP intervention has been described previously.10, 26, 28 A description of key components and intervention elements is provided in Table 1. The ASAP intervention was delivered by physical or occupational therapists trained and standardized in its administration. There was an orientation and evaluation session and 30 1-hour treatment sessions across 16 weeks.10, 26 DEUCC participants received an equivalent 30-hour dose of usual care outpatient occupational therapy. UCC participants received an average of 11.2 total hours (range 0-46 hours) of outpatient occupational therapy delivered over a 16-week monitoring period.
Table 1.
Accelerated Skill Acquisition Program Components and Exemplar Elements
| Component | Exemplar Intervention Element |
|---|---|
| Capacity Building | Skillful goal-directed movement (coordination, speed, accuracy) was emphasized.P |
| A “challenge threshold” was identified daily for each task and activities proceeded from that point.MS | |
| Task practice was progressed with physiological overload principles (frequency, duration, intensity).P | |
| Tasks were deconstructed as needed to intensely address specific impairments (e.g., finger weakness)P | |
| Skill Acquisition | |
| Movement Skills | Patients and therapists collaboratively selected or added meaningful tasks each session from strength, dexterity, and bimanual categories.MS |
| Tasks were kept as whole tasks when feasible, or deconstructed and reconstructed as needed.P | |
| Self-Direction Skills | Patients were often given “first opportunity” to identify barriers or propose solutions; therapists provided expertise as needed. |
| Action Plans encouraged extensions/explorations of activities outside of therapy visits.MS Sessions began with debriefing of Action Plan efforts.MS | |
| Patients were encouraged to take charge of treatment sessions with tasks and challenge creation. Emphasis increased with individual patient readiness. | |
| Motivation Enhancement | |
| Confidence (Self-Efficacy) Building | Brief self-efficacy assessments periodically marked progress on a constant “priority task.”MS |
| Therapists encouraged goal setting, feedback, and challenge in measureable numerical forms (e.g., speed, repetitions, weight). | |
| Celebration of intense effort, insights, and challenges overcome was encouraged. | |
| Autonomy Support | In the first session, therapist and patient discussed and agreed to collaborate with mutual active participation throughout.MS |
| Each session, patients selected/added several tasks across strength, dexterity, and bimanual categories, and determined their practice order.MS | |
| Throughout each session, patients were encouraged to identify skill and impairment barriers to progress and to suggest possible solutions. | |
Principle of the Accelerated Skill Acquisition Program (ASAP) around which training was strongly encouraged.
A planned microstructure of ASAP inserted within or across sessions to facilitate frequent and effective use of relevant principles.
Secondary Outcome Measures
Overall, measures include those requiring direct performance (e.g., Fugl-Meyer Assessment of Upper Extremity motor ability) and survey by patient report (e.g., Stroke Impact Scale29) that were acquired by trained evaluators blinded to intervention designation. Additionally, measures eliciting patient perspectives on interventions were administered in exit interviews.30–32
The Stroke Impact Scale (SIS) 3.0 is a valid and reliable interviewer-administered assessment of health-related quality of life for individuals after stroke that captures eight domains of body function and structure, activity, and participation organized into subscales (Strength, Mood and Emotions, Hand function, Mobility, Activities of Daily Living/Instrumental Activities of Daily Living, Communication, Memory and Thinking, and Participation) and an overall measure of perceived recovery from stroke. The SIS- 16 is a brief assessment of physical function derived from the full SIS focused on core physical functions, including activities of daily living and mobility. In addition, we describe outcomes of additional constructs, including measures of motor impairment, self-efficacy for arm and hand movement, depressive symptoms, perceived health, motor activity quality in the natural environment, reintegration and role participation, and overall life satisfaction or subjective well-being. With the exception of self-reported quality of movement for motor activity (MAL-28 QOM33), which was not assessed at baseline to limit participant burden, measures were collected at baseline, immediately following the end of treatment (approximately 5.5 months post stroke), 6-months post-randomization follow-up, and the end of the study (approximately 13.5 months post stroke). Measures are presented according to our determination of their ICF levels in figures and Table 2.
Table 2.
Longitudinal Mixed Effect Model Results: Group Means (95% Confidence Intervals), Group, Time, Trajectory, and Group × Time Differences
| ASAP (N=119) | DEUCC (N=120) | UCC (N=122) | P values | ||||||||
|---|---|---|---|---|---|---|---|---|---|---|---|
| Group | Time | Slope Dif | G × T | Post-hoc | |||||||
| Body Structure/Function | |||||||||||
| FMA-UE MCID: 5.25 | |||||||||||
| Baseline | 119 | 41.7(40.0,43.4) | 120 | 41.5(39.9,43.2) | 122 | 41.6(39.9,43.3) | |||||
| End-of-Treatment | 103 | 50.5(48.5,52.6) | 99 | 49.3(47.2,51.5) | 94 | 50.0(48.0,52.0) | .269 | ||||
| End-of-Study | 103 | 51.6(49.2,54.0) | 105 | 53.4(51.6,55.2) | 93 | 53.7(51.5,55.9) | .456 | ||||
| Improvement Trajectories | |||||||||||
| Treatment | 103 | 9.3(7.6,11.0) | 99 | 8.3(6.9,9.6) | 94 | 7.9(6.3,9.5) | < .001 | < .001 | .336 | ||
| Follow-up | 99 | 1.0(−0.7,2.7) | 95 | 3.9(2.5,5.3) | 85 | 3.6(2.2,5.0) | < .001 | .047 | A < D* A < U* | ||
| SIS Strength MCID: 9.2 | |||||||||||
| Baseline | 119 | 54.8(51.6,58.0) | 120 | 54.3(51.2,57.3) | 122 | 55.3(51.9,58.7) | |||||
| End-of-Treatment | 104 | 69.5(66.1,73.0) | 100 | 64.6(60.8,68.3) | 96 | 66.3(62.4,70.3) | .099 | A > D* | |||
| End-of-Study | 105 | 68.8(65.0,72.6) | 107 | 64.4(60.4,68.5) | 101 | 65.5(61.8,69.1) | .040 | A > D* A > U* | |||
| Improvement Trajectories | |||||||||||
| Treatment | 104 | 14.5(10.7,18.2) | 100 | 10.6(6.7,14.5) | 96 | 9.3(5.3,13.3) | < .001 | < .001 | .090 | A > D A > U* | |
| Follow-up | 102 | −0.6(−4.0,2.8) | 96 | −0.2(−3.8,3.5) | 89 | −1.3(−4.3,1.8) | .530 | .913 | |||
| PHQ-9 MCID: −1.1d | |||||||||||
| Baseline | 118 | 3.5(2.8,4.1) | 120 | 3.5(2.8,4.2) | 121 | 4.0(3.3,4.8) | |||||
| End-of-Treatment | 103 | 3.6(2.7,4.4) | 99 | 3.8(3.0,4.6) | 95 | 4.6(3.6,5.6) | .184 | ||||
| End-of-Study | 105 | 3.8(2.8,4.8) | 104 | 3.9(3.0,4.8) | 97 | 3.8(2.9,4.7) | .861 | ||||
| Improvement Trajectories | |||||||||||
| Treatment | 102 | 0.1(−0.8,1.0) | 99 | 0.2(−0.8,1.2) | 94 | 0.7(−0.3,1.6) | .134 | .982 | .335 | ||
| Follow-up | 101 | 0.3(−0.7,1.3) | 94 | 0(−0.8,0.8) | 87 | −0.7(−1.5,0.1) | .771 | .945 | |||
| SIS Mood and Emotion MCID: 4.4d | |||||||||||
| Baseline | 119 | 79.7(77,82.3) | 120 | 79.6(77,82.2) | 122 | 78.8(75.9,81.7) | |||||
| End-of-Treatment | 104 | 84.5(81.7,87.3) | 100 | 83.9(81,86.7) | 95 | 81.2(77.6,84.9) | .165 | A > U | |||
| End-of-Study | 105 | 83.9(80.3,87.5) | 107 | 83.3(80,86.5) | 101 | 82.8(79.6,86.1) | .568 | ||||
| Improvement Trajectories | |||||||||||
| Treatment | 104 | 4.6(2.0,7.2) | 100 | 4.6(1.5,7.6) | 95 | 1.1(−1.8,3.9) | < .001 | .002 | .220 | ||
| Follow-up | 102 | −0.5(−3.5,2.5) | 96 | −0.2(−2.8,2.4) | 88 | 1.9(−1.1,4.9) | .043 | .675 | |||
| Confidence in Arm and Hand Movements MCID: 7.3d | |||||||||||
| Baseline | 118 | 45.3(40.8,49.7) | 120 | 48.4(44.3,52.4) | 122 | 44.4(40.3,48.4) | |||||
| End-of-Treatment | 102 | 76.6(72.3,81.0) | 99 | 68.6(63.7,73.6) | 93 | 62.4(57.0,67.9) | < .001 | A > D* A > U*** | |||
| End-of-Study | 105 | 74.0(69.2,78.8) | 105 | 70.6(65.7,75.4) | 95 | 70.8(66.1,75.4) | .101 | A > U* | |||
| Improvement Trajectories | |||||||||||
| Treatment | 101 | 32.7(28.3,37.0) | 99 | 21.5(17.3,25.8) | 93 | 19.6(15.4,23.9) | < .001 | < .001 | < .001 | A > D*** A > U*** | |
| Follow-up | 100 | −2.4(−5.7,0.9) | 95 | 1.6(−2.1,5.2) | 84 | 7.5(4.3,10.8) | < .001 | .016 | A < D A < U** | ||
| SIS Perception of Recovery MCID: 6d | |||||||||||
| Baseline | 119 | 53.3(49.7,56.9) | 119 | 51.7(47.8,55.6) | 122 | 54.4(51.0,57.8) | |||||
| End-of-Treatment | 104 | 75.2(72.0,78.5) | 100 | 70.2(66.8,73.6) | 95 | 68.6(64.6,72.7) | .059 | A > D A > U* | |||
| End-of-Study | 105 | 79.1(75.6,82.6) | 107 | 76.3(73.0,79.5) | 101 | 76.0(72.5,79.6) | .197 | ||||
| Improvement Trajectories | |||||||||||
| Treatment | 104 | 21.5(18.1,25.0) | 99 | 20.5(16.4,24.5) | 95 | 14.0(9.6,18.3) | < .001 | < .001 | .006 | A > U** | |
| Follow-up | 102 | 3.9(1.6,6.1) | 96 | 5.3(2.2,8.4) | 88 | 7.0(4.6,9.5) | < .001 | .663 | |||
| EQ-5D-VAS MCID: 8.61 | |||||||||||
| Baseline | 119 | 61.8(58.4,65.3) | 119 | 60.2(57.0,63.4) | 122 | 62.1(58.4,65.8) | |||||
| End-of-Treatment | 102 | 77.1(73.6,80.5) | 99 | 71.9(68.6,75.1) | 93 | 70.7(66.8,74.5) | .021 | A > D* A > U** | |||
| End-of-Study | 105 | 76.4(72.4,80.5) | 105 | 75.5(72.3,78.7) | 96 | 78.8(75.3,82.4) | .635 | ||||
| Improvement Trajectories | |||||||||||
| Treatment | 102 | 15.3(11.5,19.0) | 98 | 13.3(9.7,16.9) | 93 | 6.9(3.1,10.6) | < .001 | < .001 | .013 | A > U** | |
| Follow-up | 100 | −0.6(−3.9,2.7) | 95 | 3.2(0.1,6.2) | 84 | 7.2(3.6,10.9) | < .001 | .120 | A < U | ||
| Activity | |||||||||||
| SIS Hand MC:ID: 17.8 | |||||||||||
| Baseline | 119 | 31.1(26.6,35.7) | 120 | 32.8(28.7,36.9) | 122 | 28.2(24.2,32.3) | |||||
| End-of-Treatment | 104 | 70.3(65.2,75.5) | 100 | 65.3(60.3,70.2) | 95 | 62.2(56.6,67.8) | .020 | A > D** A > U** | |||
| End-of-Study | 105 | 68.2(62.7,73.7) | 107 | 68.7(63.9,73.6) | 101 | 66.4(61.1,71.7) | .361 | ||||
| Improvement Trajectories | |||||||||||
| Treatment | 104 | 39.9(35.1,44.7) | 100 | 33.1(28.2,38.0) | 95 | 34.0(29.0,39.0) | < .001 | < .001 | .144 | A > D* A > U | |
| Follow-up | 102 | −1.9(−5.7,1.9) | 96 | 4.1(0.2,8.1) | 88 | 3.8(0.6,7.0) | .019 | .004 | A < D** A < U | ||
| SIS Mobility MCID: 4.5 | |||||||||||
| Baseline | 119 | 66.8(62.7,70.9) | 120 | 63.7(60.1,67.3) | 122 | 63.7(59.7,67.7) | |||||
| End-of-Treatment | 104 | 83.2(79.6,86.7) | 100 | 78.2(74.6,81.8) | 95 | 78.2(74.3,82.1) | .014 | A > D* A > U* | |||
| End-of-Study | 105 | 77.9(73.8,81.9) | 107 | 76.8(72.9,80.7) | 101 | 80.1(76.5,83.6) | .454 | ||||
| Improvement Trajectories | |||||||||||
| Treatment | 104 | 16.3(12.1,20.4) | 100 | 13.4(9.6,17.3) | 95 | 11.3(7.1,15.5) | < .001 | < .001 | .647 | ||
| Follow-up | 102 | −4.7(−7.6, −1.7) | 96 | −1.4(−4.0,1.3) | 88 | 0.9(−1.9,3.7) | .741 | .024 | A < D* A < U* | ||
| SIS ADL/IADL MCID: 5.9 | |||||||||||
| Baseline | 119 | 59.5(56.2,62.8) | 120 | 59.0(56.1,61.8) | 122 | 57.2(53.8,60.6) | |||||
| End-of-Treatment | 104 | 83.5(80.5,86.4) | 100 | 79.7(76.2,83.2) | 95 | 77.9(74.1,81.7) | .230 | A > D A > U** | |||
| End-of-Study | 105 | 82.1(78.7,85.6) | 107 | 80.9(77.7,84.2) | 101 | 81.4(78.2,84.6) | .433 | ||||
| Improvement Trajectories | |||||||||||
| Treatment | 104 | 24.1(20.6,27.6) | 100 | 20.4(16.7,24.1) | 95 | 20.1(16.7,23.6) | < .001 | < .001 | .310 | ||
| Follow-up | 102 | −1.0(−3.7,1.7) | 96 | 1.5(−1.1,4.0) | 88 | 2.1(−0.2,4.4) | .123 | .162 | |||
| SIS-16 MCID: 9.4 | |||||||||||
| Baseline | 119 | 66.0(62.6,69.3) | 120 | 64.6(61.9,67.4) | 122 | 63.7(60.4,66.9) | |||||
| End-of-Treatment | 104 | 85.0(82.1,87.8) | 100 | 80.6(77.5,83.7) | 95 | 80.1(76.6,83.7) | .013 | A > D* A > U** | |||
| End-of-Study | 105 | 81.9(78.4,85.3) | 107 | 80.8(77.6,84.0) | 101 | 82.1(79.0,85.1) | .448 | ||||
| Improvement Trajectories | |||||||||||
| Treatment | 104 | 19.0(15.6,22.4) | 100 | 15.3(12.1,18.5) | 95 | 14.4(11.1,17.8) | < .001 | < .001 | .332 | ||
| Follow-up | 102 | −2.7(−5.2, −0.2) | 96 | 0.4(−1.8,2.6) | 88 | 0.8(−1.4,3.0) | .636 | 0.043 | A < D* A < U* | ||
| SIS Communication MCID: 5.4d | |||||||||||
| Baseline | 119 | 85.0(81.3,88.6) | 120 | 86.8(83.8,89.9) | 122 | 86.0(82.9,89.0) | |||||
| End-of-Treatment | 104 | 90.0(87.2,92.9) | 100 | 89.4(86.6,92.3) | 95 | 87.4(83.8,91.1) | .403 | ||||
| End-of-Study | 105 | 91.8(89.3,94.3) | 107 | 90.0(87.1,92.9) | 101 | 90.3(87.6,93.0) | .408 | ||||
| Improvement Trajectories | |||||||||||
| Treatment | 104 | 5.1(2.6,7.7) | 100 | 2.9(−0.1,6) | 95 | 1(−1.7,3.8) | < .001 | .004 | .166 | ||
| Follow-up | 102 | 1.3(−0.8,3.5) | 96 | 0.9(−1.3,3) | 88 | 1.9(0,3.9) | .220 | .411 | |||
| SIS Memory and Thinking MCID: 5.7d | |||||||||||
| Baseline | 119 | 81.7(78.3,85.1) | 120 | 81.7(78.5,84.9) | 122 | 80.1(76.5,83.7) | |||||
| End-of-Treatment | 104 | 88.6(85.9,91.3) | 100 | 85.6(82.4,88.9) | 95 | 84.6(81.0,88.2) | .064 | A > D A > U* | |||
| End-of-Study | 105 | 86.5(83.4,89.7) | 107 | 85.6(82.7,88.6) | 101 | 85.6(82.3,88.8) | .447 | ||||
| Improvement Trajectories | |||||||||||
| Treatment | 104 | 7.1(4.4,9.9) | 100 | 4.1(0.5,7.7) | 95 | 3.5(0,7.1) | < .001 | < .001 | .260 | ||
| Follow-up | 102 | −2.1(−4.7,0.5) | 96 | 0.8(−1.5,3.2) | 88 | 0.4(−2.2,2.9) | .979 | .033 | A < D** | ||
| MAL-28-QOM | |||||||||||
| End-of-Treatment | 103 | 3.6(3.4,3.8) | 99 | 3.4(3.2,3.6) | 93 | 3.1(2.8,3.4) | .006 | A > U** | |||
| End-of-Study | 103 | 3.6(3.3,3.8) | 102 | 3.5(3.3,3.7) | 95 | 3.3(3,3.6) | .188 | ||||
| Improvement Trajectory | |||||||||||
| Follow-up | 99 | 0(−0.2,0.1) | 93 | 0.1(−0.1,0.3) | 85 | 0.2(0.1,0.4) | .199 | .298 | |||
| Participation and Quality of Life | |||||||||||
| Reintegration to Normal Living Index MCID: 5.8d | |||||||||||
| Baseline | 118 | 68.6(65.3,71.8) | 120 | 68.0(65.0,71.0) | 122 | 65.9(62.6,69.2) | |||||
| End-of-Treatment | 102 | 86.3(82.9,89.6) | 99 | 80.5(76.7,84.2) | 93 | 79.5(75.5,83.4) | .004 | A > D* A > U** | |||
| End-of-Study | 105 | 84.6(81.1,88.2) | 105 | 81.9(78.4,85.4) | 96 | 82.9(79.1,86.7) | .241 | ||||
| Improvement Trajectories | |||||||||||
| Treatment | 101 | 17.5(14.3,20.7) | 99 | 13.6(9.8,17.4) | 93 | 12.4(8.6,16.2) | < .001 | < .001 | .066 | A > D* A > U* | |
| Follow-up | 100 | −1.4(−4.1,1.3) | 95 | 1.9(−1.5,5.3) | 84 | 3.5(0.7,6.3) | < .001 | .036 | A < U* | ||
| SIS Participation MCID: 6.9d | |||||||||||
| Baseline | 119 | 44.5(40.9,48.1) | 120 | 42.2(38.1,46.3) | 122 | 40.9(37.2,44.5) | |||||
| End-of-Treatment | 104 | 73.3(68.7,77.9) | 100 | 67.6(63.7,71.5) | 95 | 66.4(61.4,71.4) | .011 | A > D* A > U** | |||
| End-of-Study | 105 | 74.4(69.8,79.1) | 107 | 72.7(68.4,77.1) | 101 | 71.8(67.5,76.1) | .322 | ||||
| Improvement Trajectories | |||||||||||
| Treatment | 104 | 29.3(24.9,33.8) | 100 | 26.1(21.4,30.8) | 95 | 24.1(18.9,29.3) | < .001 | < .001 | .326 | ||
| Follow-up | 102 | 1.1(−2.8,5.0) | 96 | 6.7(3.7,9.8) | 88 | 5.6(2.2,9.1) | < .001 | .038 | A < D* | ||
| ICARE Improve quality of life | |||||||||||
| End-of-Treatment | 100 | 6.6(6.5,6.8) | 92 | 6.2(6,6.5) | 90 | 5.7(5.4,6) | < .001 | A > D* A >U*** D > U | |||
| End-of-Study | 99 | 6.6(6.3,6.8) | 94 | 6.2(5.9,6.5) | 89 | 5.9(5.5,6.2) | .002 | A > D* A >U*** | |||
| Improvement Trajectory | |||||||||||
| Follow-up | 93 | −0.1(−0.2,0.1) | 77 | −0.2(−0.4,0.1) | 79 | 0(−0.4,0.4) | .711 | .623 | |||
| Ability to return to work or hobbies | |||||||||||
| End-of-Treatment | 99 | 5.7(5.4,6.0) | 91 | 4.8(4.4,5.2) | 88 | 4.4(4.0,4.8) | .001 | A > D** A >U*** | |||
| End-of-Study | 100 | 5.3(4.9,5.7) | 95 | 4.7(4.2,5.1) | 89 | 4.6(4.1,5.1) | .057 | A > D* A > U* | |||
| Improvement Trajectory | |||||||||||
| Follow-up | 92 | −0.4(−0.8,0) | 77 | −0.2(−0.7,0.3) | 77 | 0.1(−0.3,0.6) | .218 | .119 | A < U* | ||
| Ability to do important and meaningful activities everyday | |||||||||||
| End-of-Treatment | 100 | 6.1(5.9,6.4) | 91 | 5.5(5.2,5.8) | 90 | 5.4(5.1,5.8) | < .001 | A > D** A > U** | |||
| End-of-Study | 100 | 5.9(5.6,6.2) | 94 | 5.6(5.3,5.9) | 89 | 5.4(5.0,5.8) | .138 | A > U* | |||
| Improvement Trajectory | |||||||||||
| Follow-up | 93 | −0.3(−0.6,0) | 76 | 0(−0.3,0.3) | 79 | −0.1(−0.5,0.3) | .286 | .294 | |||
| Satisfaction with Living Scale MCID: 2.2d | |||||||||||
| Baseline | 119 | 21.1(19.7,22.5) | 120 | 21.8(20.5,23.1) | 122 | 20.0(18.5,21.4) | |||||
| End-of-Treatment | 102 | 22.9(21.3,24.4) | 98 | 22.8(21.4,24.3) | 93 | 21.9(20.2,23.6) | .178 | ||||
| End-of-Study | 105 | 24.0(22.5,25.5) | 105 | 22.4(20.9,23.8) | 96 | 22.1(20.4,23.8) | .253 | ||||
| Improvement Trajectories | |||||||||||
| Treatment | 102 | 1.8(0.4,3.2) | 98 | 1.2(−0.3,2.7) | 93 | 1.8(0.3,3.2) | < .001 | .647 | .052 | A > D* | |
| Follow-up | 100 | 1.2(−0.1,2.5) | 94 | −0.6(−1.8,0.6) | 84 | 0.8(−0.6,2.1) | .026 | .098 | A > D* | ||
Note. Means and 95% confidence intervals are from raw, unadjusted data. Modeling was performed using imputed data and adjusted for randomization strata (site, stroke severity, and time since stroke). For each outcome, Group P values refer to omnibus group differences at End-of-Treatment or End-of-Study. Improvement Trajectories refer to linear trends occurring during the Treatment window (Baseline to End-of-Treatment) or the Follow-up window (End-of-Treatment to End-of-Study). The slopes of the lines in Figures 1–3 (and Supplemental Figures S1–S3) correspond to the statistics provided in the “Improvement Trajectories” rows of this Table. Time P values refer to whether there were linear trends (slope ≠ 0) that occurred during the treatment or follow-up time period. “Slope Dif” refers to whether there was a difference in trends between the two periods. The columns, “G × T” (Group × Time) and “Post-hoc,” address differences in improvement trajectories associated with group. They indicate whether there were significant interactions of treatment and follow-up time segments by group, and the direction of such differences, respectively. Group × Time effect refers to whether there was a difference in these trends across groups, and the post-hoc column indicates which groups differed in the trends.
P < .05,
P < .01,
P < .001. Differences without asterisks denote trends, P < .10. A (Accelerated Skill Acquisition Program, ASAP), D (Dose-Equivalent Usual and Customary Care; DEUCC), U (Usual and Customary Care, UCC). FMA-UE (Fugl-Meyer Assessment-Upper Extremity Motor score), SIS (Stroke Impact Scale), PHQ-9 (Patient Health Questionnaire-9), EQ-5D-VAS (EuroQol 5-Dimension Visual Analog Scale), MAL-28-QOM (Motor Activity Log-28 Quality of Movement). MCID refers to the minimal clinically important difference. MCID numbers are taken from patient-anchored values in the published literature where available or based upon the ICARE baseline distribution (10% of the middle 90% of the score distribution) (see Supplemental Materials). Values denoted with a “d” are distribution-based. MCID values are not reported or derived for measures without baseline scores.
Additional secondary outcome measures were taken from two custom exit interviews administered at the end of treatment and the end of the study. The interviews consisted of the short form of the standardized Health Care Climate Questionnaire (HCCQ34) introduced after the study began and administered to only one-third of the sample at end of treatment only. Upon completion of the relevant study phase, structured surveys were administered by non-treating, non-blinded, site team staff. At the End-of-Treatment interview, each participant was asked a set of questions to assess the extent of intervention fidelity as well as perceptions of experiences and outcomes of their intervention.26 At the 1-year visit, participants completed the End-of-Study Interview and another set of questions regarding activity since the end of the treatment phase. A set of questions from the End-of-Treatment Interview was repeated at study completion to address participant perceptions of the value of the intervention and study participation.
Statistical Analysis
Longitudinal mixed effects (LME) models were utilized to allow modeling of two different periods of change with the trajectory observed: (1) the treatment phase (baseline to post-intervention at 16 weeks) and (2) the follow-up phase (post-intervention to final evaluation at 12 months). A two-segment dummy coded time variable was created, using months as the time variable so that beta coefficients could be interpreted as rate of change per month and be directly compared between phases. For measures that were assessed only from post-intervention forward (e.g., MAL-28 QOM and exit interview items), linear models were used. A heterogeneous first-order autoregressive covariance structure was used, allowing for correlated observations within participants and independence across participants. Intention-to-treat group effects were examined using an omnibus test of group with ASAP as reference group, followed by Bonferroni post-hoc testing to determine the group differences, with adjustment for a priori covariates (severity at onset, time since stroke, and site). Multiple imputation was used for missing data, as in the primary outcome paper. Analyses were performed with SPSS (v.21); α= 0.05. The results of this analysis are presented in Table 2 and illustrated in Figures 1–3 (and Supplemental Materials Figures S1–S3). Patient-anchor based minimal clinically important difference (MCID) values from the published literature or from the baseline distribution of our sample are noted in Table 2 to aid interpretation of statistically significant findings. Further information regarding the sources of these MCID values as well as proportions of participants in each group who exceeded these thresholds is presented in the Supplemental Materials to this paper.
Figure 1. Body Structure and Function.
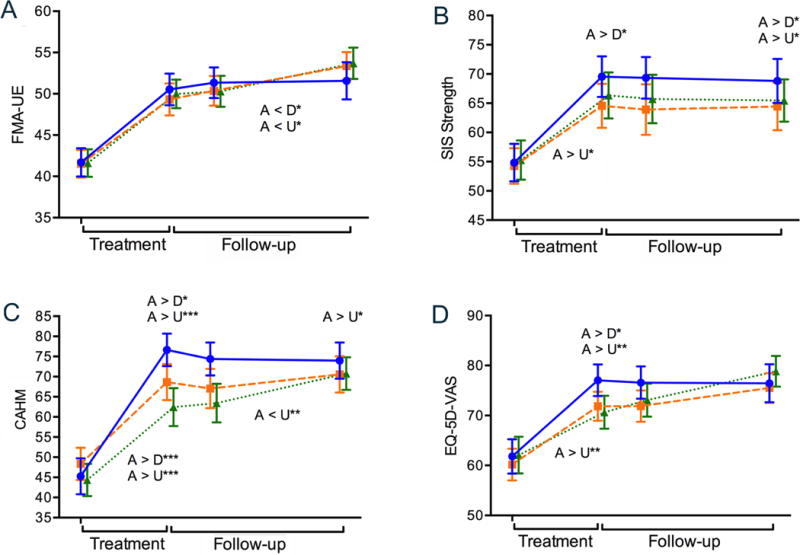
Illustrates changes in Body Structure and Function over time. On the horizontal axis, the left side in each figure (Treatment) indicates changes (improvements) from baseline assessment to the end-of-treatment time point while the right side (Follow-up) reflects end-of-treatment to end-of-study change. The slopes of the lines correspond to the statistics provided in the “Improvement Trajectories” rows of Table 2. Longitudinal plots across the two phases of recovery for (A) the Fugl-Meyer Assessment of Upper Extremity motor ability, FMA-UE, (B) Stroke Impact Scale (SIS) Strength subscale, (C) Confidence in Arm and Hand Movement, CAHM, and (D) the Euroqol-5D Visual Analog Scale, EQ-5D-VAS. Solid blue line (Accelerated Skill Acquisition Program, A), dashed orange line (Dose-equivalent Usual and Customary Care, D), dotted green line (monitoring-only Usual and Customary Care, U). Means and standard error of the means are represented. Group differences at time points are denoted above the data lines; group × time trajectory differences are found below the data lines. * P < .05, ** P < .01, *** P < .001.
Figure 3. Participation and Quality of Life.
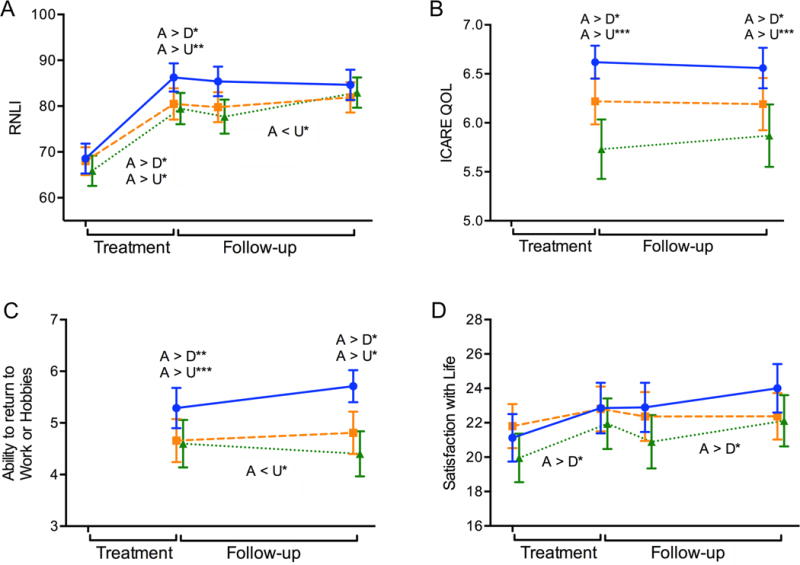
Illustrates changes in Participation and Quality of Life over time. On the horizontal axis, the left side in each figure (Treatment) indicates changes (improvements) from baseline assessment to the end-of-treatment time point while the right side (Follow-up) reflects end-of-treatment to end-of-study change. The slopes of the lines correspond to the statistics provided in the “Improvement Trajectories” rows of Table 2. Longitudinal plots across the two phases of (A) Reintegration to Normal Living Index, RNLI, (B) Quality of life improvements attributed to ICARE study participation, ICARE QOL, (C) Ability to return to work or hobbies, (D) Satisfaction with Life Scale. Solid blue line (Accelerated Skill Acquisition Program, ASAP), dashed orange line (Dose-equivalent Usual and Customary Care, DEUCC), dotted green line (monitoring-only Usual and Customary Care, UCC). Means and standard error of the means are represented. Group differences at time points are denoted above the data lines; group × time trajectory differences are found below the data lines. * P < .05, ** P < .01, *** P < .001.
Results
Overall, there were no group differences at baseline evaluation across groups. There was baseline to end-of-treatment and end-of-study improvement in all outcomes except the Patient Health Questionnaire-9 (PHQ-9) that did not show consistent change across the study. A number of significant group × time differences, all reflecting acceleration in outcomes for the ASAP group relative to the usual care groups, were found from baseline to end-of-treatment (i.e., treatment phase). From end-of-treatment to end-of-study (i.e., follow-up phase), most observed slope differences reflected an improvement or ”catch-up” response for usual care groups relative to the ASAP group, while outcomes were generally sustained after treatment ended for the ASAP group without additional improvements. This result indicates that the ASAP patients achieved improvements faster than the other two groups.
Body Functions and Structures
Figure 1 illustrates change in impairment-related measures over time. In the Fugl-Meyer Assessment (FMA-UE; see Figure 1A and Table 2) there were large improvements across all groups in the treatment period (P <.001, and smaller, though statistically significant improvements in follow-up (P <.001). While the rate of change during treatment was larger in the ASAP group (MChange = 9.3) versus DEUCC and ASAP (8.3 and 7.9, respectively), this difference was not statistically significant (P = .34). During the follow up period, the DEUCC and UCC groups had an increased rate of change (P = .047) versus the ASAP group. Thus while the groups were comparable by end of study (P = .46), they reached that endpoint with different trajectories.
SIS Strength improved only during the treatment phase (P < .001), and not in the follow-up phase (P = .53). By the end of the study, the ASAP group rated their strength as significantly greater than DEUCC and UCC, gaining a net overall change score of 13.9 on average, versus 10.4 for DEUCC and 8.0 for UCC.
There were no systematic changes in PHQ-9 across time or by group (Supplemental materials, Figure S1A). The SIS Mood and Emotion subscale (Figure S1B) improved in all groups across the year (PTreatment = < .001, PFollow-up = .04), with increases being comparable and large (mean change 4.6) for both ASAP and DEUCC during treatment, and then stabilizing, while being slower in UCC during treatment (M change = 1.1) and catching up across the follow up period (MChange = 1.9).
Confidence in arm and hand movement (CAHM) rose significantly across the treatment phase for all groups (P < .001, see Figure 1C, Table 2) with an average increase of 32.7 for ASAP, 21.5 for DEUCC, and 19.6 for UCC; this led to a statistically significant group effect between ASAP and the other groups at end-of-treatment (P < .001). Differences between ASAP and the usual care groups exceeded the MCID, with 86.1, 72.7, and 69.9% of the ASAP, DEUCC, and UCC groups achieving the Confidence in Arm and Hand Movement MCID (see Supplemental Materials). During the follow-up period, both the ASAP and DEUCC groups were stable (95%CI of change included 0), while the UCC group caught up, increasing on average 7.5 points, such that at end-of-study the ASAP group remained higher than the UCC group (P < .05), but there were overlaps between DEUCC and the other groups.
Consistent with an interpretation of acceleration in outcomes, a significant group × time interaction was found for perceived recovery from stroke (SIS Perception of Recovery) during the treatment period (P < .001; Figure S1C) which reflects the 50% higher mean change for ASAP (21.5) than UCC (14.0); the DEUCC group also increased during this period (MChange = 20.5), but had more variability in rate of change so as not to be statistically different than the other groups. Treatment trajectory changes exceeded the MCID as well, with 79.8, 60.6, and 53.7% of the ASAP, DEUCC, and UCC groups improving beyond this mark. Improvement continued during the follow-up period (P < .001), but the increase in the UCC group compared to the other groups, was not statistically significant (P = .66).
This pattern of findings was also seen for perceived health (EQ-5D-VAS; Figure 1D), though the ASAP group reached a plateau in overall change by end-of-treatment, while the other groups continued to improve.
Activities
As illustrated in Figure 2, Table 2 and the Supplemental materials, Figure S2, all SIS subscales in the Activity category exhibited significant change from baseline to end of treatment (P’s < .01). For SIS Hand (Figure 2A), SIS Mobility (Figure 2B), and SIS-16 (Figure 2C), the ASAP group reported better function than both usual care groups at the end-of-treatment time point (P’s < .05). Reported mobility exceeded the MCID for ASAP relative to the usual care groups at the end of treatment; 68.3, 71, 61.1% of ASAP, DEUCC, and UCC participants, respectively, met the minimally important difference. Significant group × time interactions in follow-up trajectories for the SIS measures indicated greater follow-up phase improvement for the usual care groups, while the ASAP group remained stable or declined slightly after the treatment phase. No significant group differences were seen in SIS Activities of Daily Living (Figure S2A) or SIS Communication (Figure S2B) measures. A greater follow-up phase change was seen in SIS Memory and Thinking (Figure S2C and Table 2) in the UCC group relative to the ASAP group, reflecting stability in the UCC group (Mchange = 0.4) and an average decline of 2.1 in the ASAP group after the treatment phase.
Figure 2. Activity.
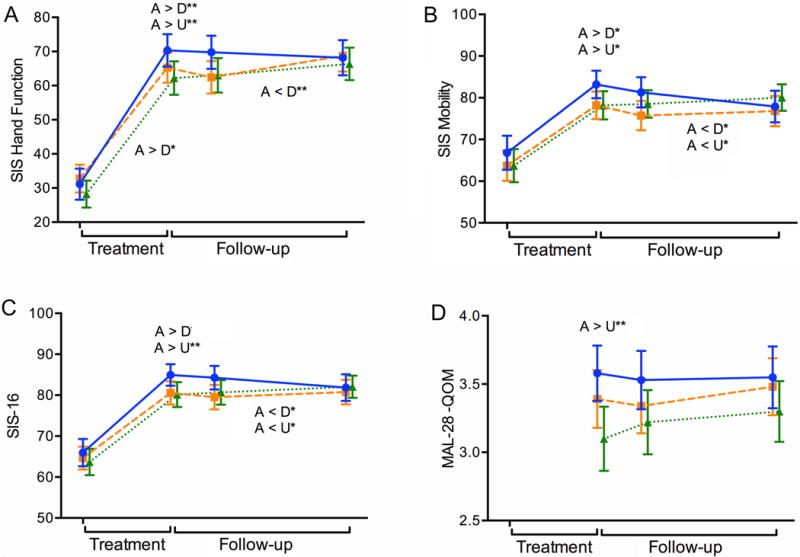
Illustrates changes in Activities over time. On the horizontal axis, the left side in each figure (Treatment) indicates changes (improvements) from baseline assessment to the end-of-treatment time point while the right side (Follow-up) reflects end-of-treatment to end-of-study change. The slopes of the lines correspond to the statistics provided in the “Improvement Trajectories” rows of Table 2. Longitudinal plots across the two phases of (A) SIS Hand function, (B) SIS Mobility, (C) SIS-16, and (D) Motor Activity Log-28 Quality of Movement, MAL-28 QOM. Solid blue line (Accelerated Skill Acquisition Program, ASAP), dashed orange line (Dose-equivalent Usual and Customary Care, DEUCC), dotted green line (monitoring-only Usual and Customary Care, UCC). Means and standard error of the means are represented. Group differences at time points are denoted above the data lines; group × time trajectory differences are found below the data lines. * P < .05, ** P < .01.
MAL-28 was collected only at post-baseline visits. Participants in the ASAP group had higher Motor Activity Log quality of movement scores (P = .006) than UCC participants. There was overall stability across groups during the follow-up period (P = .20; see Figure 2D).
Participation/Quality of Life
ASAP participants reported higher levels of participation at the end of treatment (MChange = 17.5) in the Reintegration to Normal Living Index (RNLI, Figure 3A) versus MChange = 13.6 and 12.4 for DEUCC and UCC, respectively, leading to a higher rating at end-of-treatment for ASAP (P = .004). These levels met the MCID for the RNLI, with 76.2, 69.7, and 59.1% of the ASAP, DEUCC, and UCC participants, respectively, exceeding the minimally important difference. RNLI participation largely stabilized for ASAP and DEUCC during follow-up, while the UCC group continued to improve so that by 12 months there were no group differences in RNLI (P = .24). This same pattern was seen for SIS Participation (Figure S3) as well for ASAP and UCC. The MCID for this participation measure was met for ASAP relative to UCC; 76.9, 73, and 71.6% of the ASAP, DEUCC, and UCC participants, respectively, achieved the MCID. For the SIS Participation scale, DEUCC and UCC outcomes increased during the follow-up period.
Exit interview items created for this study included improved quality of life, ability to return to work or hobbies, and ability to do important and meaningful activities daily and were measured at end-of-treatment and end-of-study. Participants’ reports were significantly higher for ASAP than DEUCC and UCC at end-of-treatment (P’s ≤ .001). This pattern remained when measured at end-of-study. All groups reported improvement with Satisfaction with Living for the treatment (p < 0.001) and follow-up (P = .03) phases.
Patient-centeredness
ASAP group participants rated all patient-centered exit interview items, including the HCCQ, as significantly more present in their intervention than did usual care groups (Table 3). Generally, usual care groups did not differ from each other in patient-centeredness, but exceptions to this pattern were found in two of these items. Participants in the DEUCC group perceived more opportunity to choose activities and a greater focus on the kinds of stroke-related problems most important to focus on in therapy than did the UCC participants.
Table 3.
Participant Ratings of Therapy Experience
| Items | ASAP | DEUCC | UCC | Group P value Post-hoc P |
|||
|---|---|---|---|---|---|---|---|
| N | Mean (CI95) | N | Mean (CI95) | N | Mean (CI95) | ||
| Health Care Climate Questionnaire | 45 | 6.9 (6.87 7.00) | 49 | 6.3 (6.03, 6.55) | 37 | 6.1 (5.73, 6.44) |
< .001 A > D < .001 A > U < .001 |
| 1. I feel that my therapist has provided me choices and options. | |||||||
| 2. I feel understood by my therapist. | |||||||
| 3. My therapist conveys confidence in my ability to make changes. | |||||||
| 4. I feel a lot of trust in my therapist. | |||||||
| 5. My therapist listens to how I would like to do things. | |||||||
| 6. My therapist tries to understand how I see things before suggesting a way to do things. | |||||||
| To what extent did you have the opportunity to choose the activities that you and your therapist worked on? | 99 | 6.8 (6.65, 6.95) | 90 | 5.1 (4.64, 5.47) | 83 | 4.3 (3.85, 4.85) |
< .001 A > D < .001 A > U < .001 D > U = .029 |
| To what extent did you and your therapist focus on the kinds of problems you felt were most important to spend therapy time on after your stroke? | 99 | 6.9 (6.83, 6.95) | 90 | 6.3 (6.08, 6.50) | 83 | 5.6 (5.21,6.05) |
< .001 A > D = .003 A > U < .001 D > U = .001 |
| To what extent did you feel in control of the kinds of activities you worked on every day in (ICARE) therapy? | 99 | 6.5 (6.29, 6.72) | 90 | 5.2 (4.87, 5.62) | 83 | 4.9 (4.45, 5.33) |
< .001 A > D < .001 A > U < .001 |
| To what extent did you feel your therapist decided for you what kinds of activities you worked on every day in (ICARE) therapy? | 98 | 3.4 (3.02, 3.88) | 90 | 5.7 (5.44, 5.03) | 83 | 5.8 (5.51,6.13) |
< .001 A < D < .001 A < U < .001 |
| To what extent was your therapist interested in building your confidence in using your weaker arm or hand? | 98 | 6.9 (6.86, 6.98) | 90 | 6.5 (6.26, 6.69) | 83 | 6.4 (6.10, 6.67) |
< .001 A > D = .005 A > U = .001 |
| How well did the ICARE therapist take your goals and preferences into account in your training? | 98 | 6.9 (6.87, 6.99) | 90 | 6.4 (6.16, 6.64) | 81 | 6.0 (5.69, 6.39) |
< .001 A > D = .004 A > U < .001 |
| How helpful was the number of visits you had with your ICARE therapist? | 98 | 6.8 (6.70, 6.99) | 90 | 6.5 (6.30, 6.72) | 83 | 6.1 (5.85, 6.44) |
< .001 A > U < .001 |
Discussion
In this large pragmatic controlled trial, compared with usual care and across outcome measures that span the ICF, the investigational intervention produced accelerated improvements from baseline to the end of treatment, on average 5.5 months after stroke. End of treatment improvements were generally sustained but not advanced further to the study endpoint. With important exceptions (SIS Strength and quality of life in which ASAP participants reported higher levels at study’s end relative to usual care groups), group differences disappeared 1 year after randomization (~13.5 months after stroke). In essence, the ASAP advantage at the end of treatment was matched by the “late” or catch-up recovery exhibited by the two usual care groups. Accelerated outcomes occurred across diverse measures, including body functions and structures, activities, participation, and quality of life, a number of which were non-motor in nature. These group-related enhancements were seen in patient-reported, but not performance-based (i.e., FMA and WMFT2), motor outcomes. Group distinctions in favor of the ASAP intervention spanned ICF categories and were observed with respect to confidence, perceived health (considered here as impairments of mind), function, participation, and quality of life.
In contrast to the distinctions between ASAP and the usual care groups in accelerated outcomes in a number of secondary measures, there were few significant differences between the dose-equivalent usual care and monitoring only (usual dose of usual care) groups. The lack of a dose effect within the secondary outcomes is consistent with that found in the primary outcome of WMFT-assessed motor performance in the ICARE trial.2
During a dynamic recovery window early in the subacute phase, changes in motor impairment were large but not different between groups in the ICARE cohort. Upper extremity motor impairment (i.e., FMA-UE) improved, by approximately 30% from baseline to end of study, but there were no differences in this recovery across the three groups or by treatment and follow-up phase. This outcome parallels the substantial but equivalent impact captured by the primary outcome, a laboratory-based measure of motor performance (WMFT).2 There is strong evidence that upper limb motor impairment resolves by 70% of the maximum possible, but only for patients with intact corticomotor function.35 Therefore, independent of therapy, a likely explanation for the majority of motor recovery, given ICARE inclusion criteria and recent lesion analysis,36 is spontaneous neurobiological processes involving ipsilesional corticomotor pathways.
By contrast, recovery outcomes beyond motor impairment can depend on therapy and reveal that gains in body functions and structures, activities, participation, and quality of life were achieved more quickly for the ASAP intervention group, and without compromise to impairment mitigation and motor performance. ASAP-associated benefits were accomplished with relatively minimal clinician training, use of documentation-embedded microstructures, and reinforcement of strategies that supported skill-focused practice, confidence building, and high levels of therapist-participant collaboration throughout sessions.10, 26 These strategies to facilitate behavior change can be considered briefer versions of brief action planning approaches.37
How might the immediate, accelerated benefits exhibited by the ASAP group be explained? This augmentation of spontaneous neurobiological processes points to the contribution of unique aspects of ASAP beyond those that may have produced motor impairment and motor performance improvements. Previous research and clinical programs directed at upper extremity recovery have emphasized high volumes of task-oriented practice to resolve deficits in arm and hand capability.38 This perspective has been generated, in part, because animal-derived approaches implied the need, and because relatively few practice repetitions have been observed in usual care.39 Recent reviews38, 39 suggest that task practice, particularly number of repetitions or minutes of active task practice, is central to motor recovery, perhaps accounting for one-third of the variance in outcomes.40 There are notable exceptions to the assumed benefit of higher volumes of practice.41–45 A recent phase 2 examination with four distinct levels of task repetitions concluded that there was no evidence for a dose-response effect of task-specific training on upper limb functional capacity and on motor performance as assessed by accelerometry in people with chronic stroke.44, 45 In that sample, participants also reported subjective gains related to treatment dose.
Beyond recent assessments of dose-response relations, other evidence suggests that dose of task practice per se may not be the key to all aspects of recovery, that it was once considered.28, 46, 47 For example, Gauthier and colleagues46 compared two versions of CIMT training, one with traditional elements of constraint-induced therapy, including intensive in-laboratory training (task practice and “shaping” of behavior with progressive practice) of the more impaired arm on functional tasks for 3 hours daily for 10 consecutive weekdays, restraint of the less-impaired arm for approximately 90% of waking hours, and what was termed a “transfer package” for an additional half-hour every training day with review of daily arm use and problem-solving to overcome perceived barriers to arm use. This version of CIMT was compared to one with all elements except the transfer package. CIMT with transfer package was superior to the CIMT without transfer package; evidence indicated that the CIMT group with transfer package showed both structural brain changes in gray matter in the sensory and motor regions and hippocampus, and large behavioral changes in real-world arm function, while the group receiving CIMT without the transfer package did not have gray matter increases, and exhibited smaller motor activity improvements. These results imply that it was not the volume of task practice and progressive task practice itself that drove brain and motor activity changes but the efforts to generalize arm use to the natural environment. Another study indicated similar superiority of a CIMT group with the transfer package in 6-month FMA-UE and MAL scores, relative to a CIMT group with every element but the transfer package.47 In ASAP, efforts to bridge the clinic to home and community gap and to contextualize arm and hand practice with participant selection of meaningful tasks, emphasis on confidence building, and action plans may have contributed to the activity and participation differences seen relative to usual care, perhaps acting in a similar fashion to other forms of transfer packages. Embedding of task practice and motor learning within a participant’s own meaningful contexts may contribute to development or re-establishment of functional neural connectivity.48–51
Upper extremity rehabilitation research and practice has focused heavily on impairment mitigation and motor performance gains as important outcomes. Other rehabilitation research has emphasized participants’ return to full participation as tantamount.52 We cannot say whether the array of patient-reported outcomes and patient perspectives observed here would have been produced without concomitant improvements in motor impairment and laboratory-assessed motor performance because the set of outcomes were coincident. Indeed, enhancements in self-efficacy as demonstrated in this study, are suggestive of a role for actual performance accomplishments in observed benefits.14, 53 We can suggest, however, that motor impairment and performance improvements alone (i.e., equivalent improvement across treatment groups) were not sufficient53 to influence, equally, the remaining outcomes associated with the investigational group at the end of treatment.
Addressing motor impairment, skill performance, and recovery with motivational enhancements may contribute both to greater satisfaction with rehabilitative care and to the mitigation of other stroke sequelae.54–56 The inability of gains made by the end of treatment to promulgate into even fuller recovery by the end of the study 13.5 months after stroke can be instructive to rehabilitative practice and policy. Even individuals with minor strokes and mild to moderate upper extremity impairment have not reached pre-stroke outcome levels over 1 year post-stroke and would appear to require additional time or interventions to do so.22, 52 Limited recovery, even after a minor stroke represents a significant opportunity for new clinical translational models.57
If outcomes eventually converge across groups, what is the advantage to ASAP accelerating these outcomes-We argue that arriving at gains across the ICF spectrum up to 8 months earlier post-stroke, as did ASAP participants relative to their usual care counterparts, may reduce some of the economic, health, social, and psychological burdens of stroke.58, 59 Further, we demonstrated enhanced patient experience in the ASAP group relative to usual care. Even if we were to disregard the additional benefits in patient-reported outcomes, this effect may encourage rehabilitation providers to further refine efforts to customize practice and collaborate with patients to support their autonomy and confidence during formal rehabilitation,10, 21–24 as this perspective is associated with and need not limit other patient gains.
By including secondary outcomes across the ICF and end-of-therapy time points in this analysis, a more complete picture emerges of the multifaceted nature of stroke recovery beyond the focus of designated primary outcomes.2, 52, 60 In contrast to the equivalence suggested in our primary outcome report,2 the spectrum of results reported here can support an intervention preference for the Accelerated Skill Acquisition Program. The principles and strategies of ASAP would seem agnostic to particular task focus (e.g., hand dexterity, locomotion, speech), and perhaps to specific diagnoses, severity, timing, and dose of efforts. Future research is needed to examine the potential to move this approach beyond rehabilitation of the arm to multifaceted, customized rehabilitation and fuller recovery for people with varied disability.
Supplementary Material
Acknowledgments
Funding/Support: The Interdisciplinary Comprehensive Arm Rehabilitation Evaluation (ICARE) Stroke Initiative randomized controlled trial was funded by the National Institutes of Health (jointly by the National Institute of Neurological Disorders and Stroke, primary, and the National Center for Medical Rehabilitation Research of the Eunice Kennedy Shriver National Institute of Child Health and Human Development, secondary). NIH grant U01NS056256. Each author received grant support during the conduct of the study.
Footnotes
Interdisciplinary Comprehensive Arm Rehabilitation Evaluation (ICARE) Stroke Initiative, at www.ClinicalTrials.gov/ClinicalTrials.gov Identifier: NCT00871715.
Conflict of Interest Statement
The authors declare that there is no conflict of interest.
References
- 1.Mayo NE, Wood-Dauphinee S, Cote´ R, Durcan L, Carlton J. Activity, participation, and quality of life 6 months poststroke. Arch Phys Med Rehabil. 2002;83:1035–42. doi: 10.1053/apmr.2002.33984. [DOI] [PubMed] [Google Scholar]
- 2.Winstein CJ, Wolf SL, Dromerick AW, et al. Effect of a task-oriented rehabilitation program on upper extremity recovery following motor stroke: the ICARE randomized clinical trial. JAMA. 2016;315(6):571–581. doi: 10.1001/jama.2016.0276. [DOI] [PMC free article] [PubMed] [Google Scholar]
- 3.Wolf SL, Lecraw DE, Barton LA, Jann BB. Forced use of hemiplegic upper extremities to reverse the effect of learned nonuse among chronic stroke and head injured patients. Exp Neurol. 1989;104:125–132. doi: 10.1016/s0014-4886(89)80005-6. [DOI] [PubMed] [Google Scholar]
- 4.Winstein CJ, Stein J, Arena R, et al. on behalf of the American Heart Association Stroke Council, Council on Cardiovascular and Stroke Nursing, Council on Clinical Cardiology, and Council on Quality of Care and Outcomes Research. Guidelines for adult stroke rehabilitation and recovery: a guideline for healthcare professionals from the American Heart Association/American Stroke Association. Stroke. 2016;47:e98–e169. doi: 10.1161/STR.0000000000000098. [DOI] [PubMed] [Google Scholar]
- 5.Dromerick AW, Edwardson MA, Edwards DF, et al. Critical periods after stroke study: translating animal stroke recovery experiments into a clinical trial. Front Hum Neurosci. 2015;9:231. doi: 10.3389/fnhum.2015.00231. [DOI] [PMC free article] [PubMed] [Google Scholar]
- 6.Taub E. The behavior-analytic origins of constraint-induced movement therapy: an example of behavioral neurorehabilitation. Behav Analyst. 2012;35:155–178. doi: 10.1007/BF03392276. [DOI] [PMC free article] [PubMed] [Google Scholar]
- 7.Taub E, Uswatte G, King DK, Morris D, Crago JE, Chatterjee A. A placebo-controlled trial of constraint-induced movement therapy for upper extremity after stroke. Stroke. 2006;37:1045–1049. doi: 10.1161/01.STR.0000206463.66461.97. [DOI] [PubMed] [Google Scholar]
- 8.Kleim JA, Barbay S, Nudo RJ. Functional reorganization of the rat motor cortex following motor skill learning. J Neurophysiol. 1998;80:3321–3325. doi: 10.1152/jn.1998.80.6.3321. [DOI] [PubMed] [Google Scholar]
- 9.Nudo RJ, Milliken GW, Jenkins WM, Merzenich MM. Use-dependent alterations of movement representation in primary motor cortex of adult squirrel monkeys. J Neurosci. 1996;16:785–807. doi: 10.1523/JNEUROSCI.16-02-00785.1996. [DOI] [PMC free article] [PubMed] [Google Scholar]
- 10.Winstein C, Lewthwaite R, Blanton SR, Wolf LB, Wishart L. Infusing motor learning research into neurorehabilitation practice: a historical perspective with case exemplar from the Accelerated Skill Acquisition Program. J Neurol Phys Ther. 2014;38:190–200. doi: 10.1097/NPT.0000000000000046. [DOI] [PMC free article] [PubMed] [Google Scholar]
- 11.Wulf G, Lewthwaite R. Optimizing performance through intrinsic motivation and attention for learning: The OPTIMAL theory of motor learning. Psychon Bull Rev. 2016;23:1382–1414. doi: 10.3758/s13423-015-0999-9. [DOI] [PubMed] [Google Scholar]
- 12.Whitall J, McCombe Waller S, Sorkin JD, et al. Bilateral and unilateral arm training improve motor function through differing neuroplastic mechanisms: a single-blinded randomized controlled trial. Neurorehabil Neural Repair. 2011;25:118–129. doi: 10.1177/1545968310380685. [DOI] [PMC free article] [PubMed] [Google Scholar]
- 13.Platz T, Winter T, Müller N, Pinkowski C, Eickhof C, Mauritz KH. Arm ability training for stroke and traumatic brain injury patients with mild arm paresis: a single-blind, randomized, controlled trial. Arch Phys Med Rehabil. 2001;82:961–968. doi: 10.1053/apmr.2001.23982. [DOI] [PubMed] [Google Scholar]
- 14.Bandura A. Self-efficacy: toward a unifying theory of behavioral change. Psychol Rev. 1977;84:191–215. doi: 10.1037//0033-295x.84.2.191. [DOI] [PubMed] [Google Scholar]
- 15.Ryan RM, Deci EL. Self-Determination Theory and the facilitation of intrinsic motivation, social development, and well-being. Am Psychol. 2000;55:68–78. doi: 10.1037//0003-066x.55.1.68. [DOI] [PubMed] [Google Scholar]
- 16.Williams GC, McGregor HA, Sharp D, et al. Testing a Self-Determination Theory intervention for motivating tobacco cessation: supporting autonomy and competence in a clinical trial. Health Psychol. 2006;25:91–101. doi: 10.1037/0278-6133.25.1.91. [DOI] [PubMed] [Google Scholar]
- 17.Jones F, Riazzi A. Self-efficacy and self-management after stroke: a systematic review. Disabil Rehabil. 2011;33:797–810. doi: 10.3109/09638288.2010.511415. [DOI] [PubMed] [Google Scholar]
- 18.Langer EJ, Rodin J. The effects of choice and enhanced personal responsibility for the aged: a field experiment in an institutional setting. J Pers Soc Psychol. 1976;34:191–198. doi: 10.1037//0022-3514.34.2.191. [DOI] [PubMed] [Google Scholar]
- 19.Massie C, Malcolm MP, Greene D, Thaut M. The effects of constraint-induced therapy on kinematic outcomes and compensatory movement patterns: an exploratory study. Arch Phys Med Rehabil. 2009;90:571–9. doi: 10.1016/j.apmr.2008.09.574. [DOI] [PubMed] [Google Scholar]
- 20.Institute of Medicine. Crossing the Quality Chasm: A New Health Care System for the 21st Century. Washington, DC: National Academy Press; 2001. [Google Scholar]
- 21.Luker J, Lynch E, Bernhardsson S, Bennett L, Bernhardt J. Stroke survivors’ experiences of physical rehabilitation: a systematic review of qualitative studies. Arch Phys Med Rehabil. 2015;96:1698–708. doi: 10.1016/j.apmr.2015.03.017. [DOI] [PubMed] [Google Scholar]
- 22.Morris JH, Oliver T, Kroll T, Joice S, Williams B. From physical and functional to continuity with pre-stroke self and participation in valued activities: A qualitative exploration of stroke survivors’, carers’ and physiotherapists’ perceptions of physical activity after stroke. Disabil Rehabil. 2015;37:64–77. doi: 10.3109/09638288.2014.907828. [DOI] [PubMed] [Google Scholar]
- 23.Rosewilliam S, Sintler C, Pandyan AD, Skelton J, Roskell CA. Is the practice of goal-setting for patients in acute stroke care patient-centred and what factors influence this-A qualitative study. Clin Rehabil. 2016;30:508–519. doi: 10.1177/0269215515584167. [DOI] [PubMed] [Google Scholar]
- 24.Zimmermann L, Konrad A, Müller C, Rundel M, Körner M. Patient perspectives of patient-centeredness in medical rehabilitation. Patient Educ Couns. 2014;96:98–105. doi: 10.1016/j.pec.2014.04.015. [DOI] [PubMed] [Google Scholar]
- 25.World Health Organization. International Classification of Functioning, Disability, and Health. World Health Organization; 2001. [Google Scholar]
- 26.Winstein CJ, Wolf SL, Dromerick AW, et al. Interdisciplinary Comprehensive Arm Rehabilitation Evaluation (ICARE): a randomized controlled trial protocol. BMC Neurol. Jan 11;13:5. doi: 10.1186/1471-2377-13-5. [DOI] [PMC free article] [PubMed] [Google Scholar]
- 27.Fugl-Meyer AR, Jääskö L, Leyman I, Olsson S, Steglind S. The post-stroke hemiplegic patient. A method for evaluation of physical performance. Scand J Rehabil Med. 1975;7(1):13–31. [PubMed] [Google Scholar]
- 28.Winstein CJ, Wolf SL, Schweighofer N. Task-oriented training to promote upper extremity recovery. In: Stein J, Harvey RL, Winstein CJ, Zorowitz RD, Wittenberg GF, editors. Stroke Recovery and Rehabilitation. 2nd. New York, NY: Demos Medical; 2015. [Google Scholar]
- 29.Duncan PW, Wallace D, Lai SM, Johnson D, Embretson S, Laster LJ. The Stroke Impact Scale version 2.0: evaluation of reliability, validity, and sensitivity to change. Stroke. 1999;30:2131–2140. doi: 10.1161/01.str.30.10.2131. [DOI] [PubMed] [Google Scholar]
- 30.Frank L, Basch E, Selby JV. The PCORI perspective on patient-centered outcomes research. JAMA. 2014;312(15):1513–1514. doi: 10.1001/jama.2014.11100. [DOI] [PubMed] [Google Scholar]
- 31.Merlo AR, Goodman A, McClenaghan BA, Fritz SL. Participants’ perspectives on the feasibility of a novel, intensive, task-specific intervention for individuals with chronic stroke: a qualitative analysis. Phys Ther. 2013;93:147–157. doi: 10.2522/ptj.20110147. [DOI] [PubMed] [Google Scholar]
- 32.Rosenzveig A, Kuspinar A, Daskalopoulou SS, Mayo NE. Toward patient-centered care: a systematic review of how to ask questions that matter to patients. Medicine (Baltimore) 2014;93:1–10. doi: 10.1097/MD.0000000000000120. [DOI] [PMC free article] [PubMed] [Google Scholar]
- 33.Uswatte G, Taub E, Morris D, Light K, Thompson PA. The Motor Activity Log-28: assessing daily use of the hemiparetic arm after stroke. Neurol. 2006;10(67):1189–94. doi: 10.1212/01.wnl.0000238164.90657.c2. [DOI] [PubMed] [Google Scholar]
- 34.Williams GC, Grow VM, Freedman ZR, Ryan RM, Deci EL. Motivational predictors of weight loss and weight loss maintenance. J Pers Soc Psychol. 1996;70:115–126. doi: 10.1037/0022-3514.70.1.115. [DOI] [PubMed] [Google Scholar]
- 35.Byblow WD, Stinear CM, Barber PA, Petoe MA, Ackerley SJ. Proportional recovery after stroke depends on corticomotor integrity. Ann Neurol. 2015;78:848–859. doi: 10.1002/ana.24472. [DOI] [PubMed] [Google Scholar]
- 36.Edwardson MA, Wang X, Liu B, et al. Stroke lesions in a large upper limb rehabilitation trial cohort rarely match lesions in common preclinical models. Neurorehabil Neural Repair. 2017;31:509–520. doi: 10.1177/1545968316688799. [DOI] [PMC free article] [PubMed] [Google Scholar]
- 37.Gutnick D, Reims K, Davis C, Gainforth H, Jay M, Cole S. Brief action planning to facilitate behavior change and support patient self-management. J Clin Outcomes Manag. 2014;21:17–29. [Google Scholar]
- 38.Timmermans AAA, Spooren AIF, Kingma H, Seelen HAM. Influence of task-oriented training content on skilled arm-hand performance in stroke: a systematic review. Neurorehabil Neural Repair. 2010;24:858–870. doi: 10.1177/1545968310368963. [DOI] [PubMed] [Google Scholar]
- 39.Hayward KS, Brauer SG. Dose of arm activity training during acute and subacute rehabilitation post stroke: a systematic review of the literature. Clin Rehabil. 2015;29:1234–1243. doi: 10.1177/0269215514565395. [DOI] [PubMed] [Google Scholar]
- 40.Lang CE, Lohse KR, Birkenmeier RL. Dose and timing in neurorehabilitation: prescribing motor therapy after stroke. Curr Opin Neurol. 2015;28:549–555. doi: 10.1097/WCO.0000000000000256. [DOI] [PMC free article] [PubMed] [Google Scholar]
- 41.Ross LF, Harvey LA, Lannin NA. Do people with acquired brain impairment benefit from additional therapy specifically directed at the hand-A randomized controlled trial. Clin Rehabil. 2009;23:492–503. doi: 10.1177/0269215508101733. [DOI] [PubMed] [Google Scholar]
- 42.Dromerick AW, Lang CE, Birkenmeier RL, et al. Very Early Constraint-Induced Movement during Stroke Rehabilitation (VECTORS): a single-center RCT. Neurol. 2009;73:195–201. doi: 10.1212/WNL.0b013e3181ab2b27. [DOI] [PMC free article] [PubMed] [Google Scholar]
- 43.The AVERT Trial Collaboration group. Efficacy and safety of very early mobilisation within 24 hours of stroke onset (AVERT): a randomised controlled trial. Lancet. 2015;386:46–55. doi: 10.1016/S0140-6736(15)60690-0. [DOI] [PubMed] [Google Scholar]
- 44.Lang CE, Strube MJ, Bland MD, et al. Dose response of task-specific upper limb training in people at least 6 months poststroke: a phase II, single-blind, randomized, controlled trial. Ann Neurol. 2016;80:342–354. doi: 10.1002/ana.24734. [DOI] [PMC free article] [PubMed] [Google Scholar]
- 45.Waddell KJ, Strube MJ, Bailey RR, et al. Does task-specific training improve upper limb performance in daily life poststroke? Neurorehabil Neural Repair. 2017;31:290–300. doi: 10.1177/1545968316680493. [DOI] [PMC free article] [PubMed] [Google Scholar]
- 46.Gauthier LV, Taub E, Perkins C, Ortmann M, Mark VW, Uswatte G. Remodeling the brain: plastic structural brain changes produced by different motor therapies after stroke. Stroke. 2008;39:1520–1525. doi: 10.1161/STROKEAHA.107.502229. [DOI] [PMC free article] [PubMed] [Google Scholar]
- 47.Takebayashi T, Koyama T, Amano S, et al. A 6-month follow-up after constraint-induced movement therapy with and without transfer package for patients with hemiparesis after stroke: a pilot quasi-randomized controlled trial. Clin Rehabil. 2013;27:418–426. doi: 10.1177/0269215512460779. [DOI] [PubMed] [Google Scholar]
- 48.Corbetta M. Functional connectivity and neurological recovery. Dev Psychobiol. 2012;54:239–253. doi: 10.1002/dev.20507. [DOI] [PubMed] [Google Scholar]
- 49.Stewart JC, Dewanjee P, Shariff U, Cramer SC. Dorsal premotor activity and connectivity relate to action selection performance after stroke. Hum Brain Mapp. 2016;37:1816–1830. doi: 10.1002/hbm.23138. [DOI] [PMC free article] [PubMed] [Google Scholar]
- 50.Westlake KP, Nagarajan SS. Functional connectivity in relation to motor performance and recovery after stroke. Front Syst Neurosci. 2011;5 doi: 10.3389/fnsys.2011.00008. Article 8. [DOI] [PMC free article] [PubMed] [Google Scholar]
- 51.Wadden KP, Woodward TS, Metzak PD, et al. Compensatory motor network connectivity is associated with motor sequence learning after subcortical stroke. Behav Brain Res. 2015;286:136–145. doi: 10.1016/j.bbr.2015.02.054. [DOI] [PMC free article] [PubMed] [Google Scholar]
- 52.Mayo NE, Anderson S, Barclay R, et al. Getting on with the rest of your life following stroke: a randomized trial of a complex intervention aimed at enhancing life participation post stroke. Clin Rehabil. 2015;29:1198–1211. doi: 10.1177/0269215514565396. [DOI] [PubMed] [Google Scholar]
- 53.Mayo NE, Bronstein D, Scott SC, Finch LE, Miller S. Necessary and sufficient causes of participation post-stroke: practical and philosophical perspectives. Qual Life Res. 2014;23:39–47. doi: 10.1007/s11136-013-0441-6. [DOI] [PubMed] [Google Scholar]
- 54.Sheeran P, Maki A, Montanaro E, et al. The impact of changing attitudes, norms, and self-efficacy on health-related intentions and behavior: a meta-analysis. Health Psychol. 2016;35:1178–1188. doi: 10.1037/hea0000387. [DOI] [PubMed] [Google Scholar]
- 55.Stenholm S, Kivimaki M, Jylha M, et al. Trajectories of self-rated health in the last 15 years of life by cause of death. Eur J Epidemiol. 2016;31:177–185. doi: 10.1007/s10654-015-0071-0. [DOI] [PubMed] [Google Scholar]
- 56.Wager TD, Atlas LY. The neuroscience of placebo effects: connecting context, learning and health. Nature Rev Neurosci. 2015;16:403–418. doi: 10.1038/nrn3976. [DOI] [PMC free article] [PubMed] [Google Scholar]
- 57.Corbett D, Jeffers M, Nguemeni C, Gomez-Smith M, Livingston-Thomas J. Lost in translation: rethinking approaches to stroke recovery. Prog Brain Res. 2015;218:413–434. doi: 10.1016/bs.pbr.2014.12.002. [DOI] [PubMed] [Google Scholar]
- 58.Northcott S, Moss B, Harrison K, Hilari K. A systematic review of the impact of stroke on social support and social networks: associated factors and patterns of change. Clin Rehabil. 2016;30:811–831. doi: 10.1177/0269215515602136. [DOI] [PubMed] [Google Scholar]
- 59.Wolfenden B, Grace M. Returning to work after stroke: a review. Int J Rehabil Res. 2009;32:93–97. doi: 10.1097/MRR.0b013e328325a358. [DOI] [PubMed] [Google Scholar]
- 60.Valero-Cuevas FJ, Klamroth-Marganska V, Winstein CJ, Riener R. Robot-assisted and conventional therapies produce distinct rehabilitative trends in stroke survivors. J NeuroEngineering Rehabil. 2016;13:92. doi: 10.1186/s12984-016-0199-5. [DOI] [PMC free article] [PubMed] [Google Scholar]
Associated Data
This section collects any data citations, data availability statements, or supplementary materials included in this article.