

Abstract
Pairwise and network meta-analysis (NMA) are traditionally used retrospectively to assess existing evidence. However, the current evidence often undergoes several updates as new studies become available. In each update recommendations about the conclusiveness of the evidence and the need of future studies need to be made. In the context of prospective meta-analysis future studies are planned as part of the accumulation of the evidence. In this setting, multiple testing issues need to be taken into account when the meta-analysis results are interpreted. We extend ideas of sequential monitoring of meta-analysis to provide a methodological framework for updating NMAs. Based on the z-score for each network estimate (the ratio of effect size to its standard error) and the respective information gained after each study enters NMA we construct efficacy and futility stopping boundaries. A NMA treatment effect is considered conclusive when it crosses an appended stopping boundary. The methods are illustrated using a recently published NMA where we show that evidence about a particular comparison can become conclusive via indirect evidence even if no further trials address this comparison.
Keywords: Sequential methods, stopping rules, update of systematic reviews, efficacy and futility boundaries, multiple treatments
1 Introduction
In 1898, George Gould, the first president of the Association of Medical Librarians, presented his vision regarding the optimal use of existing evidence. He was looking forward to a situation where “a puzzled worker in any part of the civilized world shall in an hour be able to gain a knowledge pertaining to a subject of the experience of every other man in the world”.1 Highlighting the increasing information overload and the pivotal role of systematic reviews in health care,2 Mike Clarke updated Gould’s vision in 2004, hoping for a system in which decision makers “would be able, in 15 minutes, to obtain up-to-date, reliable evidence of the effects of interventions they might choose, based on all the relevant research.”3
In essence Gould and Clarke call for cumulative (network) meta-analyses of randomized trials of health care interventions.4–7 Ideally, cumulative meta-analyses are prospectively planned: investigators establish a collaboration before the design of their trials is finalized, so that study procedures, interventions and outcomes can be harmonized and analyses can be done as soon as the results become available.6,7 Prospectively planned meta-analyses have the potential to reduce bias because key decisions on inclusion criteria, outcome definition and other procedures are made a priori.7 Several prospective meta-analyses have been conducted in recent years, for example in cardiology8,9 or oncology.10,11
However, the vast majority of meta-analyses are not prospectively planned. Reviewers tend to update their meta-analysis when relevant studies are published but have no direct influence over the planning of future studies. Nevertheless, after each update they need to characterize the evidence (for a particular treatment comparison and outcome) as conclusive or not, decide whether future updates of the evidence are needed and recommend the realization of further studies or not. The Cochrane Collaboration has a policy about when a systematic review should be updated.12 Updating meta-analysis (either because it is prospectively planned or because its result would be used to form a decision about conclusiveness) involves multiple tests as evidence accumulates and effect sizes are recalculated at each step, resulting in an inflated type I error.13–15 Sequential methods for standard pairwise meta-analysis have been developed to account for multiple testing and adjust nominal significance.5,16–19
For many conditions, several treatment options exist and data on their comparative effectiveness are of primary interest to clinicians. At present comparisons of one treatment with no treatment, or with placebo, continue to dominate clinical research, and head-to-head comparisons remain uncommon. Network meta-analysis (NMA) addresses this situation. Under the condition that studies are similar with respect to the variables that might modify the treatment effects, NMA can synthesize evidence from trials that form a network of interventions in a single analysis. Summary estimates of comparative effectiveness for all treatment options are thus obtained, including treatments that have not been compared directly in head-to-head comparisons.20,21 In line with recent calls for comparative evidence at the time of market authorization,22,23 Naci and O’Connor suggested the use of prospective, cumulative NMA in the regulatory setting.19 Evidence on relative effects of treatments can become conclusive even if there are no new trials that directly compare them because of new studies contributing indirect evidence.
In this article we extend ideas of sequential monitoring of trials to provide methods for updating NMAs. We argue that sequential methods are relevant in any setting where a decision is to be made based on the results of an updated meta-analysis; when future studies are to be planned based on existing meta-analytic results (prospective meta-analysis) or when decisions are made about the necessity of future updates. We introduce cumulative NMA, discuss ways to adjust for multiple testing and recommend graphical representations of the sequential NMA process. We then discuss how important outputs of NMA can be monitored when updating a NMA.
2 Illustrative example: Coronary revascularization in diabetic patients
To illustrate the methodology we use a recently published NMA evaluating the optimal revascularization technique in diabetic patients.24 The primary outcome examined is a composite of all-cause mortality, non-fatal myocardial infarction and stroke measured using odds ratio (OR). Authors combined 15 studies examining the effectiveness of three interventions; percutaneous coronary intervention with bare mental stent (BMS) or drug eluting stents (DES) and coronary artery bypass grafting (CABG). For illustration purposes we consider that NMA has been undertaken sequentially; each study included in the data as soon as it is published and the systematic reviewers have to decide, after each update, whether future updates of the NMA are necessary to provide a conclusive answer. This particular NMA was chosen because it examines few treatments and includes a substantial number of studies to ensure that methods will be easily exemplified and the sequential process will be conveniently presented. Throughout we assume that comparability between trial populations and characteristics that may act as potential effect modifiers is justified, so that the synthesis of the planned trials in a NMA model is sensible. The data set comprises 12 two-arm studies and three three-arm studies. NMA suggests that the best treatment is CABG which is significantly better than BMS (OR 0.59; 95% confidence interval 0.44 to 0.78) and marginally better than DES (OR 0.73; 95% confidence interval 0.54 to 0.98). Studies were published between 2007 and 2013 and it would be interesting to see whether significance is sustained after correcting for multiple testing and if yes, at which point in time the accumulated evidence was conclusive. Note that when updating NMA the comparison of ‘BMS versus CABG’ can become statistically significant even when ‘BMS versus DES’ studies are published via indirect comparison.
In order to undertake a sequential analysis, one needs to specify type I and type II errors, as well as the alternative hypothesis. The specification of the effect size to be detected is of crucial importance as the alternative hypothesis should express a clinically important effect reflecting the perspectives, needs and preferences of different individuals.15,25–28 However, determination of an effect that reflects patient perceptions is very challenging when the primary outcome is a composite endpoint.24 For illustrative reasons, in the remainder of the paper we will use arbitrarily (yet clinically plausible) log ORs for the three comparisons to be , , and ; these correspond to ORs of 1.32, 1.11 and 1.20, respectively. In clinical applications however, we recommend the consideration of a variety of alternative hypotheses taking into account patient preferences that may be driven by discomfort, inconvenience and risk of adverse events.28 Note that in a NMA context, the alternative treatment effects need to be consistent (e.g. here ). Particular attention is needed when more than three treatments are examined; alternative effect sizes should be determined for all comparisons in the network and consistency between them needs to be satisfied. Clinicians who suggest values for the alternative effect sizes are often asked to guess absolute effects for the various treatments. Consequently, the assumption of consistency would be satisfied in practice.
3 Methods
3.1 Cumulative NMA
Consider a network of n trials forming a set of T competing interventions for a healthcare condition. We assume that the evidence base is updated sequentially; each trial indexed with enters the analysis when its results become available. After the inclusion of each study, pairwise and NMA models are updated and cumulative treatment effects are derived. We assume that the number and timing of interim analyses are not known at the start of NMA and that updates take place after the publication of any new study that meets the inclusion criteria. The method can be generalized to NMAs that are updated after more than one studies are included.
Let be the vector of all cumulative direct relative effects for each treatment comparison after the inclusion of trial i. Vector contains the respective cumulative NMA treatment effects, derived from any appropriate statistical NMA model which integrates direct and indirect evidence and accounts for the correlation introduced by multi-arm trials.29–31 Elements of and are replaced with the addition of each study i to represent the updated treatment estimates. As evidence is accumulated and treatments are added in the evidence base, and may change dimensions to include additional treatment effects with the dimension of being equal to or smaller than the dimension of . In the last step and will contain at most treatment effects and will be denoted as and respectively; note that the dimensions of and will be exactly in a fully connected network. We may focus on each element of and or restrict ourselves to a subset of comparisons that are of more interest. Reasons to restrict the set of comparisons of interest may include the establishment of their comparative effectiveness or safety, their association with adverse events or even the withdrawal of certain treatments from the market. Consider for instance the comparison ‘Y versus X’; and denote the respective cumulative direct and NMA treatment effects with standard errors and where and i index the last study introduced. Similarly to cumulative pairwise meta-analysis, a cumulative NMA is a mechanism of displaying the cumulative NMA treatment effects along with their confidence intervals for in a table or in a plot. Each ‘Y versus X’ NMA cumulative effect is modified not only when a study comparing the particular set of treatments is performed, but also when indirect evidence that informs the ‘Y versus X’ comparison becomes available. From this point we will focus on to illustrate the sequential methodology for NMA estimates. The developments equally apply to any element of as well as to the direct cumulative estimates.
3.2 Assumptions underlying the updating of NMA
The justification of similarity in effect modifiers is important to ensure the plausibility of the transitivity assumption after each update of the network.19,20,32 Throughout, we assume that the transitivity assumption is epidemiologically evaluated and deemed reasonable. The consistency assumption is the statistical manifestation of transitivity and lies on the statistical agreement between different sources of evidence.33 A statistical test for inconsistency can be monitored as soon as its evaluation is possible, that is when a closed loop (not composed only by multi-arm trials) is formed. Large amounts of inconsistency should prohibit a joint synthesis of the data and explore the differences between the various sources of evidence. However, the power of inconsistency tests might be low even after the inclusion of several studies in NMA.34,35 In collaborative prospective NMAs inconsistency is likely to be avoided through the efforts of the researchers to ensure the comparability of the studies and maximize the chances of transitivity.
We adopt a random effects NMA model and we assume a network specific heterogeneity variance . One could re-estimate the heterogeneity variance at each step of the analysis; this process would be associated with poor estimation of heterogeneity while the number of included studies is small.36,37 To overcome this limitation we choose to inform the unknown heterogeneity parameter by predictive distributions conditional on the type of outcome and treatment comparison based on findings from previous meta-analyses.38,39 In order to account for uncertainty in the imputations of the heterogeneity parameter, we suggest the use of the 25th, the 50th and the 75th quantiles of the respective predictive distribution of heterogeneity formulated in Turner et al. (for binary outcomes) and Rhodes et al. (when continuous outcomes are assessed).38,39 Setting a priori an expected value for heterogeneity might be more appropriate in the setting of prospective meta-analysis as studies are prospectively designed and their inclusion criteria are similar. Alternative strategies for heterogeneity, such as the re-estimation of heterogeneity after a sizeable number of included studies, could be applied.
3.3 Z-score and relevant information of cumulative network estimates
The cumulative network estimate is assumed to approximately follow the normal distribution; we assume variances to be known and equal to the sampling variances, denoted as . The null hypothesis is tested using the statistic
which we refer to as z-score. It is rejected if for a two-sided test where the value is the quantile of the distribution.
Several approaches have been suggested for measuring information in pairwise meta-analysis; we adopt an approach which is directly related to the precision of the meta-analytic estimates and consequently to the amount of evidence accumulated.5,15,40,41 According to that approach the information contained within each comparison in the network can be measured as
We will conventionally refer to as the ‘amount of information’. Plotting the z-score versus the amount of information at each update i provides a visualization of the accumulation of evidence for the network estimate ‘Y versus X’.
3.4 Construction of efficacy stopping boundaries
Several methods have been proposed to control type I error in clinical trials when multiple looks at the data are taken through the construction of stopping boundaries for deciding whether or not to reject the null hypothesis. These methods include the Haybittle-Peto method, the Pocock boundaries and the O’Brien-Flemming monotone decreasing boundaries.42 Application of different stopping boundaries can lead to different conclusions regarding early stopping of a clinical trial in an interim analysis. It has been suggested that the O’Brien-Flemming method is more close to the behavior of data monitoring committees who require a great beneficial effect to stop a trial at an early stage.43 An important problem associated with standard sequential methods is the necessity to define the number of interim analyses at the beginning and the requirement of equally spaced interim analyses. These problems are handled by the introduction of alpha spending functions which extend group sequential designs to allow flexibility in the number and timing of interim analyses.44 An alpha spending function describes the rate at which the total significance level is spent at each intermediate testing; information fraction t indicates the proportion of the information that has been accumulated.
Appending efficacy boundaries to the plane can lead to a stopping framework when updating NMA. We adopt the continuous alpha spending function which resembles the O’Brien-Flemming boundaries, defined as
where Φ represents the cumulative standard normal distribution.42,44 The parameter indicates the position in the analysis regarding the accumulated information and is calculated as .
As the total amount of information that will be employed is unknown, the specification of needs to rest on assumptions. In order to specify the respective quantity in a sequential framework for pairwise meta-analysis, Wetterslev et al. assume that studies are approximating one big trial and follow conventional calculations made in sequential analysis of individual trials.41 Higgins et al. use values obtained from the O’Brien and Flemming design for specific values of the alternative effect size, type I and type II errors.15 We specify following conventional power calculations, imposing consistency between alternative effect sizes,, for all comparisons involved in the network and taking into account the multiplicity induced by multiple comparisons. Specifically, is derived as the information that would be needed in an adequately powered multi-arm trial. As involves the estimation of heterogeneity, and are also affected by the heterogeneity value. In particular, larger heterogeneity values are associated with smaller and with the respective meta-analytic estimates occupying places which are further to the left in the plane. Details on derivation of can be found in Appendix A1.
The alpha spending function is used to allocate a portion of the total a to each . The efficacy boundaries are the quantiles corresponding to . If crosses the boundaries ( the meta-analysis has reached a conclusive answer for the ‘Y versus X’ comparison. Note that even when a NMA effect estimate is deemed conclusive, indirect evidence may continue to feed into that particular comparison if the rest of the comparisons in the network do not contain sufficient evidence to infer about their conclusiveness. Similarly, a NMA effect estimate is updated and might reach conclusiveness even in the absence of trials addressing that particular comparison because of indirect evidence. A counter-intuitive situation can occur when a conclusive result becomes inconclusive in the next update. This could be the result of an important increase in heterogeneity or inconsistency leading to less precise effect estimates when data is synthesized using the random effects approach. In such situations, formal exploration and interpretation of sources of variability is required before inclusion of the new evidence in warranted updating of the network.
Figure 1 panel a presents the plane of a fictional example where nine studies are synthesized sequentially and conclusiveness is achieved after eight studies for . The plane along with the derived efficacy stopping boundaries can equivalently be presented by repeated confidence intervals on the estimates of the summary effects as .44,45 The repeated confidence interval would include 0 when . This particular representation provides the same information regarding stopping decisions while it offers the advantage of displaying the NMA stopping framework in a forest plot along with the effect estimates15 as shown in Figure 1 panel b.
Figure 1.

Panel a: Hypothetical stopping framework for efficacy and futility. Futility here means that Y will not be shown better than X by more than 0.5 effect size. Panel b: Hypothetical forest plot with repeated confidence intervals (dotted lines).
3.5 Construction of futility stopping boundaries
Future updates of NMA can be considered unnecessary when there are early signs of efficacy or because it is considered unlikely that the relative superiority of a treatment will be shown in subsequent steps of analysis. Such decisions in clinical trials are known as stopping for futility.46 Roughly, there are four major methods used to stop further experiments for futility: conditional power, predictive power—which is the analogue of conditional power in Bayesian analysis—, construction of triangular regions—also known as sequential probability ratio tests—, and beta spending functions.46–48 We choose to transfer the later method for stopping for futility in NMA because of its analogy to the alpha spending functions and its convenient visualization along with the efficacy boundaries in the plane. Note that the use of conditional power in NMA has been considered elsewhere.49
We adopt a method described by Lachin to determine futility boundaries.50 Without loss of generality we assume that positive values of represent a relative advantage of treatment Y. We consider that a study is futile if it cannot show that Y is better than X with an effect size of at least . The treatment effect parameter is an additive measure and should be defined so that it represents a clinically significant advantage of Y over X. Then, a decision to stop for futility can be specified if the upper confidence limit of the interim effect estimate does not exceed the pre-defined value . It turns out that the futility confidence limit is equivalent to the determination of a futility stopping boundary for the interim value. Then, the futility stopping rule for a relative advantage of Y over X can be expressed as
and we define the futility boundaries for Y over X on the plane as . Note that while is constant throughout the analysis, depends on the amount of information accumulated at the ith update.
The value could be set equal to employed in power calculations. Values of clinical significance should be chosen so as to satisfy consistency; that is for a triangular network that includes treatments X, Y and Z, we need to specify the respective values for only two out of the three treatment comparisons. If we specify and it turns out that the value of clinical significance for the comparison ‘Z versus Y’ is . In the hypothetical example illustrated in Figure 1 panel a we present the futility boundary for the case that we expect Y being better than X with an effect size of at least 0.5 which results to a decision of stopping for futility after the inclusion of the third study.
It has been shown that under the alternative hypothesis , stopping for futility inflates type II error.51 A common solution to this limitation is the delay in making inferences regarding stopping for futility in the updating procedure, for instance appending futility boundaries only after at least half of the total planned information has been accumulated (that is at ).50 The vertical line in Figure 1 panel a indicates this point in the analysis which is termed ‘half-information futility assessment’.
3.6 Other network characteristics to be monitored
Monitoring changes in the conclusions from NMA should be accompanied by an evaluation in changes in the inconsistency and heterogeneity (if re-estimated at each update) so as to put results into context. Investigators planning NMA should make sure that the inclusion criteria of the studies ensure their comparability and maximize the chances of transitivity and that the distribution of effect modifiers is comparable across treatment comparisons. However, even after careful planning, there is always the possibility of inconsistency in the assembled data.20,52 Thus, we consider that in each update of NMA an estimation of inconsistency is included; here, we consider the cumulative performance of the loop specific approach.53 Taking into account the low power of tests for inconsistency, we do not recommend adjusting for multiple testing.34,35 Any signs of inconsistency in interim stages should be explored and the inclusion of new evidence should be carefully reconsidered.
Monitoring changes in the treatment ranking might also be useful in particular in large networks where many treatments are compared. Probabilities for each treatment being at each possible rank can be obtained and the surface under the cumulative ranking probabilities (SUCRAs) and their equivalent P-scores or mean ranks can be illustrated in graphs.54,55 As these measures are based on the estimated summary effects at each update, their uncertainty should be expressed by the repeated confidence intervals while P-scores could be based on the adjusted p values.
4 Application
We apply our methodology to the network of trials for coronary revascularization in diabetic patients.24 Arm level data for the 15 studies along with the year of publication and the respective ORs are given in Appendix Table 1. For a ‘non-pharmacological versus any’ intervention comparison type and a semi-objective outcome a log-normal distribution for heterogeneity has been recommended corresponding to 25th, 50th and 75th quantiles , , and respectively (Appendix Figure 4).39 We adopt a significance level of and a type II error . Using the alternative effect sizes described in section 2 we estimate the maximum information needed to detect them as , , and . To derive futility boundaries we assumed values equal to the alternative effect sizes; that is we consider it is futile to continue undertaking trials if we cannot show that CABG is better than DES and BMS with log ORs and , respectively. From consistency it follows that (in favor of DES).
4.1 Description of the accumulation of evidence
When evidence is updated regularly, researchers perform both pairwise and NMA and evaluate the criteria of stopping early for efficacy or futility for both procedures. Appendix Figure 5 shows the cumulative pairwise and NMA effect estimates along with their confidence and predictive intervals after the inclusion of each study.
Figure 2 shows the stopping framework for the three evaluated comparisons in the network assuming a heterogeneity standard deviation equal to the median of the predictive distribution, .
Figure 2.

Stopping framework for efficacy (solid lines) and futility (dashed lines) for the network of coronary revascularization in diabetic patients. Maximum information is not displayed in the graphs as it is everywhere larger than 10. Heterogeneity standard deviation is assumed to be equal to the median of the predictive distribution, . Black circles indicate that the latest update comes from a study with direct evidence; blue circles indicate that the latest update comes from indirect evidence and red circles indicate that the latest update comes from a three-arm trial (both direct and indirect evidence). Stopping for efficacy is taking place if observations are outside the efficacy boundaries. The arrow on the Y-axis indicates the side of the futility boundary that suggests stopping. Conventional significance thresholds are represented with dotted lines.
While inference regarding the comparison ‘BMS versus CABG’ is inconclusive using evidence only from the four trials providing direct evidence this is not the case for the accumulated evidence from NMA. More specifically, the 13th study was conducted in December of 2012 and examined the relative effectiveness of DES compared to CABG. This study informs the comparison ‘BMS versus CABG’ indirectly leading to a conclusion that further research is not needed for that particular comparison. Note that the comparison ‘BMS versus CABG’ would have become marginally significant after the inclusion of the 12th study in an unadjusted cumulative NMA as the respective ‘z-score’ lies on the dotted boundary which represents conventional stopping. The inclusion of nearly half of the included studies rendered the ‘DES versus CABG’ comparison statistically significant in favor of DES in an unadjusted cumulative NMA; adjusting for multiple testing though, both ‘DES versus BMS’ and ‘DES versus CABG’ comparisons remain inconclusive using either pairwise meta-analysis or NMA (Figure 2).
For all three comparisons, the accumulated data do not cross the futility boundaries so no decision over stopping for futility is being made throughout the updating process of NMA or pairwise meta-analysis.
During the updating process, the inclusion of the 13th study would lead investigators to reach conclusive results about the relative effectiveness of one out of the three evaluated comparisons indicating that CABG is better than BMS. After the inclusion of 15 studies, DES would appear to have an insignificant advantage over BMS and CABG a non-statistical significant benefit over DES. As and would not have been reached, studies would continue to be performed (if the particular comparisons were still of interest).
The information regarding stopping for efficacy using results from pairwise meta-analysis or NMA given in Figure 2 can also be visualized in the form of repeated confidence intervals (Appendix Figure 6).
Assuming a 25th and 75th quantile of the predictive distribution for heterogeneity instead of the median in our calculations does not markedly change the conclusions of the stopping framework (Appendix Figure 7 and Appendix Figure 8). The influence of the 13th study continues to be pronounced in the stopping decisions. In general, greater values of heterogeneity render the repeated confidence intervals larger and consequently stopping for efficacy is less likely to occur.
Appendix Figure 9 shows the cumulative estimates of the inconsistency factor for the loop ‘DES-BMS-CABG’. It suggests that the initial inconsistency factor of 1.34 (on a logOR scale) in 2007 was decreased to 0.84 in 2009 and finally to a relatively small inconsistency factor of 0.26 in 2013. The confidence intervals become smaller as more studies are included and, although the method is underpowered, initial concerns that the network might be inconsistent are challenged.
We calculate the SUCRAs of the three treatments in each interim analysis allowing for uncertainty expressed by the repeated confidence intervals. Cumulative estimation of SUCRAs is illustrated in Figure 3. Repeated SUCRAs are relatively close to each other in the first years of the sequential NMA while their distinction is growing as evidence is accumulated.
Figure 3.

Accumulated SUCRAs for the network of coronary revascularization in diabetic patients. Heterogeneity standard deviation is assumed to be equal to the median of the predictive distribution, . SUCRA: surface under the cumulative ranking probabilities.
It is important to note that the assumptions feeding into the analysis (values for heterogeneity, type I and type II error, alternative effect sizes) may not be universally acceptable to all health-care professionals and patients. Thus, results from a sequential NMA should be interpreted in the light of such decisions. Moreover, firm recommendations on the need of further studies should take into account that new studies might be useful for the examination of a secondary outcome; indeed Tu et al. point out that although CABG seems to be better than BMS and DES in terms of the primary outcome, it is associated with an increased risk of stroke and might not be preferred for patients at high risk of such an event.24 In that case, it is even more important to avoid undertaking further trials that involve CABG because its superiority has been established and further experimentation might be deemed unethical. Instead, indirect evidence, e.g. by planning more ‘BMS versus DES’ studies, should be sought for all comparisons of interest. In general, clinical judgment considering several outcomes that might be of interest to patients is necessary to evaluate which intervention is appropriate to which patient group.
5 Discussion
We suggest formal statistical monitoring when decisions need to be made every time a ΝMA is updated. The outlined method is adopted from the respective methodologies developed for clinical trials and pairwise meta-analyses. We consider two situations in which our methodology can be appropriate; in both situations the analyses of studies are performed as their results become available. The first one is the prospective design of a NMA at the time of market entry of a new drug as suggested by Naci and O’Connor.19 In contrast to the current practice that drug approval often relies on the evaluation of each drug in placebo-controlled trials, such a procedure would feed regulatory agencies with the optimal level of evidence regarding the comparative efficacy and safety of the new drug. The establishment of designing prospective NMAs in the regulatory setting may be challenged by the potential reluctance of manufacturers to compare their treatments with all competing alternatives, which might lead to selective inclusion of pieces of evidence. Moreover, efforts to reduce the cost of performing a series of trials might lead to postponing the design of prospective NMA until a competing company has collected enough relevant evidence. Informing policy decision-making by health technologies assessments could also include an evaluation of the sufficiency of included evidence using methods described in this paper.
The second context that our method can be used in is the regular update of systematic reviews that contain multiple treatments when new trials become available. Application of the statistical monitoring is of particular interest to organizations that produce and maintain systematic reviews such as the Cochrane Collaboration. As the main aim of the Cochrane Collaboration is to provide the best available and most up-to-date evidence, authors not only prepare systematic reviews but are also committed into updating them. This commitment aims to minimize the risk of the reviews to become out-of-date and potentially misleading. Frequent updates of systematic reviews, however, can result in an inflated type I error, in a similar manner as in a genuinely prospective NMA.
Appending a stopping rule to the meta-analysis context has received considerable criticism.15,56 In particular, expressed concerns highlight the lack of direct control over the process of collecting and synthesizing studies in the sense that the meta-analyst is not in a position to decide whether more trials are to be conducted or not. We consider the formal statistical monitoring to be relevant for situations in which a researcher can have control—or at least provide recommendations—over future updates of the meta-analysis.
Our methods are similar to those proposed by Whitehead and Higgins et al. for pairwise meta-analyses, extended to the case where multiple treatments are competing.5,15 Whitehead has developed a sequential method for meta-analysis using the triangular test in a series of concurrent clinical trials and Higgins et al. focused on the restricted procedure of Whitehead, equivalent to an O’Brien and Flemming boundary.5,15 Wetterslev et al. have developed an alternative sequential method for pairwise meta-analysis41; they have also created software (www.ctu.dk/tsa) which has been largely applied in practice and they argue that their methodology should be adopted by Cochrane authors.25 Their approach has technical and conceptual similarities and dissimilarities with that proposed by Higgins et al.15,25 For instance, Wetterslev et al. adjust the required sample size by a factor that depends on the estimated heterogeneity. As estimation of heterogeneity is difficult at the beginning of the sequential process, the estimate at the final update is employed. This is something that can be feasible only on retrospective cumulative meta-analysis. Higgins et al. explores several ways to handle heterogeneity in a sequential random-effects meta-analysis approach including incorporating a prior distribution for the between-studies variance parameter. They argue in the discussion that “further empirical research is needed to characterize the degree of heterogeneity that can be anticipated in a meta-analysis with particular clinical and methodological features, so that realistic informative prior distributions can be formulated.”15 As such empirical research has been conducted since then,38,39 we here employ informative priors for the heterogeneity variance.
Whitehead suggests that the sequential procedure in meta-analysis may be more justifiable for safety outcomes while Higgins et al. propose the area of adverse effects of pharmacological interventions as a potential application of sequential methods.5,15 Whether the proposed methods work well in the context of rare events is an issue that remains to be investigated. It has been argued that when a major adverse event is rare it might be inappropriate to control over inflated type I error as even a small signal could be sufficient for the meta-analysis to ‘stop’.5 In any case, the practice of accumulating evidence in a formal way becomes even more imperative in the context of rare events.
6 Concluding remarks
The evolvement of technology can decisively contribute to the realization of living systematic reviews—the high quality, up-to-date online summaries, updated as new research become available—by providing semi-automation to the production process. The inclusion of all available treatment options in such ‘real-time’ syntheses has been termed as “live cumulative network meta-analysis” and can further facilitate informed research prioritization and decision-making.57 Development, refinement, and evaluation of appropriate statistical methodology as well as guidance over the optimal update of systematic reviews can aid the attempt of living systematic reviews and live cumulative NMA to bridge the gap between research evidence and health care practice.4
Methodology described in this paper should ideally be viewed as part of a holistic framework for strengthening existing evidence by judging when evidence summaries provide conclusive answers,28,58 planning new studies when needed27,49,58,59 and subsequently updating meta-analysis to include the—assumed justified—future studies. While methodological developments regarding parts of this process have appeared in the literature, they are rarely used in practice. In order to shift the paradigm to evidence-based research planning, methodology needs to be refined and summarized in a comprehensive global framework while its properties need to be evaluated in real world examples. The development of user-friendly software routines along with educational material could also contribute to the usefulness and applicability of the methodology.
Acknowledgements
The authors thank the reviewers for their helpful comments, which greatly improved this paper.
Appendix
A1 Specification of maximum information
We aim to specify the maximum information needed, , and consequently the required amount of evidence contained in a synthesis of a series of trials.
A1.1 Pairwise meta-analysis
The power that would be obtained in a pairwise meta-analysis using a two-sided test with information is
A common approximation claims that when the term is practically zero. Following this approximation it follows that
implying that
where zx is the x quantile of the distribution. Consequently, it holds that
Assuming , , and , it turns out . For any other values of b, a, and , the maximum information can be calculated accordingly.
Appendix Table 1.
Data of the network of coronary revascularization in diabetic patients.
| Study | Publication time | Set of treatments compared | Treatment |
Events |
Sample size |
OR (95% CI) | |||
|---|---|---|---|---|---|---|---|---|---|
| X | Y | X | Y | X | Y | ||||
| 1. Jlmenez-Quevedo | August 2007 | ‘DES vs. BMS’ | DES | BMS | 7 | 12 | 80 | 80 | 0.54 (0.20, 1.46) |
| 2. Rodriguez | September 2007 | ‘DES vs. BMS vs. CABG’ | DES | CABG | 11 | 6 | 47 | 39 | 1.68 (0.56, 5.05) |
| 2. Rodriguez | September 2007 | ‘DES vs. BMS vs. CABG’ | DES | BMS | 11 | 5 | 47 | 39 | 2.08 (0.65, 6.60) |
| 2.Rodriguez | September 2007 | ‘DES vs. BMS vs. CABG’ | BMS | CABG | 5 | 6 | 39 | 39 | 0.81 (0.22, 2.91) |
| 3. Kirtane | February 2008 | ‘DES vs. BMS’ | DES | BMS | 58 | 68 | 408 | 419 | 0.86 (0.58, 1.25) |
| 4. Maresta | June 2008 | ‘DES vs. BMS’ | DES | BMS | 14 | 16 | 75 | 75 | 0.85 (0.38, 1.89) |
| 5. Booth | July 2008 | ‘BMS vs. CABG’ | BMS | CABG | 7 | 9 | 68 | 74 | 0.83 (0.29, 2.36) |
| 6. Chan | November 2008 | ‘DES vs. BMS’ | DES | BMS | 2 | 4 | 54 | 29 | 0.24 (0.04, 1.40) |
| 7. Calxeta | September 2009 | ‘DES vs. BMS’ | DES | BMS | 40 | 37 | 195 | 233 | 1.37 (0.83, 2.24) |
| 8. Kapur | February 2010 | ‘DES vs. BMS vs. CABG’ | BMS | CABG | 13 | 26 | 82 | 248 | 1.61 (0.78, 3.30) |
| 8. Kapur | February 2010 | ‘DES vs. BMS vs. CABG’ | DES | CABG | 20 | 26 | 172 | 248 | 1.12 (0.61, 2.09) |
| 8. Kapur | February 2010 | ‘DES vs. BMS vs. CABG’ | DES | BMS | 20 | 13 | 172 | 82 | 0.70 (0.33, 1.48) |
| 9. Mauri | December 2010 | ‘DES vs. BMS’ | DES | BMS | 35 | 19 | 555 | 132 | 0.40 (0.22, 0.73) |
| 10. Onuma | March 2011 | ‘DES vs. BMS vs. CABG’ | DES | BMS | 25 | 28 | 159 | 112 | 0.56 (0.31, 1.02) |
| 10. Onuma | March 2011 | ‘DES vs. BMS vs. CABG’ | DES | CABG | 25 | 16 | 159 | 96 | 0.93 (0.47, 1.85) |
| 10. Onuma | March 2011 | ‘DES vs. BMS vs. CABG’ | BMS | CABG | 28 | 16 | 112 | 96 | 1.67 (0.84, 3.31) |
| 11. Park | May 2011 | ‘DES vs. CABG’ | DES | CABG | 12 | 9 | 102 | 90 | 1.20 (0.48, 2.30) |
| 12. Sinning | March 2012 | ‘DES vs. BMS’ | DES | BMS | 30 | 30 | 95 | 95 | 1.00 (0.54, 1.84) |
| 13. Farkouh | December 2012 | ‘DES vs. CABG’ | DES | CABG | 253 | 177 | 953 | 947 | 1.57 (1.26, 1.95) |
| 14. Kamalesh | February 2013 | ‘DES vs. CABG’ | DES | CABG | 27 | 19 | 101 | 97 | 1.50 (0.77, 2.92) |
| 15. Kappeteln | May 2013 | ‘DES vs. CABG’ | DES | CABG | 54 | 39 | 231 | 221 | 1.42 (0.90, 2.26) |
Appendix Figure 4.
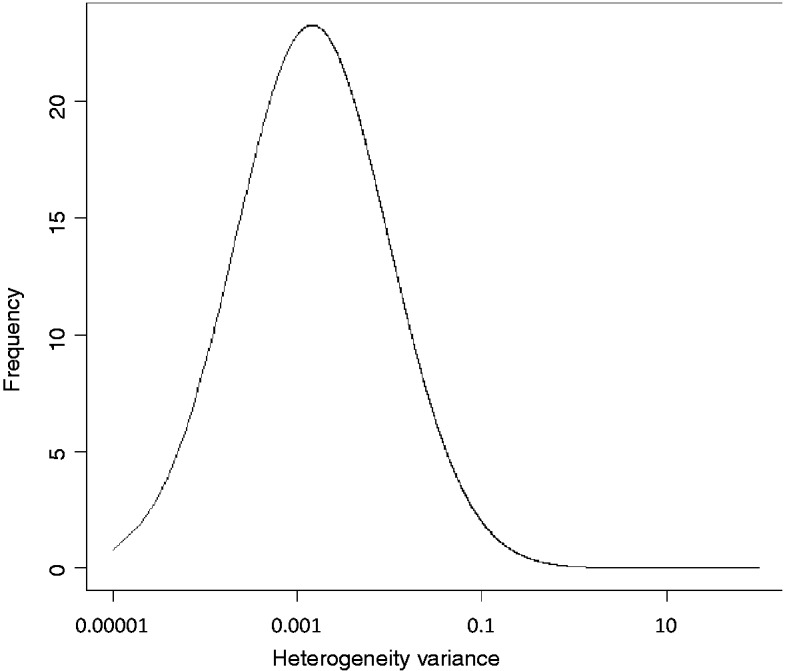
Predictive distribution (log-normal : median = ; 95% range ) for heterogeneity variance for a semi-objective outcome type and a non-pharmacological versus any intervention comparison type plotted on log scale.
A.1.2 Network meta-analysis
Specifying the required information in the NMA setting, one needs to take into account the consistency between alternative effect sizes, , and adjust the significance level to account for the fact that multiple comparisons are examined simultaneously. Thus, for a triangular network involving treatments X, Y, and Z we calculate the information needed as the information that would be needed in an adequately powered three-arm trial. We specify alternative effect sizes, , , and for comparisons ‘Y versus X’, ‘Z versus X’ and ‘Z versus Y’, respectively. It follows that the maximum information needed for each evaluated comparison is calculated as
where has been adjusted using the Bonferroni correction. The total required in the NMA is obtained as
Bonferroni correction might turn out to be conservative and other, more powerful, multiplicity adjustments could be alternatively applied.60 In special prospective NMA contexts, where there is a strong dependence between tested hypotheses, e.g. when multiple doses or different schedules of a treatment are compared, an omnibus test could be applied to test simultaneously all hypotheses of interest in the network.61,62 The way in which a formal stopping rule could be appended in an omnibus test is to be investigated. In most NMA applications, though, investigating all or a subset of comparisons of interest separately would be of more interest than making a decision of stopping or continuing the entire NMA.
A2 Monitoring using predictions
The idea of using previously available evidence to inform a statistical model falls naturally within the Bayesian philosophy.63,64 Monitoring sequential trials is considered an area of clear distinction between frequentist and Bayesian approaches and it has been said to reach “to the very foundations of the two paradigms”.65,66 Under a Bayesian perspective one can use probabilities derived from posterior distributions of the treatment effects in order to monitor clinical trials.65 For instance it might be decided to terminate a trial when the posterior probability of a treatment benefit is within a specific range. However, some argue that these probabilities should not formulate strict stopping criteria.65 This argument comes from the opinion that clinical trials can provide inferences but is unrealistic to place them in a decision theoretic context.65,67 Various Bayesian methods for monitoring trials have been proposed and could be extended to pairwise meta-analysis and NMA but have been found to have poor frequentist properties in terms of inflated type I error.68
A2.1 Application
In Appendix Figure 5, red lines with the extended dotted intervals represent the cumulative NMA effects along with their confidence and predictive intervals. The respective pairwise meta-analysis results—effects estimates, confidence, and predictive intervals—are shown in the graph as black and extended dotted lines. Predictive intervals for the three comparisons imply that in a future study, the underlying effect size might be in favor of either intervention. It should be pointed out that predictive intervals do not account for repeated updates and make strong assumptions about the comparability of new data to the existing. Therefore, their use is restricted on inference and interpretation of NMA effects and they are not constructed for guiding stopping decisions.
Appendix Figure 5.

Cumulative pairwise (black) and network meta-analysis (red) estimates for the three comparisons in the network of coronary revascularization in diabetic patients along with predictive intervals (dotted lines). Heterogeneity standard deviation is assumed to be equal to the median of the predictive distribution, . Effects are measured as log odds ratios. logOR: log odds ratio. CI: confidence interval. PrI: predictive interval.
Appendix Figure 6.

Cumulative pairwise (black) and network meta-analysis (red) estimates for the three comparisons in the network of coronary revascularization in diabetic patients along with repeated confidence intervals (dotted lines). Heterogeneity standard deviation is assumed to be equal to the median of the predictive distribution, . Exclusion of line of no effect from the repeated confidence interval suggests that the particular comparison provides conclusive evidence after adjusting for multiple testing. Effects are measured as log odds ratios and are given in Appendix Figure 5. RCI: repeated confidence intervals.
Appendix Figure 7.

Cumulative pairwise (black) and network meta-analysis (red) estimates for the three comparisons in the network of coronary revascularization in diabetic patients along with repeated confidence intervals (dotted lines). Heterogeneity standard deviation is assumed to be equal to the 25th quantile of the predictive distribution, . Exclusion of line of no effect from the repeated confidence interval suggests that the particular comparison provides conclusive evidence after adjusting for multiple testing. Effects are measured as log odds ratios and are given in Appendix Figure 5. RCI: repeated confidence intervals.
Appendix Figure 8.

Cumulative pairwise (black) and network meta-analysis (red) estimates for the three comparisons in the network of coronary revascularization in diabetic patients along with repeated confidence intervals (dotted lines). Heterogeneity standard deviation is assumed to be equal to the 75th quantile of the predictive distribution, . Exclusion of line of no effect from the repeated confidence interval suggests that the particular comparison provides conclusive evidence after adjusting for multiple testing. Effects are measured as log odds ratios and are given in Appendix Figure 5. RCI: repeated confidence intervals.
A3 Repeated confidence intervals
Inspecting the repeated confidence intervals in parallel to the sequential panel (Figure 2) is associated with several advantages. At first, instead of evaluating only statistical significance, the uncertainty surrounding stopping decisions is taken into account. Moreover, repeated confidence intervals illustrate why cumulative NMA without appropriate adjustments is not sufficient when the analysis is designed sequentially. It might be that certain comparisons are rendered statistical significant after a number of steps whereas their respective repeated confidence intervals do not support stopping decisions.
A3.1 Application
Consider the comparison ‘BMS versus CABG’ in Appendix Figure 6. Despite the fact that the NMA summary effect lies below the line of no effect favoring CABG from the 12th study, this does not imply that ‘BMS versus CABG’ trials should stop being performed as the repeated confidence interval includes zero. A formal stopping decision would be made after the inclusion of the 13th study where the repeated confidence interval is entirely below zero indicating that there is sufficient evidence to conclude against the assumption that CABG and BMS pertain to the same odds of the outcome. Similarly, the comparison ‘DES versus CABG’ is marginally significant at the end of the sequential process but the repeated confidence interval includes the line of no effect.
Appendix Figure 9.

Accumulated inconsistency plot using the loop specific approach for the network of coronary revascularization in diabetic patients. Heterogeneity standard deviation is assumed to be equal to the median of the predictive distribution, . Dotted lines indicate the latest update comes from a three-arm trial. Inconsistency factors are measured on the logOR scale. IF: inconsistency factor.
A4 Influence of accumulated studies
A feature of the analysis that may be of interest when updating NMA is the influence that each study has on the network estimates. Motivated by the calculation of the Cook’s distance for influential observations in a regression model, we define the influence function as
where is the network effect of ‘Y versus X’ before the inclusion of the i study.69 Cook’s statistics measure the influence that each study has in the estimation of the treatment effect. Their representation in a graph can give insight in the cumulative process of the meta-analytical model and help in the visualization of studies with a great influence in network estimates.
Cook’s statistics have been also used to identify outliers studies in meta-analysis.70,71 An alternative influence function has been derived by Krahn et al. to determine the impact of each direct comparison to each network estimate.72 Display of such information could be important if the evidence from a specific comparison or study is considered a potential source of inconsistency and monitoring of study influence should be presented alongside the changes in inconsistency (Appendix Figure 9).
A4.1 Application
The influence function using Cook’s distance is derived for each of the three evaluated comparisons (Appendix Figure 10). As expected, direct effects (denoted as black circles) are the most influential yielding great values and indicating that their absence might have a significant impact on the NMA effects. However, certain studies providing indirect evidence (denoted as blue circles) are also influential to the estimation of treatment effects. For instance, the 13th study informs indirectly the ‘BMS versus CABG’ comparison while its influence value is relatively not small. The 13th study is also rather influential to the ‘DES versus CABG’ NMA effect while the comparison ‘DES versus BMS’ is not substantially driven by studies providing indirect evidence.
Appendix Figure 10.

Influence measures of each study to the respective network effect sizes for the network of coronary revascularization in diabetic patients. Greater values indicate greater influence of the study effect size to the NMA effect. Heterogeneity standard deviation is assumed to be equal to the median of the predictive distribution, . Black circles indicate that the latest update comes from a study with direct evidence; blue circles indicate that the latest update comes from indirect evidence and red circles indicate that the latest update comes from a three-arm trial.
Declaration of conflicting interests
The author(s) declared no potential conflicts of interest with respect to the research, authorship, and/or publication of this article.
Funding
The author(s) disclosed receipt of the following financial support for the research, authorship, and/or publication of this article: GS received funding from a Horizon 2020 Marie-Curie Individual Fellowship (Grant no. 703254). AN, DM and ME received no financial support for this article.
References
- 1.Gould GM. The work of an association of medical librarians. 1898. Bull Med Libr Assoc 1998; 86: 223–227. [PMC free article] [PubMed] [Google Scholar]
- 2.Egger M, Smith GD, Altman DG. Systematic reviews in health care: meta-analysis in context, London: BMJ Books, 2001. [Google Scholar]
- 3.Clarke M. Doing new research? Don’t forget the old. PLoS Med 2004; 1: e35–e35. [DOI] [PMC free article] [PubMed] [Google Scholar]
- 4.Elliott JH, Turner T, Clavisi O, et al. Living systematic reviews: an emerging opportunity to narrow the evidence-practice gap. PLoS Med 2014; 11: e1001603–e1001603. [DOI] [PMC free article] [PubMed] [Google Scholar]
- 5.Whitehead A. A prospectively planned cumulative meta-analysis applied to a series of concurrent clinical trials. Stat Med 1997; 16: 2901–2913. [DOI] [PubMed] [Google Scholar]
- 6.Turok DK, Espey E, Edelman AB, et al. The methodology for developing a prospective meta-analysis in the family planning community. Trials 2011; 12: 104–104. [DOI] [PMC free article] [PubMed] [Google Scholar]
- 7.Ghersi D, Berlin JAL. Chapter 19. Prospective meta-analysis. In: Higgins JPT, Green S. (eds). Cochrane handbook for systematic reviews of interventions, Chichester: Wiley-Blackwell, 2011, pp. 559–570. [Google Scholar]
- 8.Baigent C, Keech A, Kearney PM, et al. Efficacy and safety of cholesterol-lowering treatment: prospective meta-analysis of data from 90,056 participants in 14 randomised trials of statins. Lancet 2005; 366: 1267–1278. [DOI] [PubMed] [Google Scholar]
- 9.Chen ZM, Sandercock P, Pan HC, et al. Indications for early aspirin use in acute ischemic stroke: a combined analysis of 40000 randomized patients from the chinese acute stroke trial and the international stroke trial. On behalf of the CAST and IST collaborative groups. Stroke J Cereb Circ 2000; 31: 1240–1249. [DOI] [PubMed] [Google Scholar]
- 10.Nitti D, Wils J, Dos Santos JG, et al. Randomized phase III trials of adjuvant FAMTX or FEMTX compared with surgery alone in resected gastric cancer. A combined analysis of the EORTC GI Group and the ICCG. Ann Oncol Off J Eur Soc Med Oncol ESMO 2006; 17: 262–269. [DOI] [PubMed] [Google Scholar]
- 11.Efficacy of adjuvant fluorouracil and folinic acid in colon cancer. International Multicentre Pooled Analysis of Colon Cancer Trials (IMPACT) investigators. Lancet Lond Engl 1995; 345: 939–944. [PubMed] [Google Scholar]
- 12.Takwoingi Y, Hopewell S, Tovey D, et al. A multicomponent decision tool for prioritising the updating of systematic reviews. BMJ 2013; 347: f7191–f7191. [DOI] [PubMed] [Google Scholar]
- 13.Berkey CS, Mosteller F, Lau J, et al. Uncertainty of the time of first significance in random effects cumulative meta-analysis. Control Clin Trials 1996; 17: 357–371. [DOI] [PubMed] [Google Scholar]
- 14.Borenstein M, Hedges LV, Higgins JPT, et al. Cumulative meta-analysis. In: Introduction to meta-analysis, Chichester, UK: John Wiley & Sons, Ltd, 2009, pp. 371–376. [Google Scholar]
- 15.Higgins JPT, Whitehead A, Simmonds M. Sequential methods for random-effects meta-analysis. Stat Med 2011; 30: 903–921. [DOI] [PMC free article] [PubMed] [Google Scholar]
- 16.Hu M, Cappelleri JC, Lan KKG. Applying the law of iterated logarithm to control type I error in cumulative meta-analysis of binary outcomes. Clin Trials Lond Engl 2007; 4: 329–340. [DOI] [PubMed] [Google Scholar]
- 17.Brok J, Thorlund K, Wetterslev J, et al. Apparently conclusive meta-analyses may be inconclusive—trial sequential analysis adjustment of random error risk due to repetitive testing of accumulating data in apparently conclusive neonatal meta-analyses. Int J Epidemiol 2009; 38: 287–298. [DOI] [PubMed] [Google Scholar]
- 18.Kulinskaya E, Wood J. Trial sequential methods for meta-analysis. Res Synth Methods 2014; 5: 212–220. [DOI] [PubMed] [Google Scholar]
- 19.Naci H, O’Connor AB. Assessing comparative effectiveness of new drugs before approval using prospective network meta-analyses. J Clin Epidemiol 2013; 66: 812–816. [DOI] [PubMed] [Google Scholar]
- 20.Salanti G. Indirect and mixed-treatment comparison, network, or multiple-treatments meta-analysis: many names, many benefits, many concerns for the next generation evidence synthesis tool. Res Synth Methods 2012; 3: 80–97. [DOI] [PubMed] [Google Scholar]
- 21.Caldwell DM, Ades AE, Higgins JP. Simultaneous comparison of multiple treatments: combining direct and indirect evidence. BMJ 2005; 331: 897–900. [DOI] [PMC free article] [PubMed] [Google Scholar]
- 22.Sorenson C, Naci H, Cylus J, et al. Evidence of comparative efficacy should have a formal role in European drug approvals. BMJ 2011; 343: d4849–d4849. [DOI] [PubMed] [Google Scholar]
- 23.O’Connor AB. Building comparative efficacy and tolerability into the FDA approval process. JAMA 2010; 303: 979–980. [DOI] [PubMed] [Google Scholar]
- 24.Tu B, Rich B, Labos C, et al. Coronary revascularization in diabetic patients: a systematic review and Bayesian network meta-analysis. Ann Intern Med 2014; 161: 724–732. [DOI] [PubMed] [Google Scholar]
- 25.Higgins J. COMMENT on ‘Trial sequential analysis: methods and software for cumulative metaanalyses’ by Wetterslev and colleagues. Cochrane Database Syst Rev 2012Suppl 1): 1–56. [Google Scholar]
- 26.Jennison C, Turnbull BW. Group sequential methods with applications to clinical trials, 1st edition. Boca Raton, FL: Chapman and Hall/CRC, 1999. [Google Scholar]
- 27.Roloff V, Higgins JPT, Sutton AJ. Planning future studies based on the conditional power of a meta-analysis. Stat Med 2013; 32: 11–24. [DOI] [PMC free article] [PubMed] [Google Scholar]
- 28.Ferreira ML, Herbert RD, Crowther MJ, et al. When is a further clinical trial justified? BMJ 2012; 345: e5913–e5913. [DOI] [PubMed] [Google Scholar]
- 29.Rücker G, Schwarzer G. Reduce dimension or reduce weights? Comparing two approaches to multi-arm studies in network meta-analysis. Stat Med 2014; 33: 4353–4369. [DOI] [PubMed] [Google Scholar]
- 30.Lu G, Welton NJ, Higgins JPT, et al. Linear inference for mixed treatment comparison meta-analysis: a two-stage approach. Res Synth Methods 2012; 3: 255–255. [DOI] [PubMed] [Google Scholar]
- 31.White IR, Barrett JK, Jackson D, et al. Consistency and inconsistency in network meta-analysis: model estimation using multivariate meta-regression. Res Synth Methods 2012; 3: 111–125. [DOI] [PMC free article] [PubMed] [Google Scholar]
- 32.Jansen JP, Naci H. Is network meta-analysis as valid as standard pairwise meta-analysis? It all depends on the distribution of effect modifiers. BMC Med 2013; 11: 159–159. [DOI] [PMC free article] [PubMed] [Google Scholar]
- 33.Higgins JPT, Jackson D, Barrett JK, et al. Consistency and insconsistency in network meta-analysis: concepts and models for multi-arm studies. ResSynthMeth 2012; 3: 98–110. [DOI] [PMC free article] [PubMed] [Google Scholar]
- 34.Veroniki AA, Mavridis D, Higgins JPT, et al. Characteristics of a loop of evidence that affect detection and estimation of inconsistency: a simulation study. BMC Med Res Methodol 2014; 14: 106–106. [DOI] [PMC free article] [PubMed] [Google Scholar]
- 35.Song F, Clark A, Bachmann MO, et al. Simulation evaluation of statistical properties of methods for indirect and mixed treatment comparisons. BMC Med Res Methodol 2012; 12: 138–138. [DOI] [PMC free article] [PubMed] [Google Scholar]
- 36.Riley RD, Higgins JPT, Deeks JJ. Interpretation of random effects meta-analyses. BMJ 2011; 342: d549–d549. [DOI] [PubMed] [Google Scholar]
- 37.Higgins JPT, Thompson SG, Spiegelhalter DJ. A re-evaluation of random-effects meta-analysis. J R Stat Soc Ser A Stat Soc 2009; 172: 137–159. [DOI] [PMC free article] [PubMed] [Google Scholar]
- 38.Rhodes KM, Turner RM and Higgins JPT. Predictive distributions were developed for the extent of heterogeneity in meta-analyses of continuous outcome data. J Clin Epidemiol 2015; 68: 52–60. [DOI] [PMC free article] [PubMed]
- 39.Turner RM, Davey J, Clarke MJ, et al. Predicting the extent of heterogeneity in meta-analysis, using empirical data from the Cochrane Database of Systematic Reviews. Int J Epidemiol 2012; 41: 818–827. [DOI] [PMC free article] [PubMed] [Google Scholar]
- 40.Pogue JM, Yusuf S. Cumulating evidence from randomized trials: utilizing sequential monitoring boundaries for cumulative meta-analysis. Control Clin Trials 1997; 18: 580–593. discussion 661–666. [DOI] [PubMed] [Google Scholar]
- 41.Wetterslev J, Thorlund K, Brok J, et al. Trial sequential analysis may establish when firm evidence is reached in cumulative meta-analysis. J Clin Epidemiol 2008; 61: 64–75. [DOI] [PubMed] [Google Scholar]
- 42.O’Brien PC, Fleming TR. A multiple testing procedure for clinical trials. Biometrics 1979; 35: 549–556. [PubMed] [Google Scholar]
- 43.Jihao Zhou, Glen Andrews. Alpha spending function. In: Encyclopedia of biopharmaceutical statistics. 3rd ed. Taylor & Francis, pp. 38–44.
- 44.DeMets DL, Lan KK. Interim analysis: the alpha spending function approach. Stat Med 1994; 13: 1341–1352. [DOI] [PubMed] [Google Scholar]
- 45.Jennison C, Turnbull BW. Repeated confidence intervals for group sequential clinical trials. Control Clin Trials 1984; 5: 33–45. [DOI] [PubMed] [Google Scholar]
- 46.Demets DL. Futility approaches to interim monitoring by data monitoring committees. Clin Trials Lond Engl 2006; 3: 522–529. [DOI] [PubMed] [Google Scholar]
- 47.Whitehead J. The design and analysis of sequential clinical trials. Rev. 2nd ed. Chichester and New York: J. Wiley & Sons, 1997.
- 48.Spiegelhalter DJ, Abrams KR, Myles JP. Randomised controlled trials. Bayesian approaches to clinical trials and health-care evaluation, Chichester, England: John Wiley & Sons, Ltd, 2004, pp. 181–249. [Google Scholar]
- 49.Nikolakopoulou A, Mavridis D, Salanti G. Using conditional power of network meta-analysis (NMA) to inform the design of future clinical trials. Biom J 2014; 56: 973–990. [DOI] [PubMed] [Google Scholar]
- 50.Lachin JM. Futility interim monitoring with control of type I and II error probabilities using the interim Z-value or confidence limit. Clin Trials Lond Engl 2009; 6: 565–573. [DOI] [PubMed] [Google Scholar]
- 51.Lachin JM. A review of methods for futility stopping based on conditional power. Stat Med 2005; 24: 2747–2764. [DOI] [PubMed] [Google Scholar]
- 52.Dias S, Welton NJ, Sutton AJ, et al. Evidence synthesis for decision making 4: inconsistency in networks of evidence based on randomized controlled trials. Med Decis Mak Int J Soc Med Decis Mak 2013; 33: 641–656. [DOI] [PMC free article] [PubMed] [Google Scholar]
- 53.Bucher HC, Guyatt GH, Griffith LE, et al. The results of direct and indirect treatment comparisons in meta-analysis of randomized controlled trials. J Clin Epidemiol 1997; 50: 683–691. [DOI] [PubMed] [Google Scholar]
- 54.Salanti G, Ades AE, Ioannidis JP. Graphical methods and numerical summaries for presenting results from multiple-treatment meta-analysis: an overview and tutorial. JClinEpidemiol 2011; 64: 163–171. [DOI] [PubMed] [Google Scholar]
- 55.Rücker G, Schwarzer G. Ranking treatments in frequentist network meta-analysis works without resampling methods. BMC Med Res Methodol 2015; 15: 58–58. [DOI] [PMC free article] [PubMed] [Google Scholar]
- 56.Chalmers TC, Lau J. Changes in clinical trials mandated by the advent of meta-analysis. Stat Med 1996; 15: 1263–1268; discussion 1269–1272. [DOI] [PubMed] [Google Scholar]
- 57.Créquit P, Trinquart L, Yavchitz A, et al. Wasted research when systematic reviews fail to provide a complete and up-to-date evidence synthesis: the example of lung cancer. BMC Med 2016; 14: 1–15. [DOI] [PMC free article] [PubMed] [Google Scholar]
- 58.Nikolakopoulou A, Mavridis D and Salanti G. Planning future studies based on the precision of network meta-analysis results. Stat Med 2016; 35: 978–1000. [DOI] [PubMed]
- 59.Sutton AJ, Cooper NJ, Jones DR, et al. Evidence-based sample size calculations based upon updated meta-analysis. Stat Med 2007; 26: 2479–2500. [DOI] [PubMed] [Google Scholar]
- 60.Dunnett CW, Tamhane AC. Step-down multiple tests for comparing treatments with a control in unbalanced one-way layouts. Stat Med 1991; 10: 939–947. [DOI] [PubMed] [Google Scholar]
- 61.Bender R, Lange S. Adjusting for multiple testing – when and how? J Clin Epidemiol 2001; 54: 343–349. [DOI] [PubMed] [Google Scholar]
- 62.Wason JMS, Stecher L and Mander AP. Correcting for multiple-testing in multi-arm trials: Is it necessary and is it done? Trials 2014; 15: 364. [DOI] [PMC free article] [PubMed]
- 63.Lau J, Schmid CH, Chalmers TC. Cumulative meta-analysis of clinical trials builds evidence for exemplary medical care. J Clin Epidemiol 1995; 48: 45–57; discussion 59–60. [DOI] [PubMed] [Google Scholar]
- 64.Hu M, Cappelleri JC, Lan KKG. Applying the law of iterated logarithm to control type I error in cumulative meta-analysis of binary outcomes. Clin Trials Lond Engl 2007; 4: 329–340. [DOI] [PubMed] [Google Scholar]
- 65.Etzioni RD, Kadane JB. Bayesian statistical methods in public health and medicine. Annu Rev Public Health 1995; 16: 23–41. [DOI] [PubMed] [Google Scholar]
- 66.O’Rourke K. Two cheers for Bayes. Control Clin Trials 1996; 17: 350–352. [DOI] [PubMed] [Google Scholar]
- 67.Jennison C, Turnbull BW. Group Sequential methods with applications to clinical trials, 1st ed. Boca Raton, FL: Chapman and Hall/CRC, 1999. [Google Scholar]
- 68.Cook RD, Weisberg S. Residuals and influence in regression, London: Chapman and Hall, 1982. [Google Scholar]
- 69.Mavridis D, Moustaki I, Wall M, et al. Detecting outlying studies in meta-regression models using a forward search algorithm. Res Synth Methods 2016; n/a-n/a. [DOI] [PubMed]
- 70.Viechtbauer W, Cheung MW-L. Outlier and influence diagnostics for meta-analysis. Res Synth Methods 2010; 1: 112–125. [DOI] [PubMed] [Google Scholar]
- 71.Krahn U, Binder H, König J. Visualizing inconsistency in network meta-analysis by independent path decomposition. BMC Med Res Methodol 2014; 14: 131–131. [DOI] [PMC free article] [PubMed] [Google Scholar]