

SUMMARY
Distinct subtypes of inhibitory interneuron are known to shape diverse rhythmic activities in the cortex, but how they interact to orchestrate specific band activity remains largely unknown. By recording optogenetically tagged interneurons of specific subtypes in the primary visual cortex of behaving mice, we show that spiking of somatostatin (SOM)- and parvalbumin (PV)-expressing interneurons preferentially correlates with cortical beta and gamma band oscillations, respectively. Suppression of SOM cell spiking reduces the spontaneous low-frequency band (<30-Hz) oscillations and selectively reduces visually induced enhancement of beta oscillation. In comparison, suppressing PV cell activity elevates the synchronization of spontaneous activity across a broad frequency range and further precludes visually induced changes in beta and gamma oscillations. Rhythmic activation of SOM and PV cells in the local circuit entrains resonant activity in the narrow 5- to 30-Hz band and the wide 20- to 80-Hz band, respectively. Together, these findings reveal differential and cooperative roles of SOM and PV inhibitory neurons in orchestrating specific cortical oscillations.
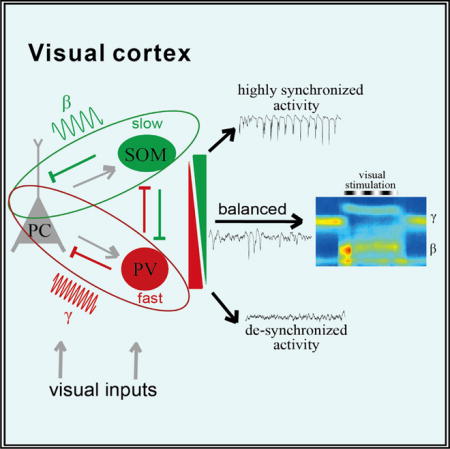
Graphical abstract
INTRODUCTION
Information processing in the brain relies on a dynamic interplay among neuronal populations with various rhythmic activities. Characteristic neuronal oscillatory activities vary profoundly across different behavioral states (Steriade et al., 1993), and they are tightly correlated with distinct sensory (Gray and Singer, 1989), motor (Sanes and Donoghue, 1993), and cognitive functions (O’Keefe and Dostrovsky, 1971; Fries et al., 2001). Abnormal or defective neuronal oscillations at specific frequency bands in certain brain areas have often been described in conjunction with human neurological or psychiatric disorders, such as Parkinson’s disease (Lalo et al., 2008) and schizophrenia (Uhlhaas and Singer, 2010).
Previous animal studies in vitro (Whittington and Traub, 2003; Bartos et al., 2007) and in vivo (Klausberger and Somogyi, 2008; Sohal et al., 2009; Cardin et al., 2009; Royer et al., 2012; Stark et al., 2013; Fukunaga et al., 2014; Siegle et al., 2014; Veit et al., 2017), together with computational modeling (Freeman, 1972; Wang and Buzsáki, 1996; Tiesinga and Sejnowski, 2009; Buzsáki and Wang, 2012), have strongly suggested that GABAergic interneurons (INs) are among the major players in generating or regulating the temporal structure of neuronal oscillation. In many brain circuits, INs exhibit a rich diversity in their molecular, morphological, and electrophysiological properties (Markram et al., 2004; Klausberger and Somogyi, 2008; Rudy et al., 2011), as well as synaptic connectivity (Pfeffer et al., 2013; Jiang et al., 2015). Although it is tempting to think that a given IN subtype governs one distinct oscillatory rhythm, such a one-to-one relationship has rarely been observed experimentally (Klausberger and Somogyi, 2008). For instance, in the hippocampus, spikes of different IN subtypes were found to lock to different phases of a particular band oscillation (Klausberger et al., 2003), and parvalbumin (PV)-expressing inhibitory neurons were found to be critically involved in the generation of both theta (4- to 8-Hz) (Buzsáki, 2002; Stark et al., 2013) and gamma (30- to 80-Hz) rhythms (Cardin et al., 2009; Sohal et al., 2009). Moreover, a recent study revealed an essential role of another major IN subtype, somatostatin (SOM)-expressing cells, in generating a narrow 20- to 40-Hz band oscillation in the neocortex (Veit et al., 2017, in which the frequency band was termed as a gamma band). Generally, it has been proposed that interplays between interconnected distinct IN subtypes and excitatory pyramidal (principal) cells (PCs) is critical for generating complex rhythmic activities (Vierling-Claassen et al., 2010; Lisman and Jensen, 2013; Womelsdorf et al., 2014), but the underlying circuitry mechanism remains largely unclear.
The mammalian primary visual cortex (V1) generates rich forms of neuronal oscillation, which are thought to underlie the processing of spatiotemporal information carried by visual inputs (Butts et al., 2007; Jurjuţ, et al., 2011). Low-frequency band (<10-Hz) oscillations could serve as temporal references for information coding (Montemurro et al., 2008; Kayser et al., 2012), whereas faster oscillations in beta and gamma frequency bands could be important for visual attention (Engel et al., 2001; Fries et al., 2001) and feature selection (Gray and Singer, 1989) or binding (Engel and Singer, 2001). These oscillatory activities have been observed in the V1 across different species, including the monkey (Livingstone, 1996; Gieselmann and Thiele, 2008), cat (Gray and Singer, 1989), and mouse (Nase et al., 2003; Niell and Stryker, 2010; Chen et al., 2015; Perrenoud et al., 2016; Saleem et al., 2017; Veit et al., 2017). In comparison to the cat and monkey, the mouse V1 has nearly the same basic visual functions, as manifested by similar receptive field structures and tunings to distinct spatial (e.g., orientation) and temporal features of visual inputs (Niell and Stryker, 2008; Huberman and Niell, 2011). Due to the availability of efficient (opto-)genetic tools for identifying and manipulating specific neuronal types in transgenic animals, mice have been widely used to elucidate differential functions of different IN subtypes in the neocortex (Markram et al., 2004; Rudy et al., 2011; Madisen et al., 2012; Roux et al., 2014).
In the rodent V1, SOM and PV neurons are two major molecularly distinct subtypes of cortical IN, and they differ substantially in their intrinsic spiking properties (Hu et al., 2011; Lazarus and Huang, 2011; Miao et al., 2016), synaptic connectivity (Markram et al., 2004; Pfeffer et al., 2013; Karnani et al., 2016), and visual functions (Ma et al., 2010; Lee et al., 2012; Wilson et al., 2012; Cottam et al., 2013; Fu et al., 2014). In the present study, we examined how cortical SOM and PV neurons are involved in orchestrating different oscillatory activities in the V1, by performing extracellular recordings of local field potentials (LFPs) as well as spikes of these cells in awake head-fixed transgenic mice genetically specific for the two IN subtypes. Our results suggest that SOM and PV cells preferentially drive low-frequency (5- to 30-Hz) and high-frequency (20- to 80-Hz) band oscillations, respectively, and that both IN subtypes are required for generating visually induced beta oscillation, where their contributions differ.
RESULTS
All electrophysiological recordings were performed in the V1 layers 2/3–4 of different transgenic mice described below. To achieve selective expression of light-activated inhibitory proton pump archaerhodopsin-3 (Arch; Chow et al., 2010) or excitatory cation channel channelrhodopsin (ChR2; Boyden et al., 2005; Li et al., 2005) in either SOM- or PV-expressing INs, Som-IRES-Cre and Pvalb-IRES-Cre transgenic mice were crossed with lines Ai35 (Rosa-CAG-LSL-ss-Arch-eGFP-ER2-WPRE), Ai27 (Rosa-CAG-LSL-ChR2(H134R)-tdTomato-WPRE), or Ai32 (Rosa-CAG-LSL-ChR2(H134R)-EYFP-WPRE). The bred mice used in this study include SOM::Ai35 (SOM-Arch), PV::Ai35 (PV-Arch), SOM::Ai27, and SOM::Ai32 (SOM-ChR2), as well as PV::Ai27 and PV::Ai32 (PV-ChR2).
Optogenetic Tagging and Manipulation of Cortical SOM and PV INs
We first performed immunohistological experiments to assess the efficiency and specificity of optogenetic protein expression in the V1 of SOM-Arch/ChR2 and PV-Arch/ChR2 mice. The results showed that, on average, more than ~70% of SOM or PV cells expressed either Arch or ChR2 (70%–95% and 60%–80%, respectively), along with high-level expression specificity in the desired IN subtypes (Figures 1A, 1C, 1E, and 1G; Figures S1A–S1F; both 11 animals for the Som-IRES-Cre and PV-IRES-Cre mice).
Figure 1. Optogenetic Manipulation and Identification of Spiking Activity of SOM and PV Cells.
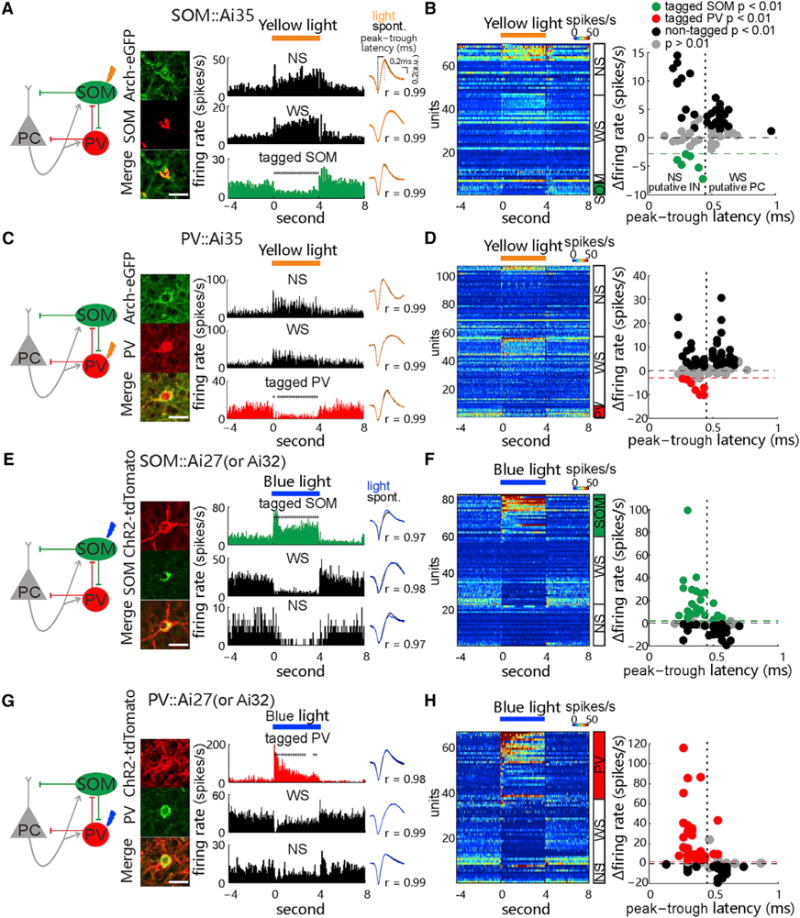
(A) Left: diagram of synaptic circuit formed by excitatory pyramidal cells (PCs) and inhibitory somatostatin (SOM)- and pavalbumin (PV)-expressing INs, with yellow arrow indicating optogenetic inactivation of SOM cells. Middle: fluorescence images show immunostained SOM cells (red) expressing Arch-EGFP (green) in the V1 of SOM::Ai35 mice. Scale bar, 20 μm. Right: peri-stimulus time histograms (PSTHs) of spike rates were recorded from the tagged SOM cell and non-tagged wide-spike (WS, putative PC) and narrow-spike cells (NS, putative IN) in the presence of 4-s 589-nm laser stimulation (30 mW, 30 repeats), with cross-comparison of spike waveforms in light off and on conditions (Pearson’s correlation value, r) in a SOM::Ai35 mouse. Asterisks: time bins showing significant rate changes (200-ms time bins; p < 0.05, Wilcoxon two-sided signed-rank test, versus baseline rate).
(B) Left: PSTHs of all recorded tagged SOM cells and non-tagged WS and NS cells, ranked by light-induced firing rate amplitudes (encoded by colors) in each cell group. Right: plot shows the firing rate changes and the peak-to-trough latency of spike waveform of all units. Units showing significant light-induced suppression of firing rates were tagged as SOM cell (n = 6 of 70 units in 19 mice; p < 0.01, permutation test; green dashed line depicts the minimum decrease of spike rate by 3 Hz). Black and gray dots represent those units showing significant increase (p < 0.01, non-tagged) and no significant change (p > 0.01) in firing rates, respectively, during laser stimulation. The peak-to-trough latency of 0.45 ms is chosen to roughly separate putative WS and NS groups.
(C and D) Similar to (A) and (B), respectively, but tests are in the PV::Ai35 mice, with 8 tagged PV cells (from 107 units in 24 mice; p < 0.01, red).
(E–H) Similar to (A)–(D) but tests are in the SOM::Ai27/Ai32 (E and F) and PV::Ai27/32 (G and H) mice, respectively, using the optogenetic tagging with activating ChR2-expressing cells by the 473-nm laser (30 mW, 4-s duration). 23 t-SOM cells (from 82 units in 12 SOM::Ai27 and 9 SOM::Ai32 mice; p < 0.01; green in F, green dashed line depicts the minimum increase of spike rate by 2 Hz) and 30 t-PV cells (from 67 units in 20 PV::Ai27 and 6 PV::Ai32 mice; p < 0.01; red in H) are identified. See also Figures S1 and S6.
In the V1 of awake head-fixed animals, we observed that yellow (589-nm) or blue (473-nm) laser pulses, applied via an optical fiber (with a core diameter of 50 μm) placed on the cortical surface and near the recording electrode (distance <200 μm), were effective in suppressing or elevating spiking activity of specific IN subtypes through the activation of Arch (Figures 1A–1D) or ChR2 (Figures 1E–1H), respectively, which is consistent with previous studies using the same transgenic mice (Madisen et al., 2012; Stark et al., 2013). Laser-induced changes in spiking activity of cortical cells were monitored by recording with a multiple-microwire array (MMA), and only those units exhibiting nearly identical waveforms during the laser “on” and “off” periods (correlation value r > 0.9) were included for further analysis (see STAR Methods and Figure 1A, right). We also categorized the recorded units into narrow-spike (NS) units (putative cortical INs; n = 162 units) and wide-spike (WS) units (mostly excitatory PCs; n = 156), based on the widely used criteria of spike waveform features: the peak-to-trough latency, the ratio of peak and trough amplitudes, and the width of half peak (Figures 1A and 1B; Figures S1H and S1I; see Barthó et al., 2004; Niell and Stryker, 2010; and Stark et al., 2013).
As shown by the example recordings from the SOM-Arch and PV-Arch mice in Figures 1A and 1C, delivery of yellow laser pulses (5–30 mW, 4-s duration, 12- to 20-s intervals) to induce the Arch-mediated hyperpolarizing currents caused similar effects on the baseline spiking activity of the recorded cells: a sustained decrease of baseline spiking rate in the light-stimulated NS cell and simultaneous increases of spiking rate in other NS and WS cells rapidly after the onset of laser stimulation (note that a significant reduction was indicated by *p < 0.05 by Wilcoxon two-sided signed-rank test). We referred to those units showing significant suppressive responses that were time-locked to laser stimulation as optogenetically tagged SOM or PV cells (t-SOM or t-PV cells; p < 0.01, permutation test, light on versus light off; see STAR Methods and Royer et al., 2012). With this opto-tagging method, we identified 6 t-SOM and 8 t-PV cells from recordings in 19 SOM-Arch and 24 PV-Arch mice, respectively, and the mean firing rate of tagged INs was reduced during laser stimulation by >3 Hz and by >25% of the baseline level (Figures 1B and 1D, green/red). The extent of laser-induced suppression of t-SOM or t-PV cells was largely the same during early and late stimulation windows (Figures S1M and S1N). We further found that laser-induced suppression of Arch-expressing SOM or PV cells was accompanied by an increase in spike rate in nearly half of the non-tagged NS and WS cells (black dots, non-tagged, p < 0.01; gray dots, p > 0.01; Figures 1B and 1D).
Similarly, based on the time-locked increase of spiking activity elicited by blue laser-induced ChR2 excitation (5–30 mW, 4-s pulses), we identified 23 t-SOM cells and 30 t-PV cells from recordings in 21 SOM-ChR2 and 26 PV-ChR2 mice (p < 0.01, with rate increase >2 Hz and >50% of the baseline level; Figures 1E–1H), respectively. Moreover, we also applied 1-ms pluses of blue laser (at 30 mW) to test the stimulus-associated spike latency (Kvitsiani et al., 2013), and we found short latencies (5.55 ± 1.61 and 4.69 ± 2.18 ms for t-SOM and t-PV, respectively) and low spike jitters (1.47 ± 0.62 ms and 1.48 ± 0.73 ms for t-SOM and t-PV, respectively) of laser-elicited spikes in ChR2-expressing SOM and PV cells (Figures 7A and 7E). The latter result further proves the reliability of opto-tagging with ChR2. Meanwhile, we also found that light activation of ChR2-expressing SOM or PV cells substantially inhibited spiking of about half of the non-tagged NS and WS cells, with comparable extents of inhibition (Figures 1E–1H). We noted that 3 of 38 t-PV cells showed wider spike waveforms, and this portion is similar to what has been reported previously (Kvitsiani et al., 2013; see STAR Methods).
Figure 7. SOM and PV Cells Preferentially Pace Narrow Low-Frequency Band and Wide High-Frequency Band Activities, Respectively.
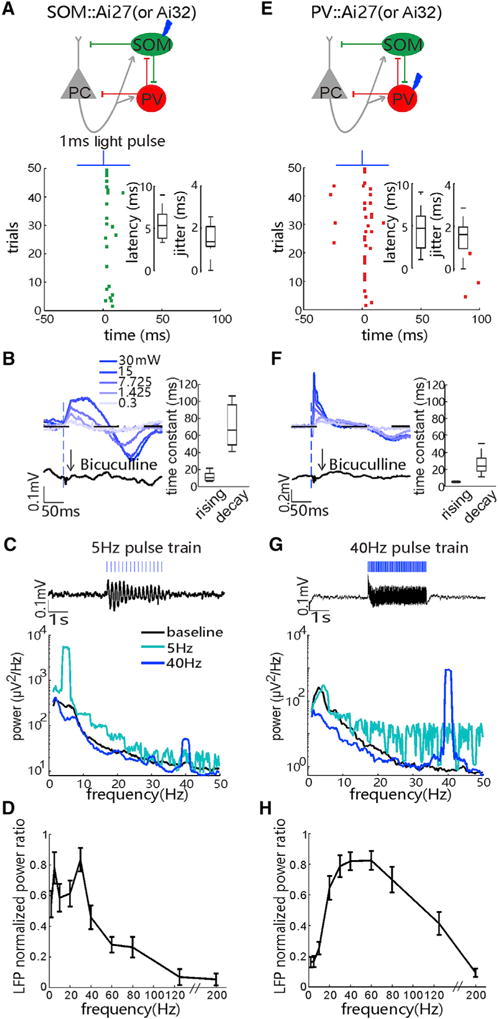
(A) Top: a circuit diagram where ChR2-expressing SOM cells are rhythmically activated by 1-ms blue laser pulses (473 nm, 30 mW). Bottom: raster plot shows evoked spikes of a tagged SOM cell in the SOM::Ai27 mouse. Insets: box-and-whisker plots of the spike latencies and jitters of laser pulse-evoked first spikes in the SOM cells are shown (n = 23 recordings in 22 mice; p < 0.01, tested by stimulus-associated spike latency test [SALT]).
(B) Raw average local field potentials (LFPs) evoked by1-ms laser pulse to activate ChR2-expressing SOM cells, with increasing laser power from 0.3 to 30 mW, and the blockade of evoked LFPs (at 30 mW) by the epipial infusion of bicuculline (GABAA receptor antagonist). Right: time constants of the rising and decay phases of evoked LFPs are shown (at 30 mW; n = 25 recordings in 7 mice).
(C) Top: trace of averaged resonant activity in LFPs under the 5-Hz stimulation of 1-ms blue laser pulses to ChR2-expressing SOM cells. Bottom: averaged power spectrum of LFPs during the baseline and the 5- and 40-Hz stimulation of laser pulses is shown.
(D) Average LFP’s power changes (powerlight/powerbaseline) induced by rhythmic activation of ChR2-expressing SOM cells with blue laser pulses at frequencies ranging from 1 to 200 Hz. Note that power values are normalized to the maximum power change in all tested frequency conditions (n = 9 recordings in 3 SOM::Ai27 and 3 SOM::Ai32 mice). Error bars, SEM.
(E–H) Similar to (A)–(D), respectively, except for the data of optogenetic activation of ChR2-expressing PV cells from the PV::Ai27 (or Ai32) mice (n = 30 PV cells in 21 mice in E; n = 12 recordings in 9 mice in F; n = 10 recordings in 7 PV::Ai27 and 2 PV::Ai32 mice in H). See also Figure S6.
Thus, we established reliable approaches to identify specific IN subtypes and manipulate their spiking activity in the V1 in vivo. Our results also indicate that cortical SOM and PV cells may reciprocally modulate their spike activity in vivo, a form of dis-inhibitory regulation in part through direct inhibitory connections between these two IN subtypes in the neocortex (Pfeffer et al., 2013; Xu et al., 2013; Miao et al., 2016).
Preferential Correlation of PV Cell Spiking with Spontaneous gamma Activity
Using the above established optogenetic approaches, we next examined how SOM and PV cells contribute to rhythmic activities in the V1. We performed MMA recording in layers 2/3–4 of awake head-fixed mice using the air-floated styrofoam ball setup shown in Figure 2A, which was used in previous studies (Dombeck et al., 2007; Niell and Stryker, 2010), including our own (Chen et al., 2015). Computer-generated visual stimuli were presented to the animal by a cathode ray tube (CRT) monitor (covering a 90 × 75-degree visual field; Figure 2A). During blank stimulation (ambient luminance of 30 cd/m2), neuronal spike rates and the power spectrogram of LFP in spontaneous activity changed characteristically when the animal started to run after a period of being stationary (determined by the relative motion speed [r.s.] calculated from consecutive video frames; Figure 2B, bottom). Population results showed that, in the running state, LFP power of the 1- to 20-Hz frequency band (peak frequency: 4.3 ± 1.7 Hz, mean ± SD) significantly decreased compared with the stationary state, while that of the 40- to 70-Hz gamma band (peak frequency: 54.4 ± 4.2 Hz) increased (n = 274 recordings in 61 mice; Figure 2C; Figures S2A and S2B). Such characteristic locomotion-induced changes of spontaneous LFPs, especially at the gamma band, are consistent with previous studies (Niell and Stryker, 2010; Chen et al., 2015; Saleem et al., 2017).
Figure 2. Stronger Correlation of PV Cell Spiking with Spontaneous gamma Oscillation.
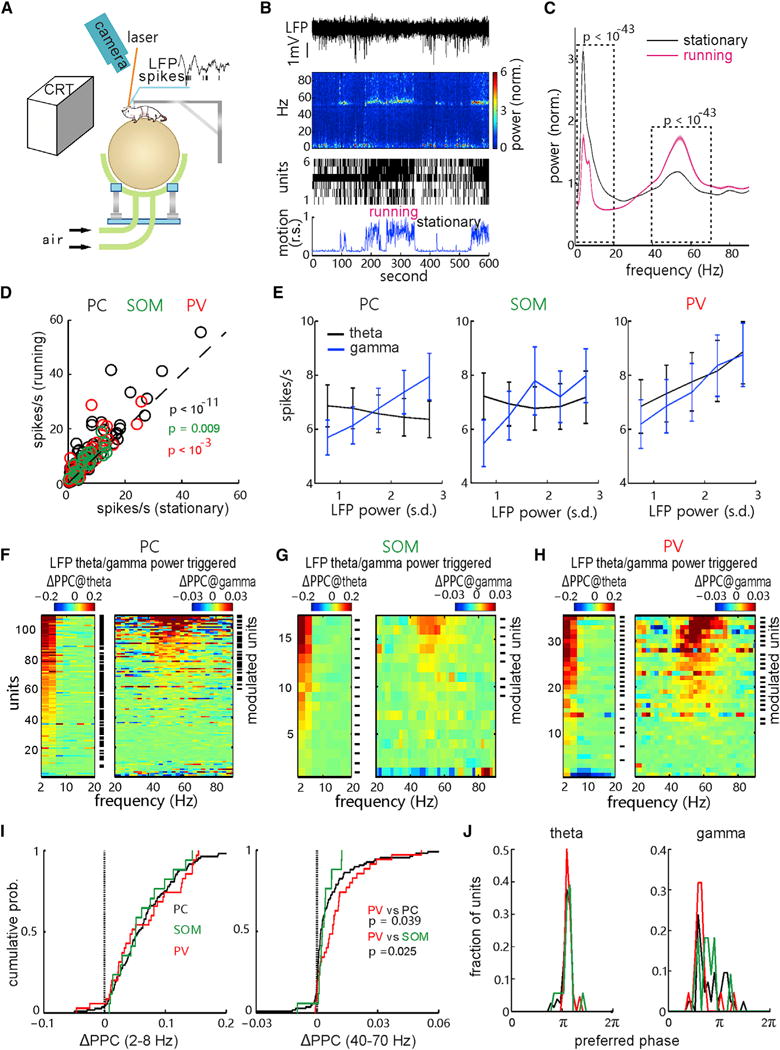
(A) A diagram depicting the head-fixed awake mouse experiment with visual stimulation, behavioral state monitoring, optical-fiber laser stimulation, and in vivo extracellular recording.
(B) Example of the complete data, including the raw local field potential (LFP), the corresponding power spectrogram (top), the raster plot of spiking units recorded simultaneously (middle), and the animal motion trace (relative speed [r.s.], bottom).
(C) Plots of mean LFP power spectrum of all recordings in the stationary and running states, respectively (n = 274 recordings in 61 mice; 1–20 Hz, p < 10−43; 40–70 Hz, p < 10−43, Wilcoxon two-sided signed-rank test, stationary versus running; shaded areas, SEM).
(D) Comparison of the spontaneous firing rates of putative PCs (WS units, black; n = 114 units in 40 mice; p < 10−11, Wilcoxon two-sided signed-rank test), t-SOM cells (green; n = 23 in 17 mice; p = 0.009), and t-PV cells (red; n = 39 in 23 mice; p < 10−3) in the stationary and running states.
(E) Correlation between the firing rates of each cell population and LFP power (normalized to SD) of theta band (2–8 Hz, black; PC, r = 0.9, p = 0.083; SOM, r = −0.3, p = 0.683; PV, r = 1, p = 0.016) or gamma band (40–70 Hz, blue; PC, r = 1, p = 0.016; SOM, r = 0.9, p = 0.083; PV, r = 1, p = 0.016, Spearman two-tailed rank correlation test; error bar, SEM).
(F–H) Changes of the spike-LFP pairwise phase consistency (PPC) of putative PCs (F), tagged SOM cells (G), or tagged PV cells (H) along with the change of spontaneous theta (2- to 8-Hz, left) or gamma (40- to 70-Hz, right) band LFP activity: ΔPPC@theta/gamma = PPCspikes with high LFP amplitude − PPCspikes with low LFP amplitude (high and low was classified by the mean). Numbers of units showing significant PPC increases in theta or gamma band (labeled by short black lines; p < 0.01, permutation test) are: 80 and 30 units from all 108 WS-PC cells (F), 17 and 9 units from all 17 t-SOM cells (G), and 25 and 21 units from all 35 t-PV cells (H).
(I) Cumulative distribution of the PPC change of the three cell populations in theta (left) and gamma (right) bands, respectively. There is no difference in the theta band PPC changes among three populations (PV versus PC, p = 0.663; PV versus SOM, p = 0.968; SOM versus PC, p = 0.967, Kolmogorov-Smirnov test; left), but there is a significant difference in the gamma band PPC changes among three populations (PV versus PC, p = 0.039; PV versus SOM, p = 0.025; SOM versus PC, p = 0.192; right).
(J) Unit count fraction distributions of recorded PCs, SOM cells, and PV cells along their preferred firing LFP theta (left) and gamma (right) phases (π represent the trough of each cycle). See also Figures S2 and S3.
We further found that the population spike rates of excitatory PCs (WS units) as well as inhibitory t-SOM and t-PV cells significantly increased during the running state compared with the stationary state (PC, p < 10−11; t-SOM, p = 0.009; t-PV, p < 0.001; Figure 2D). Interestingly, the mean spontaneous rates of PCs and t-SOM and t-PV cells were all positively correlated with gamma band LFP power, while their correlations with theta band LFP power varied: a negative correlation for PC cells, positive correlation for t-PV cells, and no significant correlation for t-SOM cells (Figure 2E). Furthermore, we calculated the spike-LFP pairwise phase consistency (PPC), a measure of phase synchronization of unit spikes to LFP (Vinck et al., 2010), and we found that a large fraction of recorded PCs (n = 80 of 108) and t-PV cells (n = 25 of 35) as well as all the recorded t-SOM cells (n = 17) exhibited significantly increased PPC in the theta band activity when the power of theta band LFP was increased (ΔPPC at theta: PPCspikes with high theta power − PPCspikes with low theta power; Figures 2F–2H, left, marked units with p < 0.01; Figures S3A–S3D). There was no significant difference in the change of PPC in the theta band among the three cell populations (Figure 2I, left). Some of the recorded PCs (n = 30 of 108), t-SOM cells (n = 9 of 17), and t-PV cells (n = 21 of 35) had significantly increased PPC in the gamma band when the power of gamma band LFP was elevated, particularly during the transition from stationary state to running state (ΔPPC in gamma; Figures 2F–2H, right, marked units with p < 0.01; Figures S3F–S3I). However, the cumulative distribution of ΔPPC in the gamma band suggested that the spiking of PV cells had a higher phase synchronization with LFP gamma activity than that of PCs and SOM cells (Figure 2I, right; PV versus PC, p = 0.039; PV versus SOM, p = 0.025, Kolmogorov-Smirnov test). Moreover, all modulated PCs, SOM cells, and PV cells preferred to fire near the trough of theta cycles (Figure 2J, left; Figure S3E), but at leftward-shifted phases of gamma activity (Figure 2J, right; Figure S3J).
All these in vivo recording results clearly indicate that PV cells tend to fire spikes more tightly correlated with locomotion-modulated spontaneous gamma activity than SOM cells or excitatory PCs in the mouse V1, while spiking of all three cell populations shows similar correlations with theta activity. These findings also support the general notion that PV cells can play a pivotal role in regulating cortical gamma oscillation (Klausberger and Somogyi, 2008; Cardin et al., 2009; Sohal et al., 2009).
Differential Correlation of Spiking of Distinct Cell Types with Visually Induced beta and gamma Activity
Our previous study (Chen et al., 2015) showed that, in the V1 of adult awake mice (wild-type), sinusoidal drifting gratings (2-s duration, spatial frequency: 0.04 cycle/degree, temporal frequency: 3 Hz) in full visual field reliably induced an elevation of beta band (20- to 40-Hz) and 65- to 80-Hz high gamma band activity but a suppression of 50- to 65-Hz baseline gamma band activity. We thus further examined how SOM and PV INs were involved in the visually induced changes of beta and gamma activities. First, in the transgenic mice, similar visually induced changes in cortical beta and gamma activities could be reliably observed in both stationary and running states: a persistent increase in the beta band activity (Δpower peaked at the frequency of 24.6 ± 6.6 Hz, mean ± SD), a reduction in the (50- to 65-Hz) baseline gamma band activity (peaked at the frequency of 57.8 ± 4.6 Hz), and an increase in the (65- to 80-Hz) high gamma band activity (peaked at the frequency of 71.4 ± 5.2 Hz) (Figures 3A and 3B; Figures S2C and S2D; total of 120 recordings in 44 transgenic mice). The visually induced increase of beta band activity was more apparent in the stationary state, while the induced suppression of baseline gamma band activity was more significant in the running state (Figure 3B). The latter observation could be attributed to a relatively higher baseline gamma band activity during the running state. Moreover, the described visually induced changes did not depend on orientations of the grating stimulus (Figure S4). Since trends in the two behavioral states were similar, we pooled the data from the two states in the following analyses (separated results for the two states are provided in Figure S5).
Figure 3. Differential Correlations between the Spiking of PCs, SOM Cells, and PV Cells with Visually Induced beta and gamma Oscillations.
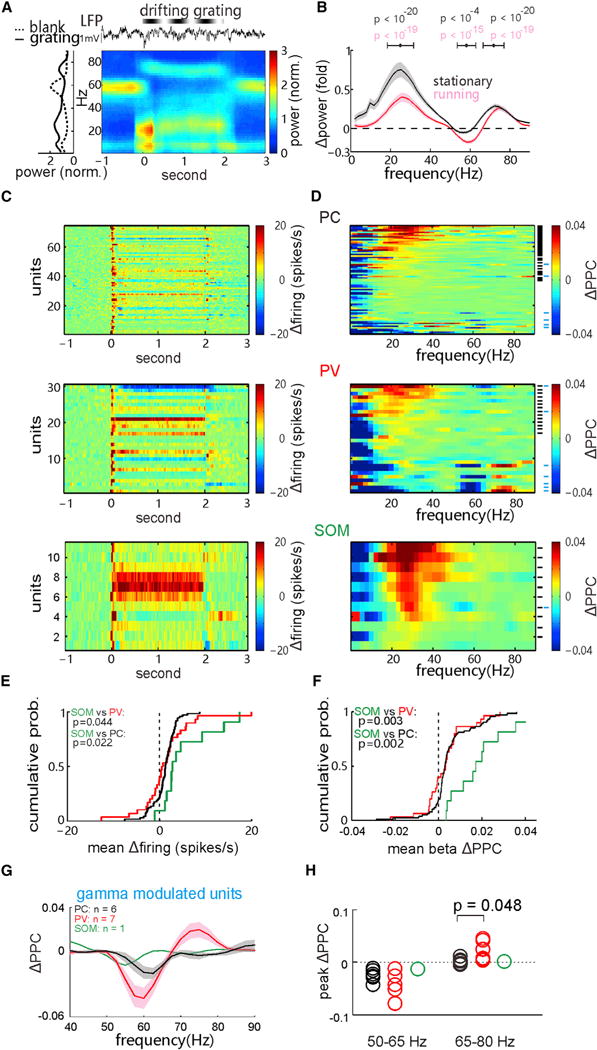
(A) Examples of the raw LFP, corresponding time-frequency spectrogram (average over trials) and the average (over time) power spectrum before and during the drifting-grating stimulation.
(B) Mean LFP power change, Δpower = (powergrating − powerblank)/powerblank, elicited by the grating stimulation in the stationary and running states, respectively (shaded area, SEM; n = 131 recording sites in 44 mice). The p values of power changes around the peak frequency in three bands, 15–40, 50–65, and 65–80 Hz were calculated by Wilcoxon two-sided signed-rank test.
(C) PSTHs of evoked firing rates (Δfiring rate − baseline mean rate) in all recorded PCs (top), tagged PV cells (middle), and tagged SOM cells (bottom).
(D) Stimulation-induced PPC changes (ΔPPC = PPCgrating − PPCblank) in the PCs (top, n = 74), tagged PV cells (middle, n = 30), and tagged SOM cells (bottom, n = 11). Short black lines, the beta-modulated cells with significant increases of induced beta band PPC (34 PCs, 14 PV cells, and 10 SOM cells; p < 0.01, permutation test); short cyan lines, the gamma-modulated cells with significant changes in induced gamma band PPC (relative to the 50- to 65-Hz gamma decrease or the 65- to 80-Hz high gamma increase, p < 0.01).
(E) Comparisons of the distribution of evoked firing rates of the PCs and tagged PV and SOM cells. The p values were calculated by Kolmogorov-Smirnov test.
(F) Cumulative distributions of mean beta band ΔPPC of the PCs and tagged PV and SOM cells.
(G) The mean ΔPPC of the gamma-modulated cells as indicated in (D) (shaded area, SEM).
(H) The peak PPC changes in the 50- to 65-Hz gamma and 65- to 80-Hz high gamma bands among the three cell populations. The p value was calculated by Kolmogorov-Smirnov test. See also Figures S2–S5.
Most of the recorded excitatory PCs (WS units, n = 74) and inhibitory t-PV cells showed grating-induced transient increases in spike rates, followed by either an increase or decrease in rate in various cells during the 2-s stimulation (Figure 3C). In contrast, nearly all t-SOM cells exhibited a consistent rate increase during stimulation (Figure 3C, bottom). Accordingly, the induced mean rate increase of t-SOM cells was highest among the three cell populations (Figure 3E). Furthermore, only about half of the recorded PCs (n = 34 of 74 units) and t-PV cells (n = 14 of 30) showed significant increases of PPC in the beta band during visual stimulation (ΔPPC = PPCgrating − PPCblank; beta-modulated units with p < 0.01 are marked by short black lines, permutation test; Figure 3D; Figures S3K, S3L, and S5 for separated states). In comparison, PPC in the beta band increased significantly in nearly all the recorded t-SOM cells (n = 10 of 11 cells; p < 0.01; Figure 3D, bottom; Figure S5). Thus, at the population level, SOM cells showed substantially larger visually induced increase of beta band PPC than PCs and PV cells (Figure 3F). These results consistently suggest that spiking of SOM cells is highly correlated with visually induced beta oscillation in the V1.
We also noted that, in several PCs (n = 6) and t-PV INs (n = 7), PPC was significantly decreased in the baseline gamma band or increased in the high gamma band (gamma-modulated units as marked by short cyan lines in Figure 3D), where the mean changes of PPC in both gamma bands were much more significant in the gamma-modulated t-PV cells than in the PCs (Figures 3G and 3H). On the other hand, only one t-SOM cell showed a slight decrease of PPC in the baseline gamma band (Figures 3D, 3G, and 3H).
Taken together, our recordings from opto-tagged IN subtypes directly demonstrate that spiking activity of SOM and PV cells is preferentially correlated with cortical beta and gamma oscillations, respectively.
Stimulus Size Dependence of SOM Cell Spiking and Cortical beta Oscillation
Because SOM cells in the V1 exhibit a distinct monotonic increase of their spike rates evoked by visual stimuli with increasing spatial sizes (Adesnik et al., 2012), we further investigated how t-SOM cells are involved in the stimulus size-dependent changes of induced beta/gamma oscillations, which were reported previously (Chen et al., 2015; Veit et al., 2017). In our in vivo recording, when increasing the overall size of the drifting-grating stimulus from 0.5× to 3× receptive field (rf), evoked spike rates of t-SOM cells consistently increased monotonically (n = 5; p = 0.002, Kruskal-Wallis ANOVA test; Figures 4A–4D, top, and Figure 4E), but that of both PCs (WS units, n = 13, p = 0.001) and other NS-INs (n = 9, p = 0.003) significantly decreased when compared with rates at the stimulus size of 1× rf (Figure 4E). Meanwhile, increasing the stimulus size also enhanced visually induced beta band activity (peak frequency: 25.6 ± 4.9 Hz, mean ± SD; p = 0.044), but it suppressed the baseline gamma band activity (peak frequency: 56.4 ± 1.9 Hz; n = 8 recordings in 8 mice; p = 0.042; Figures 4A–4D, bottom, and Figure 4F). However, there was no significant elevation of the power of induced high gamma band activity when changing the stimulus size (p = 0.502; Figure 4F, red). The corresponding changes of SOM cell-spiking activity and beta oscillation power with increasing stimulus sizes further suggest that SOM cells could be a major player in orchestrating cortical beta band activity.
Figure 4. Effects of Visual Stimulus Size on Neuronal Spiking and Oscillatory Activity.
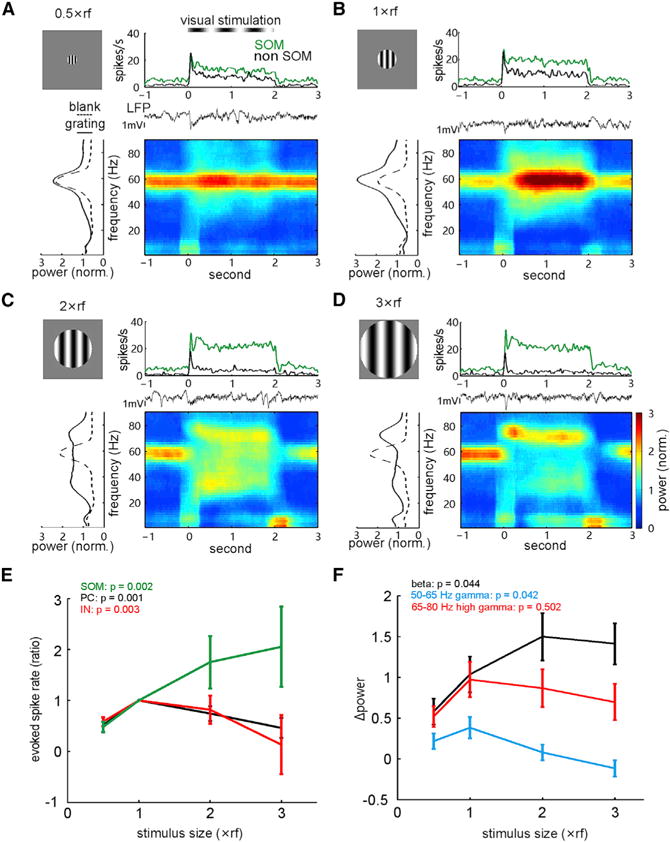
(A–D) Evoked spike rates of a tagged SOM cell and another untagged neuron as well as the LFP power spectra under the stimulation of drifting grating at 0.5× (A), 1× (B), 2× (C), and 3× (D) size of the receptive field (estimated by visually evoked potentials).
(E) Changes of the evoked mean rates (normalized to the value measured at 1× rf stimulation size) of tagged SOM cells (n = 5), putative PC-WS cells (n = 13), and IN-NS (n = 9) cells with increasing the stimulus size. Error bars, SEM.
(F) Dependence of induced changes of LFP power in beta (peak frequency, 25.6 ± 4.9 Hz), 50- to 65-Hz gamma (56.4 ± 1.9 Hz), and 65- to 80-Hz high gamma (69.3 ± 2.8 Hz) bands on stimulus size (n = 8 recording sites in 8 mice). p values were calculated by the Kruskal-Wallis ANOVA test.
Differential Effects of Inactivating SOM and PV INs on Spontaneous Cortical Dynamics
To directly test how SOM and PV cells contribute to the generation of oscillations in distinct bands in the cortex, we performed selective optogenetic inactivation of either IN subtype in pertinent transgenic mice. In SOM-Arch mice, selective suppression of SOM cells, with 4-s yellow laser pulses, substantially suppressed spontaneous low-frequency band (<30-Hz) activity, which was accompanied by a slight increase of 40- to 80-Hz gamma band activity, during both running and stationary states (Figures 5A and 5B; Figures S2E and S2F; n = 21 recordings in 7 mice). Because the effects of SOM cell inactivation were quantitatively comparable between the two behavioral states, we again pooled the data from both states in the following analyses. Suppressing SOM cells significantly reduced the coupling of theta-beta as well as theta-gamma activity (Figure 5C), as measured by the modulation index of phase-amplitude cross-frequency coupling (CFC; see STAR Methods and Canolty et al., 2006). These results indicate that spontaneous beta/gamma activity tends to de-correlate with the theta activity when inactivating local SOM cells. Accordingly, SOM cell inactivation also preferentially decreased the phase synchronization (PPC) of spiking of all three cell populations to spontaneous low-frequency (<30-Hz) band activity (Figure 5D; putative PC-WS units, n = 27; putative IN-NS units, n = 19; t-SOM cells, n = 6). Thus, all these results support an important role of SOM cells in maintaining spontaneous low-frequency band oscillations.
Figure 5. Inactivating SOM and PV Cells Differentially Regulates Spontaneous Oscillations.
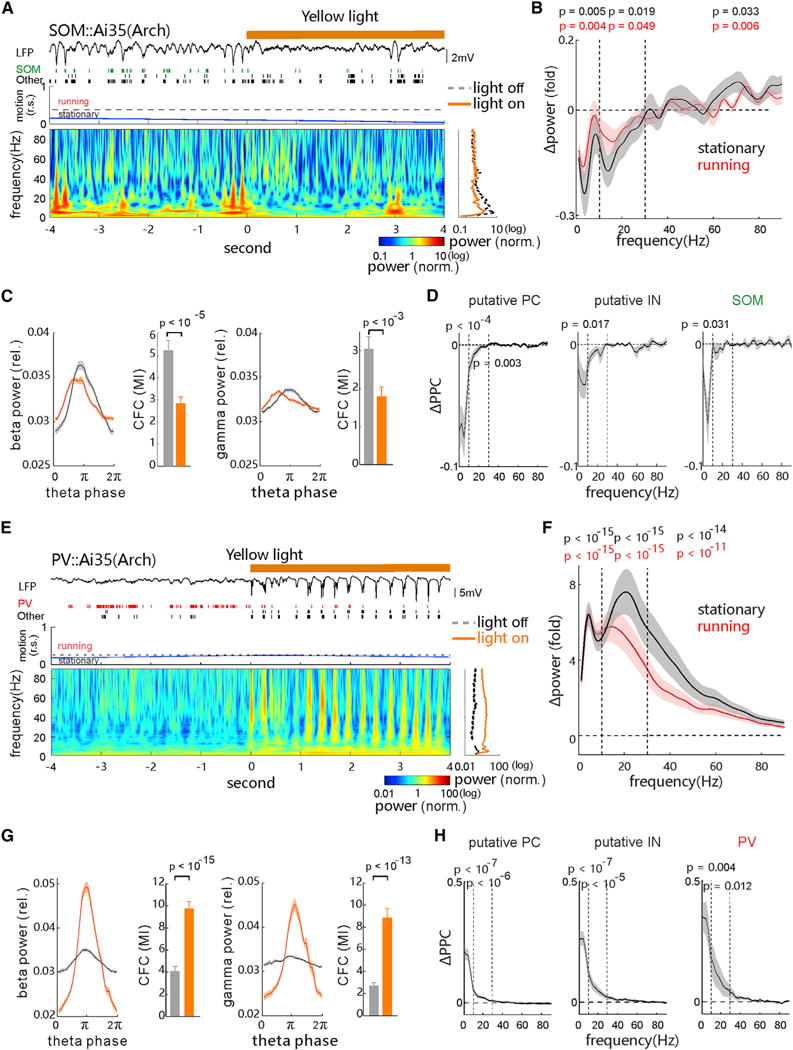
(A) Examples of spontaneous LFP trace, spike raster of t-SOM cell and other units, the animal motion trace (relative speed, r.s.; dashed line, threshold for separating stationary and running states), and the corresponding LFP’s time-frequency spectrogram aligned to the onset of 4-s yellow light (589 nm, 30 mW) in the V1 of a SOM::Ai35 mouse. Right: averaged power spectrum (over time) during the light off (black line) and on (yellow) is shown.
(B) Changes of mean LFP power over the frequency elicited during the yellow light stimulation (5–30 mW, Δpower = [powerlight on − powerlight off]/powerlight off; n = 21 recording sites in 7 mice; p values for 1–10, 10–30, and 40–80 Hz were calculated by Wilcoxon two-sided signed-rank test; black, stationary; red, running).
(C) Comparisons of beta (15- to 30-Hz, left) power, gamma (40- to 70-Hz, right) power over the theta cycle phases, and their cross-frequency coupling (CFC) strength (MI, modulation index) during the light off (gray) and on (yellow). The p values were calculated by Wilcoxon two-sided signed-rank test.
(D) Light-induced changes of spike-LFP PPC (ΔPPC = PPClight on − PPClight off) of recorded PCs (n = 27), putative NS-INs (n = 19), and t-SOM cells (n = 6), respectively. The p values in corresponding bands were calculated by Wilcoxon two-sided signed-rank test, and only those units from recording that had substantial light-induced LFP power changes are included.
(E–H) Similar to (A)–(D), respectively, except for the analysis of recorded units and LFPs from the PV::Ai35 mice (n = 119 recordings in 30 mice; PC, n = 37; IN, n = 50; t-PV cell, n = 8; 5–30 mW). All error bars and shaded areas represent SEM. See also Figures S1, S2, S6, and S7.
In PV-Arch mice, optogenetically suppressing PV cell activity during spontaneous activity resulted in increased power in a broad frequency range, more significantly in the low-frequency band (<30 Hz) (n = 119 recordings in 30 mice; Figures 5E and 5F; Figures S2G and S2H). The observed power changes during stationary and running states were similar except that the power increase in the 10–60 Hz range was slightly more pronounced in the stationary state (Figure 5F). Suppressing PV cell activity also elevated the coupling (CFC) strength of theta-beta and theta-gamma activity (Figure 5G). This might be attributed to the fact that PCs, SOM cells, and PV cells all preferentially fired spikes at the troughs of the theta cycle when PV cells were partially suppressed (Figure 5E, raw trace). Accordingly, the suppression of PV cells significantly increased the PPC of spikes of all three cell types to the low-frequency band activity (<30 Hz) (Figure 5H; PC-WS units, n = 37; IN-NS units, n = 50; t-PV cells, n = 8). Thus, these results suggest that local PV cells exert a critical role in preventing a high synchronization of neuronal spiking at low-frequency ranges, supporting the idea that PV cell activity stabilizes the network state in a regime of balanced excitation and inhibition (Haider et al., 2006; Xue et al., 2014).
Differential Roles of SOM and PV INs in Regulating Visually Induced beta and gamma Oscillations
We next examined how SOM and PV cells could differentially regulate visually induced beta and gamma oscillations. To this end, we compared the full-field grating-induced beta and gamma oscillations recorded before and during yellow laser illumination (5–30 mW, 6-s pulses) in SOM-Arch mice. Suppressing SOM cell activity selectively reduced the power increase of the beta band LFP (Δpower = [powergrating − powerblank]/powerblank; p < 10−3, compared with control without laser stimulation), but it did not affect the stimulus-induced changes observed in the baseline (50- to 65-Hz) gamma band and high (65- to 80-Hz) gamma band activity (Figures 6A and 6B). Moreover, there was a ubiquitous reduction in the strength of phase-amplitude coupling of induced beta and baseline and high gamma activities to the theta activity (Figure 6C), similar to that observed for spontaneous activity (Figure 5C). Among the beta-modulated cells (shown in Figure 3D; 12 WS-PCs and 4 NS-INs), the visually induced increase in their beta band PPC was selectively reduced by optogenetic suppression of SOM cells (Figure 6D; p = 0.003). Since very few gamma-modulated PCs or PV cells were observed in this experiment, we were unable to analyze their PPC changes in the baseline and high gamma bands. Nevertheless, the above results provide a piece of causal evidence that the spiking of SOM cells is particularly important for generating visually induced beta oscillation, but not gamma activity, in the V1.
Figure 6. Differential Regulation of Visually Induced Oscillations by SOM and PV Cells.
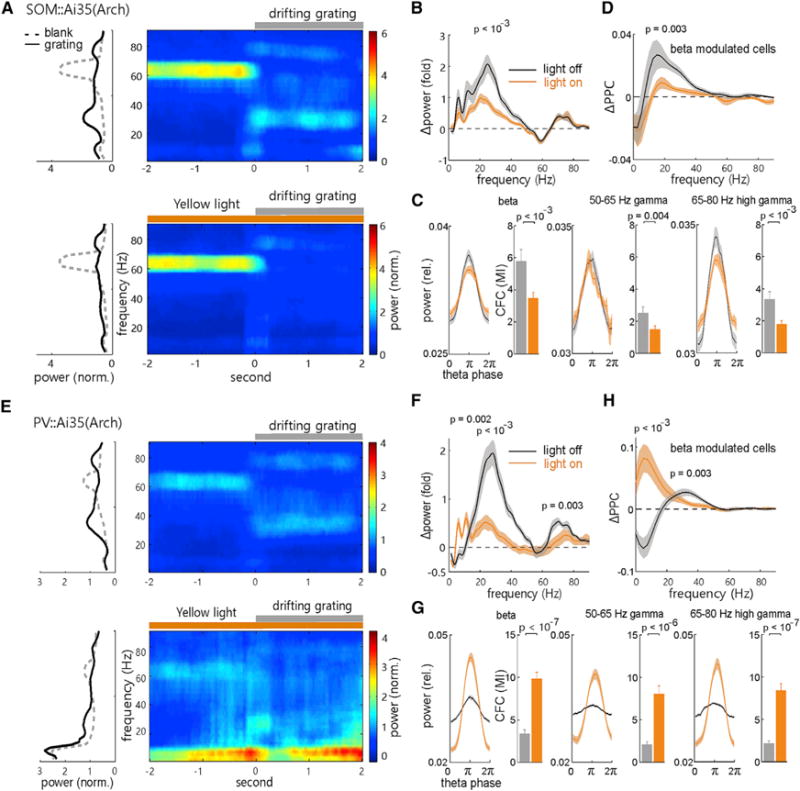
(A) Trial-averaged LFP time-frequency spectrogram (right) and the averaged (over time) power spectrum during the 2-s blank and 2-s drifting-grating stimulation (left) under the off (top) and on (bottom) of the 6-s yellow light stimulation in the V1 of a SOM::Ai35 mouse.
(B) Comparison of the visually induced mean change of LFP power spectrum during the light on (yellow) and off (black) periods. The p values for mean Δpower in the 1–10 Hz range, around the peak frequency of beta, 50- to 65-Hz baseline, and 65- to 80-Hz high gamma bands were calculated by Wilcoxon two-sided signed-rank test, respectively (n = 16 recordings in 8 mice, light off versus light on).
(C) Comparisons of mean LFP power of the beta, baseline gamma, and high gamma bands over the theta cycle phases, and their strength of cross-frequency coupling (CFC), during the light off (gray) and on (yellow) periods. The p values were calculated by Wilcoxon two-sided signed-rank test.
(D) Comparisons of the visually induced mean change of spike-LFP PPC (ΔPPC = PPCgrating − PPCblank) over the frequency in the beta-modulated cells (as labeled in Figure 3D) during the light off and light on periods. The p values were calculated by Wilcoxon two-sided signed-rank test (n = 12 PCs, 4 putative INs; light off versus light on).
(E–H) Similar to (A)–(D), respectively, except for the analysis of recorded units and LFPs from the PV::Ai35 mice (n = 12 recordings in 10 mice; PC, n = 14; putative IN, n = 6). All error bars and shaded areas represent SEM. See also Figure S2.
Optogenetic suppression of PV cells in PV-Arch mice, however, generated different effects on visually induced oscillations. First, LFP power at the low-frequency band (<10 Hz) was significantly enhanced after suppressing PV cell activity (1–10 Hz; p = 0.002, light off versus light on; n = 14 recordings in 10 mice; Figures 6E and 6F). Second, the grating-induced increase of beta power was reduced. Third, the grating-induced increase of high gamma power (peak frequency ~70 Hz) was also significantly attenuated, while the induced reduction of baseline gamma power was not affected (Figures 6E and 6F). The CFC analysis further indicated that the coupling of theta-beta, theta-baseline gamma, as well as theta- high gamma activity (Figure 6G) was increased. Accordingly, suppressing PV cell activity not only reversed the grating-induced reduction of the low-frequency band PPC (peak frequency, 5 Hz; p < 10−3) but also decreased the induced increase of beta band PPC (p = 0.003, tested around peak frequency 30 Hz, only the beta-modulated 14 WS-PCs and 6 NS-INs were compared; Figure 6H). Again, no gamma-modulated cells were observed, so gamma band ΔPPC between light off and on conditions could not be compared. Together, these results indicate that PV cells also strongly modulate visually induced beta oscillations, in addition to their well-known role in regulating spontaneous and induced gamma oscillations (Cardin et al., 2009; Sohal et al., 2009; Buzsáki and Wang, 2012; Figures 5E, 5F, 6E, and 6F).
Thus, the above results clearly suggest that cortical SOM cells are particularly important for generating visually induced beta oscillation whereas PV cells are ubiquitously involved in modulating the induced beta and high gamma activities in visual cortical circuits.
SOM and PV INs Preferentially Pace Low- and High-Frequency Band Activities, Respectively
Our above results also implicate that the spiking of cortical SOM and PV cells tends to drive low- and high-frequency band oscillations, respectively. To directly test this notion, we applied trains of blue laser pulses (30 mW, 1-ms duration, 30–50 repetitions) to rhythmically activate either cortical SOM or PV cells at frequencies ranging from 1 to 200 Hz in SOM-ChR2 or PV-ChR2 mice. LFP and spike units were simultaneously recorded with a glass micropipette (to avoid the known photoelectric artifacts when using metal electrodes, see Han et al., 2009). In SOM::ChR2 mice, single-laser pulses reliably drove ChR2-expressing SOM cells to fire spikes that faithfully time-locked to the laser pulses (median latency = 5.3 ms, median spike jitter = 1.4 ms; Figure 7A). Besides that, single pulses also elicited a slow LFP response (median rising and decay times of 10.5 and 66.3 ms, respectively; Figure 7B; Figures S6C and S6F). The evoked LFP amplitudes were dependent on the laser power and could be fully blocked by a specific GABAA receptor antagonist bicuculline (5 mM, applied via epipia infusion; Figure 7B). This result indicated that transient activation of ChR2-expressing SOM cells could elicit a slow inhibition in local circuits of the V1. As shown by an example recording in Figure 7C, applying the laser pulses at 5 or 40 Hz generated resonant LFPs whose power peaked at 5 or 40 Hz (relative to the baseline), respectively. By testing various frequencies up to 200 Hz, we found that rhythmically activating SOM cells was most effective in producing resonant circuit activities in the 5–30 Hz range (Figure 7D; Figures S6C and S6F; note the use of normalized power for each activation frequency).
In PV-ChR2 mice, single 1-ms laser pulses also reliably elicited spikes of ChR2-expressing PV cells immediately after each laser pulse (median spike latency = 4.7 ms, median jitter = 1.6 ms; Figure 7E). In contrast to SOM cell activation, transient activation of PV cells generated faster inhibition-dependent LFP responses (median rising time = 5.8 ms; median decay time constant = 23.5 ms; also blocked by bicuculline; Figure 7F; Figures S6I and S6L). Moreover, rhythmic activation of PV cells at various frequencies up to 200 Hz most effectively drove resonant LFP activity in the 20–80 Hz range, which was significantly broader and at a higher frequency band than that driven by the rhythmic activation of SOM cells (Figures 7G and 7H; Figures S6I and S6L). The frequency range of PV cell-driven cortical LFPs in awake mice is comparable to that previously reported in anesthetized mice (Cardin et al., 2009).
Thus, by systematically comparing the resonant LFPs driven by rhythmic activation of cortical SOM or PV cells, we demonstrate that these two local inhibitory cell populations preferentially entrain the narrow low-frequency (5- to 30-Hz) and wide high-frequency (20- to 80-Hz) oscillations in the V1, respectively.
DISCUSSION
By recording specific subtypes of IN and manipulating their spiking activity in the neocortex of awake mice, we have revealed the differential and cooperative actions of inhibitory SOM and PV cells in driving cortical beta and gamma oscillations. Spiking of SOM cells is particularly responsible for spontaneous low-frequency band activity and visually induced beta oscillation in a stimulus size-dependent manner, while that of PV cells mainly drives gamma activity. These functions of the two IN subtypes are similar in either the running or stationary state. Moreover, PV cells are also important for maintaining a dynamic network activity balance to enhance the signal-to-noise ratio (SNR) of visually induced cortical beta and gamma activity. Given the existence of direct or indirect connections between cortical SOM and PV cells, our findings could provide a circuit mechanism by which the two local INs interact to exert distinct and coordinated functions in orchestrating cortical oscillations.
It has been shown that the dynamics of cortical activity and sensory functions are strongly dependent on the brain state (Steriade et al., 1993; Haider et al., 2013; Niell and Stryker, 2010; Fu et al., 2014; Polack et al., 2013). In the present study using awake mice, we show that neuronal oscillations at theta (2- to 8-Hz) and gamma (40- to 70-Hz) bands are predominant in spontaneous LFPs in the V1 and are modulated by behavioral state. A locomotion-dependent augmentation of cortical gamma oscillation was previously observed in non-anesthetized mice (Niell and Stryker, 2010; Chen et al., 2015). Additionally, we show that full-field (~75-degree) grating stimulation induces characteristic changes of cortical dynamics, including a substantial increase in beta activity (20–40 Hz) and an apparent reduction in the baseline gamma (50- to 65-Hz) and a slight increase in the high gamma (65- to 80-Hz) activity (Figure 3). The induced changes in beta and baseline gamma bands have been consistently observed in the V1 of awake mice (Niell and Stryker, 2010; Saleem et al., 2017; Veit et al., 2017, where the beta activity was termed as low gamma activity). However, in these previous studies, the augmented high gamma activity during visual stimulation was not clearly observed. Moreover, in anesthetized mice, visually induced changes of cortical dynamics were evident only for beta (20- to 30-Hz) or low gamma (30- to 50-Hz) oscillations, but not for high gamma activity (Welle, 2010; Nase et al., 2003).
Recent studies suggested that origins of cortical baseline and high gamma activities could be the visual thalamus (Saleem et al., 2017) and local cortex (Chen et al., 2015), respectively. This notion is supported by our finding that cortical PV cells differentially regulate these two specific gamma band activities (Figure 6F). However, visually induced changes of both cortical beta and high gamma activities have rarely been observed in higher mammals, including the cat (Gray and Singer, 1989) and monkey (Livingstone, 1996; Gieselmann and Thiele, 2008). In the cat or monkey V1, induced oscillatory activity is often in a wide gamma range (30–80 Hz), and its power and peak frequency are modulated by visual input features, such as orientation (Gray and Singer, 1989), contrast (Ray and Maunsell, 2010), and spatial size (Gieselmann and Thiele, 2008; Zhang and Li, 2013), as well as by the top-down attentional signals (Engel et al., 2001). In agreement with the dependence on spatial size, we also observed that larger size gratings (at 2× or 3× rf size) enhanced cortical oscillations at separate beta and gamma bands, while smaller size gratings (0.5× or 1× rf) increased the wide gamma band (30- to 80-Hz) activity (Figure 4). We note that other studies in higher mammals and rodents used different sizes of visual stimuli (Gray and Singer, 1989; Gieselmann and Thiele, 2008; Zhang and Li, 2013; Chen et al., 2015; Vinck and Bosman, 2016). As such, a future comparative study is necessary to clearly understand whether specific patterns of induced oscillations in the V1 are more dependent on the stimulus feature or species.
Accumulating evidence has suggested that, among different subtypes of cortical INs, the SOM cell tends to transmit slow signals due to its distinctive intrinsic properties: relatively wide spikes, slow membrane time constants, and slow and weak inhibitory outputs with strong short-term facilitation (Beierlein et al., 2003; Hu et al., 2011; Lazarus and Huang, 2011; Kvitsiani et al., 2013; Miao et al., 2016). Consistently, we showed in the present study that a phasic activation of SOM cells produced a slow inhibitory field potential (Figure 7B). The latter slow inhibitory response may partially account for their preferential entrainment in the 5- to 30-Hz frequency range (Figure 7D), and it may suggest an important role of SOM cells in the regulation of spontaneous low-frequency band activity (Figures 2 and 5). A recent study (Veit et al., 2017) and the present study both provide direct evidence that local SOM cells are particularly important for the generation of a visually induced, size-dependent oscillation in a 15- to 40-Hz band (peak frequency at 20–30 Hz), despite that the different terminologies of gamma versus beta band were used (Figures 3 and 6). Our study provides additional in vivo evidence for correlative increases of evoked spike rate of SOM cells and induced beta activity along with increasing stimulus sizes (Figure 4). Moreover, because SOM cells form inhibitory synapses on apical dendrites of PCs (Markram et al., 2004), functionally they are thought to facilitate the spatial summation or feature integration of visual inputs (Adesnik et al., 2012), possibly through switching from rate-coding (by exerting the surround suppression) to temporal-coding (by enhancing the PC spiking synchronization in the beta range and across relatively wide cortical areas; see Veit et al., 2017) strategies.
Although PV cells tend to transmit fast signals (Figure 7; Beierlein et al., 2003; Hu et al., 2011; Lazarus and Huang, 2011; Kvitsiani et al., 2013; Miao et al., 2016) and generate cortical gamma band activity (Figures 2, 3, 4, 5, 6, and 7; Cardin et al., 2009; Sohal et al., 2009; Buzsáki and Wang, 2012), our results directly suggest that cortical PV cells also strongly modulate low-frequency band activity, including the induced beta oscillation. Suppressing PV cell activity could result in exceptionally synchronized spontaneous activities across a broad frequency band (most significant in the frequencies <30 Hz) and in the strength of cross-frequency coupling between theta activity and beta/gamma activity (Figure 5). The highly synchronized activity that emerged after the suppression of cortical PV cells resembles a mild local seizure, and it is reminiscent of the known role of local PV cells in gating the propagation of seizure activity (Cammarota et al., 2013). Such seizure-like activity was not observed when SOM cell activity was suppressed in our experiments. Interestingly, our results also indicate that the emergence of seizure-like activity does not reduce the absolute LFP power in the beta band, but it significantly reduces the grating-induced increase of beta band power (Figure 6). In accordance with these findings, PV cells are thought to play an important role in stabilizing the local network in an excitation and inhibition-balanced regime through their perisomatic fast/shunting inhibition (Haider et al., 2006; Xue et al., 2014; Borg-Graham et al., 1998; Zhang et al., 2013), therefore establishing a basis for the visual induction of beta and gamma oscillations (Figures 3 and 6). Moreover, it is worth noting that cortical PV cells show differential changes in their spiking phase synchronization (PPC) to the induced beta and gamma activity (Figure 3), suggesting that there could be functionally distinct subgroups in the molecularly identified PV cell population.
Unlike the PV cell, cortical SOM cells rarely form self-inhibitory synapses between each other, instead sending their inhibitory output to other IN subtypes, including PV cells, thus forming dis-inhibitory synapses (Pfeffer et al., 2013; Miao et al., 2016). Our simultaneous in vivo recordings of t-SOM or t-PV cells with other non-tagged putative INs (NS units) suggest a reciprocal regulation between SOM and PV cells in the V1 (Figure 1). This regulation may cause the observed modulation on spontaneous or visually induced beta and gamma activity by these two IN subtypes (Figures 5 and 6). Recent studies have also suggested that, in local neocortical circuits, a population of vasoactive intestinal peptide (VIP)-expressing INs, which preferentially innervate neighboring INs rather than excitatory PCs (Pfeffer et al., 2013; Kepecs and Fishell, 2014), provides major dis-inhibitory input to SOM and PV cells. Recent studies suggested that, in the V1, VIP cells were major recipients of afferent behavior-related modulatory inputs and mediated modulations of ongoing gamma activity as well as gain of visual responses by locomotion, primarily through the above dis-inhibitory circuit (Niell and Stryker, 2010; Polack et al., 2013; Fu et al., 2014). Thus, it is likely that this neocortical dis-inhibitory circuit could be fundamental for the regulation of cortical activity dynamics, but how it contributes remains to be further examined in future studies.
In conclusion, we demonstrate that SOM and PV INs preferentially drive slow and fast oscillations in the sensory cortex, respectively, and shape the sensory input-induced beta and gamma activities cooperatively. The balance of inhibition mediated by these two IN populations is important for maintaining normal cortical dynamics. Our findings provide a detailed cellular mechanism for the generation or regulation of cortical beta and gamma oscillations specifically. Because the emergence of beta-gamma oscillations in the V1 is dependent on both sensory inputs (Gieselmann and Thiele, 2008; Ray and Maunsell, 2010; Zhang and Li, 2013) and modulation from higher cortices (Fries et al., 2001; Engel et al., 2001), our findings may offer a circuit basis for understanding how the bottom-up and top-down signals interact to control the cortical dynamics that underlie visual perception and behaviors.
STAR★METHODS
KEY RESOURCES TABLE
| REAGENT or RESOURCE | SOURCE | IDENTIFIER |
|---|---|---|
| Antibodies | ||
| Goat IgG anti-Somatostatin (SOM) | Santa Cruz | RRID:AB_2302603 |
| Rabbit IgG anti-Parvalbumin (PV) | Swant | RRID: AB_10000344 |
| Alexa Fluor 488 Donkey anti Rabbit or Goat IgG | Thermo Fisher Scientific | RRID:AB_2535792 |
| Alexa Fluor 594 Donkey anti Rabbit or Goat IgG | Thermo Fisher Scientific | RRID: AB_2534102 |
| Alexa Fluor 594 Donkey anti-Rabbit IgG | Thermo Fisher Scientific | RRID:AB_141637 |
| Alexa Fluor 594 Donkey anti-Goat IgG | Thermo Fisher Scientific | RRID:AB_2534105 |
| Chemicals | ||
| Isoflurane | RWD Life Science | R510-22 |
| Bicuculline Methobromide | Tocris | Cat. No. 0109/10 |
| Cyanoacrylate adhesives | Sigma-Aldrich | Z105902 |
| Kwik-Sil | WPI Inc | Item#: KWIK-SIL |
| Experimental Models: Organisms/Strains | ||
| Mouse: Ai35 | Jackson Laboratory | Jax No. 012735 |
| Mouse: Ai32 | Jackson Laboratory | Jax No. 012569 |
| Mouse: Ai27 | Jackson Laboratory | Jax No. 012567 |
| Mouse: SOM(SST)-Cre | Jackson Laboratory | Jax No. 013044 |
| Mouse: PV-Cre | Jackson Laboratory | Jax No. 008069 |
| Software and Algorithms | ||
| MATLAB 2015b | Mathworks | |
| Offline Sorter | Plexon | |
| Other | ||
| Ni-Cr alloy microwires | California Fine Wire | CFW 100188 |
| Tungsten wires | California Fine Wire | CFW 100211 |
| CerebusT M Data Acquisition System | Blackrock Microsystems | |
| Multclamp 700B | Molecular Devices | |
| Laser (473/589 nm) | Changchun Industry Laser | |
| Laser shutter | Lambda Photometrics | SRS474 |
| Master 8 | A.M.P.I. | |
CONTACT FOR REAGENT AND RESOURCE SHARING
Further information and requests for reagents may be directed to and will be fulfilled by the Lead Contact, Dr. Xiaohui Zhang (xhzhang@bnu.edu.cn).
EXPERIMENTAL MODEL AND SUBJECT DETAILS
All experiments were performed in accordance with protocols approved by the Animal Research Advisory Committee of State Key Laboratory of Cognitive Neuroscience & Learning at Beijing Normal University (IACUC-BNUNKLCNL-2013-10) and Institute of Neuroscience, Chinese Academy of Sciences (Ref. NO. NA-100418). Different types of transgenic mice at ages of 2–8 months (no preference on the animal sex) were used in the present study. Three optogenetic-tool knock-in lines were used in our study: Ai35 (Rosa-CAG-LSL-ssArch-eGFP-ER2-WPRE; Jackson Laboratory, Jax No. 012735), Ai27 (Rosa-CAG-LSL-ChR2(H134R)-tdTomato-WPRE; Jax No. 012567) and Ai32 (Rosa-CAG-LSL-ChR2(H134R)-EYFP-WPRE; Jax No. 012569; Madisen et al., 2012). The first one is engineered for high level and Cre-dependent transgenic expression of yellow light-activated proton pump archaerhodopsin-3 (Arch, see ref. Chow et al., 2010) and the last two are for expression of blue light-activated cation channel channelrhodopsin (ChR2, see refs. Boyden et al., 2005; Li et al., 2005). Interneuronal subtype-specific expression of Arch or ChR2 was achieved by crossing these three optogenetic tool lines with the Som-IRES-Cre (by J. Z. Huang at CSHL; Jax No. 013044) and Pvalb-IRES-Cre (by S Arbor at FMI, Jax No. 008069) lines, respectively, to generate six types of transgenic mice: SOM::Ai35 (SOM-Arch), PV::Ai35 (PV-Arch), SOM::Ai27 or Ai32 (SOM-ChR2) and PV::Ai27 or Ai32 (PV-ChR2). All transgenic mice belong to the C57BL/6J strain and were reared on a 12/12 hr light/dark cycle to the adult age. In total, 25 SOM::Ai35, 13 SOM::Ai27 and 12 SOM::Ai32 transgenic mice were used to optogenetically inactivate or activate cortical inhibitory SOM cells in the V1. Another 30 PV::Ai35, 20 PV::Ai27 and 8 PV::Ai32 mice were used to inactivate or activate cortical PV cells.
METHOD DETAILS
Surgery
Prior to electrophysiological recording, the animal was anesthetized by the inhalation of isoflurane (1%–3% in oxygen) and then implanted a stainless-steel head-plate with dental acrylic as described in the previous study (Chen et al., 2015). Animal was then allowed to recover and habituate to our spherical treadmill setup (Chen et al., 2015). After 2–3 training sessions (10–15 min per each), the animal quickly learned to stand still, run and even to occasionally groom. On the day of recording, the animal was anesthetized with isoflurane and restrained in a stereotaxic apparatus again. Body temperature was kept at 37°C by a homeostatically controlled heating pad (RWD Life Science). A craniotomy (0.5–1 mm in diameter) was made over the primary visual cortex (~3 mm lateral lambda). The brain surface was covered with 1.2% low melting temperature agarose (Sigma) in saline, and then the head-plate opening was again filled with silicone elastomer (Kwik-Sil, WPI). After the surgery, the animal was allowed to recover from the anesthesia for 1–2 hours before the recording on the treadmill setup. The dura was removed immediately before the insertion of recording electrodes.
in vivo electrophysiology
Local field potentials (LFPs) and spikes were recorded mostly from the layers 2–4 neurons (about 200–500 μm below the cortical surface) in the V1 with the custom-made electrode array, which composed of one to six tetrodes, or stereotrodes, or single-electrodes (impedance 0.2–0.5 MΩ) spaced by 200–300 μm intervals. The tetrode or stereotrode was constructed by twisting together 4 or 2 tungsten wires (0.0005″ diameter, California Fine Wire Company, CFW 100211). The Ni-Cr alloy microwires in 0.0013″ or 0.001″ diameter (California Fine Wire Company, Stablohm 675, CFW 100188) were used for making the single-electrodes. In addition to using the uncoated stainless steel wire inserted in the V1 as a common reference, another reference electrode (same as the recording electrode) in agarose was connected to the tissue 1–2 mm above the V1 surface to further reduce the background noise. For recording the laser light pulses-evoked LFP resonant activity (Figure 7), a glass micropipette, filled with the normal saline (2–5 MΩ), was used to avoid the potential transient photoelectric noise (Han et al., 2009). To maximally reduce the artifact of the line noise (50 Hz), the electrode headstage and adaptor were wrapped with tin foil and grounded.
Electric signals from metal wire electrodes were recorded by the CerebusT M Data Acquisition System (Blackrock Microsystems), while that recorded by the glass micropipette were first amplified by the amplifier Multi-Clamp 700B (Molecular Devices) and then transferred to the CerebusTM system. LFPs were band-pass filtered in the range of 1–500 Hz and sampled at 2 kHz. Spiking signals were band-pass filtered in the range of 250–7500 Hz and sampled at 30 kHz. For the spike detection, the signal threshold was set at about 6 times of the noise level (root mean square: RMS). LFPs and spikes were saved to the computer hard-disk for further offline analysis.
Behavior monitoring
The behavior of the animal on the spherical treadmill setup was captured (25 frames/s) by a digital camera above it. The relative speed (r.s., in arbitrary unit) of the animal motion was estimated based on the pixels’ luminance intensity changes of consecutive video frames (down sample to 5 frames/s). The animal’s behavior states were classified to stationary and running states, during which the values of r.s. were less and larger than the global mean value, respectively. Details of the calculation were described in our previous study (Chen et al., 2015).
Visual stimulation
Visual stimuli were generated with a PC computer containing a NVIDIA GeForce GT430 graphics board and displayed on a cathode-ray tube (CRT) monitor (Sony CPD-G520, 40.5 × 30.5 cm, 800 × 600 resolution, refresh rate 120 Hz, mean luminance 30 cd/m2) placed ~20 cm in front of the animal (covering 90°× 75° of the visual field) and centered on its midline. Luminance non-linearities were gamma corrected. We mapped the receptive fields (rf) using sparse 2D noise stimuli, in which a white square was flashed on a black background at each of the 8 × 8 positions in a pseudorandom sequence. After the mapping of receptive fields, we slightly modified the position of the monitor to make sure the receptive fields were located at the center of it. Full-field standard sinusoidal drifting gratings (covering ~75° visual angle, 100% contrast, 0.04 cycles per degree, temporal frequency 3 Hz, 2 s per trial, inter-stimulus interval ~2 s, gray blank with mean luminance) were presented at 12 directions (separated by 30°) in a pseudorandom sequence (12 repetitions for each direction) to characterize the visually induced oscillatory activities.
For examining the dependence of induced oscillations on stimulus size, 4 drifting gratings were presented in the size of 0.5×, 1×, 2× and 3× of the rf of recorded LFP, as shown in the Figure 4.
Optogenetic inactivation and activation
The 589 nm yellow laser and 473 nm blue laser was used to activate the light-activated Arch and ChR2, respectively.
The light from yellow or blue laser (50 mW, Changchun New Industry Laser) was transmitted to the cortical surface near the recording electrode (< 200 μm distance) through an optical fiber (200 μm, core diameter is 50 μm) that was connected to a laser-fiber coupler. A round continuously variable neutral density filter was placed in the light path between the laser and the coupler to adjust the output light intensity at the cortical surface in the range of 0.3–30 mW. In the experiments of applying the 4 or 6 s duration laser lighting, the range of light intensity was often 5–30 mW (measured at the optical fiber opening using a photometer). Although the laser power used to individual animals often varied in the 5–30 mW, an appropriate intensity was used in each experiment to exert apparent light modulation on the LFP activity but not to elicit apparent seizure activity and affect long-term stable recording of LFP and neuronal spikes. Moreover, as shown by Figure S1K, laser intensity within this range show similar level of light modulation to LFP activity (as measured on theta activity), and the modulation effect at 5–10 mW laser is ~60% of maximum at 30 mW. In the experiments of applying 1 ms laser pulse stimuli, the intensity was set at 30 mW.
In the optogenetic stimulation experiments, LFP and neuronal spiking activity showed significant light induced changes when laser was on, and could quickly recover to the normal activity states after each trial of the laser stimulation. Using similar laser stimulation in the wild-type C57 mice, we did not observe any significant neuronal activity changes in the V1 when the laser was on, suggesting that the laser lighting does not activate the retina-to-V1 visual pathway in our experimental conditions. The on and off of laser lighting to cortical surface were set with a laser shutter (SRS474, Lambda Photometrics) under the control of TTL pulses generated from the Master 8 (A.M.P.I.). In the experiments of examining effects of inactivating or activating one subtype of cortical inhibitory IN on spontaneous cortical dynamics, 4 s light pulses (duration 4 s, inter pulse interval ~20 s, repetitions 20–30) were applied to the cortical surface in the absence of visual stimulus (gray background luminance). To measure the LFP resonant activity during the rhythmic activation of one subtype of cortical inhibitory IN at different frequencies, 3 s-length trains of 1 ms blue laser pulses (frequency varied in the range of 1 to 200 Hz, 30–50 repetitions) were used. In the experiments with visual stimuli, laser light stimulation began 3 s before the onset of visual stimulation (2 s drifting gratings) and lasted for 6 s. The preceding laser on can avoid the known transient photoelectric artifacts on recorded LFP and spiking activities elicited by visual stimuli. Meanwhile, this laser lighting protocol could allow us to specifically examine the effects of inactivating one IN subtype on the visually induced relative changes (grating versus blank) of oscillatory activities by comparing that under light on and off conditions. Trials with and without the laser stimulation were alternated and repeated for 36–72 times in a typical experiment.
By varying the distance between the recording electrode and the optic fiber, we estimated what the effective distance of laser lighting is to affect local population neural activity (LFP power spectrum). After examining the relationship between light (with largest intensity of 30 mW) induced LFP power changes (theta band) and the optic fiber-electrode distances (horizontal), we found that the light effect was largely restricted in V1 area (half spatial width of half maximum of light effect is about 0.4 mm, Figure S1L). We also test how light intensity affected the light induced LFP power changes (Figure S1K). So that, light in a range of 5–30 mW was usually used (varied case by case) considering both its efficiency and the potential contamination to the stability or signal-to-noise ratio of neural activity.
In addition to examine the effects of optogenetically inactivating SOM or PV cells on local population oscillatory activities, we also compared the effects of activating (4 s long pulse stimulation) SOM or PV cells in SOM::Ai27/32 or PV::Ai27/32 mice. The results showed that activating SOM or PV substantially silenced the spiking activity of other types of neurons and decreased the oscillatory activities in all frequency bands (Figure S6). There was no substantial difference between activating SOM and activating PV. Thus, the persistent activation method could provide no more information about how SOM and PV differentially regulate local population oscillatory activities when compared with the inactivation method in the present study.
Immunohistochemistry
Different types of transgenic mice were deeply anesthetized with pentobarbital (i.p. injection) after the recording, and then perfused transcardially with the cold saline followed by 4% paraformaldehyde (w/v) in PBS (0.01 M). The brain was dissected and post-fixed for 2 h at 4°C. After fixation, the brain was placed in 30% sucrose (w/v) in PBS solution overnight at 4°C. The occipital part of brain (containing the V1) was sectioned into 20 μm coronal slices using a cryostat (Leica). The sections were treated with blocking solution (10% Bovine Serum Albumin in PBS with 0.5% Triton X-100) for 1 h at 20°C and then incubated with primary antibodies (Goat IgG anti-SOM, MAB353, Santa Cruz 1:200; Rabbit IgG anti-PV, PVG-214, Swant 1:1000) diluted in the blocking solution overnight at 4°C.
Slices were then washed with PBS for 3 × 10 min and incubated with the second antibody (Alexa Fluor 488 or 594 Donkey anti Rabbit IgG 1:1000, Invitrogen) for 2 h at 20°C. Sections were then washed three times with PBS, followed by incubation in 4′,6-diamidino-2-phenylindole (DAPI) staining solution for 10 min. After another round of three 5-min washings in PBS, the stained sections were mounted onto glass slides, air-dried and coverslipped with Mounting Medium (Vector). All the fluorescence staining signals in brain sections were viewed and acquired by a Nikon A1 confocal microscope using a 10× objective and under the scanning mode of 1 × 3 jigsawed and 2 μm-step Z stack. All confocal images were acquired as a TIFF file, and analyzed with the ImageJ software (http://rsbweb.nih.gov/ij/). The percentage of cortical PV or SOM cells that expressed endogenous fluorescence proteins was counted from the randomly selected 3–5 sections for each animal, and the presented average values were measured from 2–4 animals for each examined transgenic line. Data were presented as mean ± s.e.m.
Spike sorting
Raw spike waveforms were sorted into single units (presumptive neurons) by manually tracing boundaries between three-dimensional clusters based on waveform features: the peak amplitude, the first principle component and the waveform energy using the Offline Sorter (Plexon). Clusters that have no clear separation with noise were excluded. Inter spike intervals and autocorrelation functions were inspected for all putative units. If in which the absolute refractory period (2 ms) was violated, the unit was also excluded. All units were further classified (analyzed by custom written MATLAB scripts), by fitting a Gaussian mixture model with two mixture components, as the wide spike (WS) and narrow-spike (NS) units based on their waveform features: the peak-trough latency, the half-peak width and the peak-trough ratio (Barthó et al., 2004; Niell and Stryker, 2010; Stark et al., 2013; related results see Figures S1G–S1J).
Light evoked spike responses and cell type identification
The peri-stimulus time histogram (PSTH) of spikes was used to present the light evoked neuronal responses. Time bins of 20 and 1 ms of PSTHs were used to measure laser light-evoked changes of neuronal spike rates for stimuli of 4–6 s and 1 ms laser pulses, respectively, in the transgenic mice. To quantitatively estimate the significance of light-evoked changes of neuronal firing rate, we used the following statistical tests: the permutation test (Royer et al., 2012) for the 4–6 s laser pulses and the Stimulus-Associated spike Latency Test (SALT, Kvitsiani et al., 2013) for the 1 ms pulses. In the permutation test, the mean firing rate difference (Δf) between control (without) and the (with) laser lighting trials was calculated, and both kind of trials were shuffled for 1000 times to calculate the corresponding (Δfs 1:1000). The p value was estimated from the rank of Δf in the Δfs 1:1000 distribution: If less than 10 values from Δfs 1:1000 were higher (lower) than Δf, that is, the p value was less than 0.01 (10/1000), indicating that the light evoked firing rate increase (decrease) is significant. In the SALT, which is designed to test the significance of changes of spike timing relative to the onset of light stimulus, the light-activated neurons were identified based on the short spike latency and low jitter. In these methods, we also adopted the Pearson’s correlation coefficient (r) to compare the waveforms of units recorded before and during the laser lighting, and only those units showing no substantial changes in their waveforms were included in further data analysis. Using the above statistical methods, we identified 29 SOM cells in the SOM-Arch and SOM-ChR2 mice and 38 PV cells in the PV-Arch and PV-ChR2 mice, which met the statistical criterion of p < 0.01 and r > 0.9. We noted that 3 out of all 38 tagged PV cells showed broader spike waveforms, and this portion is similar to that reported previously in recording from neocortex in vivo (Kvitsiani et al., 2013). However, relatively broader spikes recorded from tagged PV cells can be caused by some other technical factors, such as the electrode position adjacent to recorded cells or the low rate of leaking expression of optogenetic proteins in PCs in PV-Cre:ChR2/Arch transgenic mice. Given only small portion of tagged PV cells showed broad spikes, we have regarded them as putative PV cells also in our study, partly due to there is no effective way to further identifying the cell type nature of these cells.
Spectral analysis
The power spectrum of LFP signals typically fall-off proportional to 1/f. To reduce the dynamic range and thus reduce the power leakage from the lower frequencies into the higher frequencies during spectral estimation, we whitened the LFP signals. In the pre-whitening process, a low-order (order = 3) autoregressive (AR) spectrum estimation was used, which could reduce the dynamic range but without fitting specific structural features of the data (Niell and Stryker, 2010; Mitra and Pesaran, 1999). We used the Levinson Durbin recursion method to fit the AR model, and the coefficients (Ak) of this process were then used to filter the original time series data (Xt). The residuals:
| (1) |
were subject to the later spectral analysis.
We first normalized the filtered LFP signals (1–200 Hz) by calculating the z-score and performing the pre-whitening as described above. The power spectrum of the spontaneous LFP was computed using the multi-taper estimation method in MATLAB with the chronux package (http://chronux.org), using 5 s data segments and 3–5 tapers (TW = 3, K = 5). Then, we smoothed the spectrum by using the “locfit” function in the chronux toolbox after removing the 50 Hz line noise in some mice to reduce the variation but without affecting the features. In the time-frequency spectral analysis, a 0.5 s sliding window at a 0.02 s step was used to calculate continuous power spectrograms of the spontaneous LFPs of 1–10 min length and the visual stimuli- or light-induced LFPs of 4–12 s length (including the blank). The wavelet analysis (by “cwt” function in MATLAB wavelet toolbox) was also used to calculate power spectrogram for the Figures 5A and 5E, Figures S2E and S2G to enhance the temporal resolution. The power at each frequency and time point was finally normalized by the mean power across all frequency bands (1–90 Hz) and the total period (normalized power). Continuous LFP amplitude/power in specific frequency bands (theta 2–8 Hz, gamma 40–70 Hz) for Figure 2 and Figure S3 data were estimated by using the Hilbert transform after band-pass filtering (as described below) the raw signal.
Cross-frequency coupling (CFC)
The previous method described by Canolty et al., (2006) was used to assess the phase-amplitude CFC. The LFP was first band-pass filtered using an infinite impulse response (IIR) Elliptic filter by means of the “filtfilt” function (MATLAB). Then the Hilbert transform (in the Signal Processing Toolbox) was used to compute the instantaneous beta (15–30 Hz) or gamma (40–70 Hz) amplitudes, AG(t), and theta (2–8 Hz) phase, ΦT(t). A composite complex-valued signal:
| (2) |
was constructed. The mean of z(t) was called MRAW here. A set of surrogate composite complex-valued signals:
| (3) |
were constructed by offsetting AG and ΦT by some large time lag to compute Msur. The modulus of MRAW, |MRAW|, compared to the distribution of surrogate modulus, provides a measure of the coupling strength, while the angle of MRAW in comparison with the distribution of surrogate angles suggests the preferred phase of theta with the largest gamma amplitudes. We define a normalized length of
| (4) |
where μ is the mean of the surrogate lengths and σ is their standard deviation. This normalized MNORM represents the cross-frequency coupling strength or the modulation index. Moreover, we followed a previous method (Esghaei et al., 2015) to test whether CFC changes induced by optogenetic stimulation are attributed to changes of the LFP power spectrum. First, we generated two arbitrary random LFP signals showing same power spectrums as the LFP signals experimentally recorded in the light OFF and light ON conditions and then calculated the CFC strengths of these two LFP signals. The results showed that the CFC strengths of the two randomly generated LFP signals have no difference (Figures S7A and S7D), suggesting that the light-induced LFP’s CFC changes were not attributed to the power spectrum changes. Second, we found that in the SOM::Ai35 mice, significant decreases of the CFC during the light activation of Arch were observed in most trials in which the theta band LFP power was decreased, instead of in other trails with increased theta band power (Figures S7B and S7C), while in the PV::Ai35 mice, the induced increase of the CFC occurred only in the trials with increased theta band power (Figures S7E and S7F). These new results suggest that the changes of CFC and theta band power induced by optogenetic suppression of SOM or PV inhibitory neurons are correlated to each other to some extent, which differs from the attention modulation on the CFC and low frequency band power (Esghaei et al., 2015).
LFP phase preference of spikes
LFP was band-pass filtered as described above and then the theta (T), beta (B) or gamma (G) phase series: ΦT(t), ΦB(t) or ΦG(t) was estimated using the Hilbert transform function. Similar to the phase-amplitude CFC, here the LFP amplitude: AG(t) was replaced by the spike train: S(t) to calculate the phase preference of spikes. A composite complex-valued signal:
| (5) |
was constructed. S(t) is a vector of 0 (no spike) and 1 (spike) for the spike train at the temporal resolution of 1 ms. MRAW-spike is also the mean of Z(t). A set of surrogate composite complex-valued signals:
| (6) |
were constructed by offsetting S and ΦT by some large time lag to compute Msur. The angle of MRAW-spike is the preferred LFP phase of spikes and the MNORM-spike calculated as in the Equation (4) is the phase-spike modulation index. Instantaneous firing rate (spikes/s) at different LFP phases was plotted in the Figure S3 with 31 phase bins from 0 to 2π.
Spike-LFP pairwise phase consistency (PPC)
The LFP, which was filtered in the range of 1–200 Hz, and spike train of a unit (mean firing rate > 1 Hz) were used to calculate the PPC (Vinck et al., 2010). The sample estimate of the PPC was defined as:
| (7) |
| (8) |
θj and θk are the corresponding LFP phases of jth and kth spike of a unit. f(θj, θk) calculates the cosine of the angular distance between θj and θk. In this study, we calculated the PPC spectra from the spike-triggered LFP spectrum for each unit by using the FieldTrip MATLAB package (Oostenveld et al., 2011, http://www.fieldtriptoolbox.org/).
Two groups of PPC of spikes occurred when the theta or gamma band LFP power was high or low during spontaneous activity was compared (Figure 2). The difference of them was:
| (9) |
The time window of 200–1800 ms before and after the visual stimulus onset was used to calculate the baseline PPC and the visually induced PPC, respectively. Visually induced change of PPC (Figure 3) was defined as:
| (10) |
In the optogenetic experiments (Figure 5). The light induced change of PPC of spontaneous activity was defined as:
| (11) |
The significance of changes of PPC induced by LFP power change (low gamma power versus high gamma power), visual stimulation (grating versus blank) or light stimulation (light on versus light off) were calculated by permutation test: shuffle the spike-LFP trials in two conditions for 1000 times and then compare the real PPC change (ΔPPC) with that in the shuffle group (ΔPPCs 1:1000). The p value was estimated from the rank of ΔPPC in the ΔPPCs 1:1000 distribution. If less than 10 values from ΔPPCs 1:1000 were higher (lower) than ΔPPC, that is, the p value was less than 0.01 (10/1000).
Light evoked resonant circuit activity
The 1-ms single laser pulse-evoked average of LFPs was calculated to reflect the field responses to the transient optogenetic activation of one type of inhibitory IN. To test the resonation property, the evoked LFP power change (Powerlight/Powerbaseline; Powerlight: power of 3 s length LFP segments with rhythmic light stimulation; Powerbaseline: power of 3 s length LFP segments without rhythmic light stimulation) at each light stimulation frequency was calculated based on the above spectrum analysis (multi-taper power estimation method in the chronux package). The power changes at each frequency were then normalized to their maximum to get the resonation tuning curve (Figure 7).
VEP, spike rate, receptive field and orientation tuning
Visual evoked potentials (VEPs) were recorded primarily in the layers 2–4 and calculated as the visual stimulus triggered LFPs’ average. Negative peak amplitudes of the VEPs were measured for stimulation of the drifting grating or the sparse 2D noise. Only those recordings with VEP amplitudes > 100 μV were included in further analyses. PSTHs of spikes fired around the visual stimulation were also measured to calculate the baseline mean firing rate (2 s blank), the visually evoked transient peak rate (within 100 ms after the stimulus onset) and the mean rate of induced persistent spiking (Figure 3). To estimate the size of receptive fields, VEP evoked by bright square flash in each grid and the spike triggered stimulus average in pre-spike frames were calculated. A global measure (S, 1-circular variance, see ref. Ringach et al., 2002) of the orientation tuning curve was computed:
| (12) |
θ is the visual stimulus orientation, summation in the equation was performed over the θ. F is the visually evoked firing rate (after subtracting the baseline firing rate), the induced LFP power change or the SFC change in specific frequency band. Absolute value of S is the orientation selective index (osi, Figure S4).
QUANTIFICATION AND STATISTICAL ANALYSIS
Data are presented as mean ± s.e.m. unless otherwise stated in text and figure legends. Statistical significance (p values) were computed by following methods in MATLAB (Mathworks): permutation test (Royer et al., 2012), Wilcoxon two-sided signed rank test, Spearman two-tailed rank correlation test, Kruskal-Wallis ANOVA test, Kolmogorov-Smirnov test and Stimulus-Associated spike Latency Test (SALT, Kvitsiani et al., 2013). More details of all performed statistical tests and the number of cells, recording sites and mice are described in text and figure legends.
DATA AND SOFTWARE AVAILABILITY
Data analyses were performed with custom written scripts in MATLAB (Mathworks). The spike sorting software is the Offline Sorter from Plexon. Requests for data and MATLAB scripts used in the present study can be directed to the lead author (xhzhang@bnu.edu.cn).
Supplementary Material
Highlights.
Spiking of SOM and PV cells differentially correlates with beta and gamma oscillations
SOM cells are required for generating visually induced beta oscillation
Inactivating PV cells masks the visually induced, SOM cell-dependent beta oscillation
SOM and PV cells preferentially drive slow and fast oscillations, respectively
Acknowledgments
We thank Drs. J. Huang (CSHL) and H. Zeng (Allen Institute) for kindly providing Som-IRES-Cre mice as well as Ai35, Ai27, and Ai32 mice, respectively; Dr. Y. Liu for technical supports to the laser stimulation setup; and Dr. B. Li (CSHL) for critical reading on the manuscript. The work was supported by the grants from the State Key Research Program of China (2011CBA00404 to X. Zhang and 2014CB846101 to M.J.R.), the Interdisciplinary Research Funds of Beijing Normal University (to X. Zhang), and the MIT Greater China for Innovation Fund (to Y.L. and X. Zhang). H.W.T. was supported by an NSF of China grant (31628007) and in part by NIH grants (EY019049 and EY025722).
Footnotes
SUPPLEMENTAL INFORMATION
Supplemental Information includes seven figures and can be found with this article online at https://doi.org/10.1016/j.neuron.2017.11.033.
AUTHOR CONTRIBUTIONS
X. Zhang, G.C., and H.W.T. conceived the research. X. Zhang, G.C., and Y.L. designed the experiments. G.C. and Y.Z. performed the in vivo physiology experiments and data analysis. M.J.R., X. Zhao, X. Zhang, and Y.L. performed additional data analysis. X.L. and Q.Y. performed the immunohistochemistry experiments. X. Zhang, G.C., and M.J.R. wrote the manuscript and all authors commented on the writing.
DECLARATION OF INTERESTS
The authors declare no competing interests.
References
- Adesnik H, Bruns W, Taniguchi H, Huang ZJ, Scanziani M. A neural circuit for spatial summation in visual cortex. Nature. 2012;490:226–231. doi: 10.1038/nature11526. [DOI] [PMC free article] [PubMed] [Google Scholar]
- Barthó P, Hirase H, Monconduit L, Zugaro M, Harris KD, Buzsáki G. Characterization of neocortical principal cells and interneurons by network interactions and extracellular features. J Neurophysiol. 2004;92:600–608. doi: 10.1152/jn.01170.2003. [DOI] [PubMed] [Google Scholar]
- Bartos M, Vida I, Jonas P. Synaptic mechanisms of synchronized gamma oscillations in inhibitory interneuron networks. Nat Rev Neurosci. 2007;8:45–56. doi: 10.1038/nrn2044. [DOI] [PubMed] [Google Scholar]
- Beierlein M, Gibson JR, Connors BW. Two dynamically distinct inhibitory networks in layer 4 of the neocortex. J Neurophysiol. 2003;90:2987–3000. doi: 10.1152/jn.00283.2003. [DOI] [PubMed] [Google Scholar]
- Borg-Graham LJ, Monier C, Frégnac Y. Visual input evokes transient and strong shunting inhibition in visual cortical neurons. Nature. 1998;393:369–373. doi: 10.1038/30735. [DOI] [PubMed] [Google Scholar]
- Boyden ES, Zhang F, Bamberg E, Nagel G, Deisseroth K. Millisecond-timescale, genetically targeted optical control of neural activity. Nat Neurosci. 2005;8:1263–1268. doi: 10.1038/nn1525. [DOI] [PubMed] [Google Scholar]
- Butts DA, Weng C, Jin J, Yeh CI, Lesica NA, Alonso JM, Stanley GB. Temporal precision in the neural code and the timescales of natural vision. Nature. 2007;449:92–95. doi: 10.1038/nature06105. [DOI] [PubMed] [Google Scholar]
- Buzsáki G. Theta oscillations in the hippocampus. Neuron. 2002;33:325–340. doi: 10.1016/s0896-6273(02)00586-x. [DOI] [PubMed] [Google Scholar]
- Buzsáki G, Wang XJ. Mechanisms of gamma oscillations. Annu Rev Neurosci. 2012;35:203–225. doi: 10.1146/annurev-neuro-062111-150444. [DOI] [PMC free article] [PubMed] [Google Scholar]
- Cammarota M, Losi G, Chiavegato A, Zonta M, Carmignoto G. Fast spiking interneuron control of seizure propagation in a cortical slice model of focal epilepsy. J Physiol. 2013;591:807–822. doi: 10.1113/jphysiol.2012.238154. [DOI] [PMC free article] [PubMed] [Google Scholar]
- Canolty RT, Edwards E, Dalal SS, Soltani M, Nagarajan SS, Kirsch HE, Berger MS, Barbaro NM, Knight RT. High gamma power is phase-locked to theta oscillations in human neocortex. Science. 2006;313:1626–1628. doi: 10.1126/science.1128115. [DOI] [PMC free article] [PubMed] [Google Scholar]
- Cardin JA, Carlén M, Meletis K, Knoblich U, Zhang F, Deisseroth K, Tsai LH, Moore CI. Driving fast-spiking cells induces gamma rhythm and controls sensory responses. Nature. 2009;459:663–667. doi: 10.1038/nature08002. [DOI] [PMC free article] [PubMed] [Google Scholar]
- Chen G, Rasch MJ, Wang R, Zhang XH. Experience-dependent emergence of beta and gamma band oscillations in the primary visual cortex during the critical period. Sci Rep. 2015;5:17847. doi: 10.1038/srep17847. [DOI] [PMC free article] [PubMed] [Google Scholar]
- Chow BY, Han X, Dobry AS, Qian X, Chuong AS, Li M, Henninger MA, Belfort GM, Lin Y, Monahan PE, Boyden ES. High-performance genetically targetable optical neural silencing by light-driven proton pumps. Nature. 2010;463:98–102. doi: 10.1038/nature08652. [DOI] [PMC free article] [PubMed] [Google Scholar]
- Cottam JCH, Smith SL, Häusser M. Target-specific effects of somatostatin-expressing interneurons on neocortical visual processing. J Neurosci. 2013;33:19567–19578. doi: 10.1523/JNEUROSCI.2624-13.2013. [DOI] [PMC free article] [PubMed] [Google Scholar]
- Dombeck DA, Khabbaz AN, Collman F, Adelman TL, Tank DW. Imaging large-scale neural activity with cellular resolution in awake, mobile mice. Neuron. 2007;56:43–57. doi: 10.1016/j.neuron.2007.08.003. [DOI] [PMC free article] [PubMed] [Google Scholar]
- Engel AK, Singer W. Temporal binding and the neural correlates of sensory awareness. Trends Cogn Sci. 2001;5:16–25. doi: 10.1016/s1364-6613(00)01568-0. [DOI] [PubMed] [Google Scholar]
- Engel AK, Fries P, Singer W. Dynamic predictions: oscillations and synchrony in top-down processing. Nat Rev Neurosci. 2001;2:704–716. doi: 10.1038/35094565. [DOI] [PubMed] [Google Scholar]
- Esghaei M, Daliri MR, Treue S. Attention decreases phase-amplitude coupling, enhancing stimulus discriminability in cortical area MT. Front Neural Circuits. 2015;9:82. doi: 10.3389/fncir.2015.00082. [DOI] [PMC free article] [PubMed] [Google Scholar]
- Freeman WJ. Waves, pulses and the theory of neural masses. Prog Theor Biol. 1972;2:87–165. [Google Scholar]
- Fries P, Reynolds JH, Rorie AE, Desimone R. Modulation of oscillatory neuronal synchronization by selective visual attention. Science. 2001;291:1560–1563. doi: 10.1126/science.1055465. [DOI] [PubMed] [Google Scholar]
- Fu Y, Tucciarone JM, Espinosa JS, Sheng N, Darcy DP, Nicoll RA, Huang ZJ, Stryker MP. A cortical circuit for gain control by behavioral state. Cell. 2014;156:1139–1152. doi: 10.1016/j.cell.2014.01.050. [DOI] [PMC free article] [PubMed] [Google Scholar]
- Fukunaga I, Herb JT, Kollo M, Boyden ES, Schaefer AT. Independent control of gamma and theta activity by distinct interneuron networks in the olfactory bulb. Nat Neurosci. 2014;17:1208–1216. doi: 10.1038/nn.3760. [DOI] [PMC free article] [PubMed] [Google Scholar]
- Gieselmann MA, Thiele A. Comparison of spatial integration and surround suppression characteristics in spiking activity and the local field potential in macaque V1. Eur J Neurosci. 2008;28:447–459. doi: 10.1111/j.1460-9568.2008.06358.x. [DOI] [PubMed] [Google Scholar]
- Gray CM, Singer W. Stimulus-specific neuronal oscillations in orientation columns of cat visual cortex. Proc Natl Acad Sci USA. 1989;86:1698–1702. doi: 10.1073/pnas.86.5.1698. [DOI] [PMC free article] [PubMed] [Google Scholar]
- Haider B, Duque A, Hasenstaub AR, McCormick DA. Neocortical network activity in vivo is generated through a dynamic balance of excitation and inhibition. J Neurosci. 2006;26:4535–4545. doi: 10.1523/JNEUROSCI.5297-05.2006. [DOI] [PMC free article] [PubMed] [Google Scholar]
- Haider B, Häusser M, Carandini M. Inhibition dominates sensory responses in the awake cortex. Nature. 2013;493:97–100. doi: 10.1038/nature11665. [DOI] [PMC free article] [PubMed] [Google Scholar]
- Han X, Qian X, Bernstein JG, Zhou HH, Franzesi GT, Stern P, Bronson RT, Graybiel AM, Desimone R, Boyden ES. Millisecond-timescale optical control of neural dynamics in the nonhuman primate brain. Neuron. 2009;62:191–198. doi: 10.1016/j.neuron.2009.03.011. [DOI] [PMC free article] [PubMed] [Google Scholar]
- Hu H, Ma Y, Agmon A. Submillisecond firing synchrony between different subtypes of cortical interneurons connected chemically but not electrically. J Neurosci. 2011;31:3351–3361. doi: 10.1523/JNEUROSCI.4881-10.2011. [DOI] [PMC free article] [PubMed] [Google Scholar]
- Huberman AD, Niell CM. What can mice tell us about how vision works? Trends Neurosci. 2011;34:464–473. doi: 10.1016/j.tins.2011.07.002. [DOI] [PMC free article] [PubMed] [Google Scholar]
- Jiang X, Shen S, Cadwell CR, Berens P, Sinz F, Ecker AS, Patel S, Tolias AS. Principles of connectivity among morphologically defined cell types in adult neocortex. Science. 2015;350:aac9462. doi: 10.1126/science.aac9462. [DOI] [PMC free article] [PubMed] [Google Scholar]
- Jurjuţ OF, Nikolić D, Singer W, Yu S, Havenith MN, Mureşan RC. Timescales of multineuronal activity patterns reflect temporal structure of visual stimuli. PLoS ONE. 2011;6:e16758. doi: 10.1371/journal.pone.0016758. [DOI] [PMC free article] [PubMed] [Google Scholar]
- Karnani MMM, Jackson J, Ayzenshtat I, Tucciarone J, Manoocheri K, Snider WGG, Yuste R. Cooperative subnetworks of molecularly similar interneurons in mouse neocortex. Neuron. 2016;90:86–100. doi: 10.1016/j.neuron.2016.02.037. [DOI] [PMC free article] [PubMed] [Google Scholar]
- Kayser C, Ince RAA, Panzeri S. Analysis of slow (theta) oscillations as a potential temporal reference frame for information coding in sensory cortices. PLoS Comput Biol. 2012;8:e1002717. doi: 10.1371/journal.pcbi.1002717. [DOI] [PMC free article] [PubMed] [Google Scholar]
- Kepecs A, Fishell G. Interneuron cell types are fit to function. Nature. 2014;505:318–326. doi: 10.1038/nature12983. [DOI] [PMC free article] [PubMed] [Google Scholar]
- Klausberger T, Somogyi P. Neuronal diversity and temporal dynamics: the unity of hippocampal circuit operations. Science. 2008;321:53–57. doi: 10.1126/science.1149381. [DOI] [PMC free article] [PubMed] [Google Scholar]
- Klausberger T, Magill PJ, Márton LF, Roberts JDB, Cobden PM, Buzsáki G, Somogyi P. Brain-state- and cell-type-specific firing of hippocampal interneurons in vivo. Nature. 2003;421:844–848. doi: 10.1038/nature01374. [DOI] [PubMed] [Google Scholar]
- Kvitsiani D, Ranade S, Hangya B, Taniguchi H, Huang JZ, Kepecs A. Distinct behavioural and network correlates of two interneuron types in prefrontal cortex. Nature. 2013;498:363–366. doi: 10.1038/nature12176. [DOI] [PMC free article] [PubMed] [Google Scholar]
- Lalo E, Thobois S, Sharott A, Polo G, Mertens P, Pogosyan A, Brown P. Patterns of bidirectional communication between cortex and basal ganglia during movement in patients with Parkinson disease. J Neurosci. 2008;28:3008–3016. doi: 10.1523/JNEUROSCI.5295-07.2008. [DOI] [PMC free article] [PubMed] [Google Scholar]
- Lazarus MS, Huang ZJ. Distinct maturation profiles of perisomatic and dendritic targeting GABAergic interneurons in the mouse primary visual cortex during the critical period of ocular dominance plasticity. J Neurophysiol. 2011;106:775–787. doi: 10.1152/jn.00729.2010. [DOI] [PMC free article] [PubMed] [Google Scholar]
- Lee SH, Kwan AC, Zhang S, Phoumthipphavong V, Flannery JG, Masmanidis SC, Taniguchi H, Huang ZJ, Zhang F, Boyden ES, et al. Activation of specific interneurons improves V1 feature selectivity and visual perception. Nature. 2012;488:379–383. doi: 10.1038/nature11312. [DOI] [PMC free article] [PubMed] [Google Scholar]
- Li X, Gutierrez DV, Hanson MG, Han J, Mark MD, Chiel H, Hegemann P, Landmesser LT, Herlitze S. Fast noninvasive activation and inhibition of neural and network activity by vertebrate rhodopsin and green algae channelrhodopsin. Proc Natl Acad Sci USA. 2005;102:17816–17821. doi: 10.1073/pnas.0509030102. [DOI] [PMC free article] [PubMed] [Google Scholar]
- Lisman JE, Jensen O. The θ-γ neural code. Neuron. 2013;77:1002–1016. doi: 10.1016/j.neuron.2013.03.007. [DOI] [PMC free article] [PubMed] [Google Scholar]
- Livingstone MS. Oscillatory firing and interneuronal correlations in squirrel monkey striate cortex. J Neurophysiol. 1996;75:2467–2485. doi: 10.1152/jn.1996.75.6.2467. [DOI] [PubMed] [Google Scholar]
- Ma WP, Liu BH, Li YT, Huang ZJ, Zhang LI, Tao HW. Visual representations by cortical somatostatin inhibitory neurons–selective but with weak and delayed responses. J Neurosci. 2010;30:14371–14379. doi: 10.1523/JNEUROSCI.3248-10.2010. [DOI] [PMC free article] [PubMed] [Google Scholar]
- Madisen L, Mao T, Koch H, Zhuo JM, Berenyi A, Fujisawa S, Hsu YWA, Garcia AJ, 3rd, Gu X, Zanella S, et al. A toolbox of Cre-dependent optogenetic transgenic mice for light-induced activation and silencing. Nat Neurosci. 2012;15:793–802. doi: 10.1038/nn.3078. [DOI] [PMC free article] [PubMed] [Google Scholar]
- Markram H, Toledo-Rodriguez M, Wang Y, Gupta A, Silberberg G, Wu C. Interneurons of the neocortical inhibitory system. Nat Rev Neurosci. 2004;5:793–807. doi: 10.1038/nrn1519. [DOI] [PubMed] [Google Scholar]
- Miao Q, Yao L, Rasch MJ, Ye Q, Li X, Zhang X. Selective maturation of temporal dynamics of intracortical excitatory transmission at the critical period onset. Cell Rep. 2016;16:1677–1689. doi: 10.1016/j.celrep.2016.07.013. [DOI] [PubMed] [Google Scholar]
- Mitra PP, Pesaran B. Analysis of dynamic brain imaging data. Biophys J. 1999;76:691–708. doi: 10.1016/S0006-3495(99)77236-X. [DOI] [PMC free article] [PubMed] [Google Scholar]
- Montemurro MA, Rasch MJ, Murayama Y, Logothetis NK, Panzeri S. Phase-of-firing coding of natural visual stimuli in primary visual cortex. Curr Biol. 2008;18:375–380. doi: 10.1016/j.cub.2008.02.023. [DOI] [PubMed] [Google Scholar]
- Nase G, Singer W, Monyer H, Engel AK. Features of neuronal synchrony in mouse visual cortex. J Neurophysiol. 2003;90:1115–1123. doi: 10.1152/jn.00480.2002. [DOI] [PubMed] [Google Scholar]
- Niell CM, Stryker MP. Highly selective receptive fields in mouse visual cortex. J Neurosci. 2008;28:7520–7536. doi: 10.1523/JNEUROSCI.0623-08.2008. [DOI] [PMC free article] [PubMed] [Google Scholar]
- Niell CM, Stryker MP. Modulation of visual responses by behavioral state in mouse visual cortex. Neuron. 2010;65:472–479. doi: 10.1016/j.neuron.2010.01.033. [DOI] [PMC free article] [PubMed] [Google Scholar]
- O’Keefe J, Dostrovsky J. The hippocampus as a spatial map. Preliminary evidence from unit activity in the freely-moving rat. Brain Res. 1971;34:171–175. doi: 10.1016/0006-8993(71)90358-1. [DOI] [PubMed] [Google Scholar]
- Oostenveld R, Fries P, Maris E, Schoffelen JM. FieldTrip: Open source software for advanced analysis of MEG, EEG, and invasive electrophysiological data. Comput Intell Neurosci. 2011;2011:156869. doi: 10.1155/2011/156869. [DOI] [PMC free article] [PubMed] [Google Scholar]
- Perrenoud Q, Pennartz CMA, Gentet LJ. Membrane potential dynamics of spontaneous and visually evoked gamma activity in V1 of awake mice. PLoS Biol. 2016;14:e1002383. doi: 10.1371/journal.pbio.1002383. [DOI] [PMC free article] [PubMed] [Google Scholar]
- Pfeffer CK, Xue M, He M, Huang ZJ, Scanziani M. Inhibition of inhibition in visual cortex: the logic of connections between molecularly distinct interneurons. Nat Neurosci. 2013;16:1068–1076. doi: 10.1038/nn.3446. [DOI] [PMC free article] [PubMed] [Google Scholar]
- Polack PO, Friedman J, Golshani P. Cellular mechanisms of brain state-dependent gain modulation in visual cortex. Nat Neurosci. 2013;16:1331–1339. doi: 10.1038/nn.3464. [DOI] [PMC free article] [PubMed] [Google Scholar]
- Ray S, Maunsell JHR. Differences in gamma frequencies across visual cortex restrict their possible use in computation. Neuron. 2010;67:885–896. doi: 10.1016/j.neuron.2010.08.004. [DOI] [PMC free article] [PubMed] [Google Scholar]
- Ringach DL, Shapley RM, Hawken MJ. Orientation selectivity in macaque V1: diversity and laminar dependence. J Neurosci. 2002;22:5639–5651. doi: 10.1523/JNEUROSCI.22-13-05639.2002. [DOI] [PMC free article] [PubMed] [Google Scholar]
- Roux L, Stark E, Sjulson L, Buzsáki G. In vivo optogenetic identification and manipulation of GABAergic interneuron subtypes. Curr Opin Neurobiol. 2014;26:88–95. doi: 10.1016/j.conb.2013.12.013. [DOI] [PMC free article] [PubMed] [Google Scholar]
- Royer S, Zemelman BV, Losonczy A, Kim J, Chance F, Magee JC, Buzsáki G. Control of timing, rate and bursts of hippocampal place cells by dendritic and somatic inhibition. Nat Neurosci. 2012;15:769–775. doi: 10.1038/nn.3077. [DOI] [PMC free article] [PubMed] [Google Scholar]
- Rudy B, Fishell G, Lee S, Hjerling-Leffler J. Three groups of interneurons account for nearly 100% of neocortical GABAergic neurons. Dev Neurobiol. 2011;71:45–61. doi: 10.1002/dneu.20853. [DOI] [PMC free article] [PubMed] [Google Scholar]
- Saleem AB, Lien AD, Krumin M, Haider B, Rosón MR, Ayaz A, Reinhold K, Busse L, Carandini M, Harris KD. Subcortical Source and Modulation of the Narrowband Gamma Oscillation in Mouse Visual Cortex. Neuron. 2017;93:315–322. doi: 10.1016/j.neuron.2016.12.028. [DOI] [PMC free article] [PubMed] [Google Scholar]
- Sanes JN, Donoghue JP. Oscillations in local field potentials of the primate motor cortex during voluntary movement. Proc Natl Acad Sci USA. 1993;90:4470–4474. doi: 10.1073/pnas.90.10.4470. [DOI] [PMC free article] [PubMed] [Google Scholar]
- Siegle JH, Pritchett DL, Moore CI. Gamma-range synchronization of fast-spiking interneurons can enhance detection of tactile stimuli. Nat Neurosci. 2014;17:1371–1379. doi: 10.1038/nn.3797. [DOI] [PMC free article] [PubMed] [Google Scholar]
- Sohal VS, Zhang F, Yizhar O, Deisseroth K. Parvalbumin neurons and gamma rhythms enhance cortical circuit performance. Nature. 2009;459:698–702. doi: 10.1038/nature07991. [DOI] [PMC free article] [PubMed] [Google Scholar]
- Stark E, Eichler R, Roux L, Fujisawa S, Rotstein HG, Buzsáki G. Inhibition-induced theta resonance in cortical circuits. Neuron. 2013;80:1263–1276. doi: 10.1016/j.neuron.2013.09.033. [DOI] [PMC free article] [PubMed] [Google Scholar]
- Steriade M, McCormick DA, Sejnowski TJ. Thalamocortical oscillations in the sleeping and aroused brain. Science. 1993;262:679–685. doi: 10.1126/science.8235588. [DOI] [PubMed] [Google Scholar]
- Tiesinga P, Sejnowski TJ. Cortical enlightenment: are attentional gamma oscillations driven by ING or PING? Neuron. 2009;63:727–732. doi: 10.1016/j.neuron.2009.09.009. [DOI] [PMC free article] [PubMed] [Google Scholar]
- Uhlhaas PJ, Singer W. Abnormal neural oscillations and synchrony in schizophrenia. Nat Rev Neurosci. 2010;11:100–113. doi: 10.1038/nrn2774. [DOI] [PubMed] [Google Scholar]
- Veit J, Hakim R, Jadi MP, Sejnowski TJ, Adesnik H. Cortical gamma band synchronization through somatostatin interneurons. Nat Neurosci. 2017;20:951–959. doi: 10.1038/nn.4562. [DOI] [PMC free article] [PubMed] [Google Scholar]
- Vierling-Claassen D, Cardin JA, Moore CI, Jones SR. Computational modeling of distinct neocortical oscillations driven by cell-type selective optogenetic drive: separable resonant circuits controlled by low-threshold spiking and fast-spiking interneurons. Front Hum Neurosci. 2010;4:198. doi: 10.3389/fnhum.2010.00198. [DOI] [PMC free article] [PubMed] [Google Scholar]
- Vinck M, Bosman CA. More gamma more predictions: gamma-synchronization as a key mechanism for efficient integration of classical receptive field inputs with surround predictions. Front Syst Neurosci. 2016;10:35. doi: 10.3389/fnsys.2016.00035. [DOI] [PMC free article] [PubMed] [Google Scholar]
- Vinck M, van Wingerden M, Womelsdorf T, Fries P, Pennartz CMA. The pairwise phase consistency: a bias-free measure of rhythmic neuronal synchronization. Neuroimage. 2010;51:112–122. doi: 10.1016/j.neuroimage.2010.01.073. [DOI] [PubMed] [Google Scholar]
- Wang XJ, Buzsáki G. Gamma oscillation by synaptic inhibition in a hippocampal interneuronal network model. J Neurosci. 1996;16:6402–6413. doi: 10.1523/JNEUROSCI.16-20-06402.1996. [DOI] [PMC free article] [PubMed] [Google Scholar]
- Welle CG. PhD thesis. University of Pennsylvania; 2010. Gamma oscillations in the mouse primary visual cortex as an endophenotype of schizophrenia. [Google Scholar]
- Whittington MA, Traub RD. Interneuron diversity series: inhibitory interneurons and network oscillations in vitro. Trends Neurosci. 2003;26:676–682. doi: 10.1016/j.tins.2003.09.016. [DOI] [PubMed] [Google Scholar]
- Wilson NR, Runyan CA, Wang FL, Sur M. Division and subtraction by distinct cortical inhibitory networks in vivo. Nature. 2012;488:343–348. doi: 10.1038/nature11347. [DOI] [PMC free article] [PubMed] [Google Scholar]
- Womelsdorf T, Valiante TA, Sahin NT, Miller KJ, Tiesinga P. Dynamic circuit motifs underlying rhythmic gain control, gating and integration. Nat Neurosci. 2014;17:1031–1039. doi: 10.1038/nn.3764. [DOI] [PubMed] [Google Scholar]
- Xu H, Jeong HY, Tremblay R, Rudy B. Neocortical somatostatin-expressing GABAergic interneurons disinhibit the thalamorecipient layer 4. Neuron. 2013;77:155–167. doi: 10.1016/j.neuron.2012.11.004. [DOI] [PMC free article] [PubMed] [Google Scholar]
- Xue M, Atallah BV, Scanziani M. Equalizing excitation-inhibition ratios across visual cortical neurons. Nature. 2014;511:596–600. doi: 10.1038/nature13321. [DOI] [PMC free article] [PubMed] [Google Scholar]
- Zhang L, Li B. Surround modulation characteristics of local field potential and spiking activity in primary visual cortex of cat. PLoS ONE. 2013;8:e64492. doi: 10.1371/journal.pone.0064492. [DOI] [PMC free article] [PubMed] [Google Scholar]
- Zhang D, Li Y, Rasch MJ, Wu S. Nonlinear multiplicative dendritic integration in neuron and network models. Front Comput Neurosci. 2013;7:56. doi: 10.3389/fncom.2013.00056. [DOI] [PMC free article] [PubMed] [Google Scholar]
Associated Data
This section collects any data citations, data availability statements, or supplementary materials included in this article.