

Abstract
Human umbilical tissue-derived cells (hUTC or palucorcel) are currently under clinical investigation for the treatment of geographic atrophy, a late stage of macular degeneration, but how hUTC transplantation mediates vision recovery is not fully elucidated. Subretinal administration of hUTC preserves visual function in the Royal College of Surgeons (RCS) rat, a genetic model of retinal degeneration caused by Mertk loss of function. hUTC secrete synaptogenic and neurotrophic factors that improve the health and connectivity of the neural retina. Therefore, we investigated the progression of synapse and photoreceptor loss and whether hUTC treatment preserves photoreceptors and synaptic connectivity in the RCS rats of both sexes. We found that RCS retinas display significant deficits in synaptic development already by postnatal day 21 (P21), before the onset of photoreceptor degeneration. Subretinal transplantation of hUTC at P21 is necessary to rescue visual function in RCS rats, and the therapeutic effect is enhanced with repeated injections. Synaptic development defects occurred concurrently with morphological changes in Müller glia, the major perisynaptic glia in the retina. hUTC transplantation strongly diminished Müller glia reactivity and specifically protected the α2δ-1-containing retinal synapses, which are responsive to thrombospondin family synaptogenic proteins secreted by Müller glia. Müller glial reactivity and reduced synaptogenesis observed in RCS retinas could be recapitulated by CRISPR/Cas9-mediated loss-of-Mertk in Müller glia in wild-type rats. Together, our results show that hUTC transplantation supports the health of retina at least in part by preserving the functions of Müller glial cells, revealing a previously unknown aspect of hUTC transplantation-based therapy.
SIGNIFICANCE STATEMENT Despite the promising effects observed in clinical trials and preclinical studies, how subretinal human umbilical tissue-derived cell (hUTC) transplantation mediates vision improvements is not fully known. Using a rat model of retinal degeneration, the RCS rat (lacking Mertk), here we provide evidence that hUTC transplantation protects visual function and health by protecting photoreceptors and preserving retinal synaptic connectivity. Furthermore, we find that loss of Mertk function only in Müller glia is sufficient to impair synaptic development and cause activation of Müller glia. hUTC transplantation strongly attenuates the reactivity of Müller glia in RCS rats. These findings highlight novel cellular and molecular mechanisms within the neural retina, which underlie disease mechanisms and pinpoint Müller glia as a novel cellular target for hUTC transplantation.
Keywords: cell transplantation, MERTK, Müller glia, retinal degeneration, synapse formation, thrombospondins
Introduction
Age-related macular degeneration is the leading cause of blindness in individuals over the age of 60 (Lim et al., 2012). Currently, there are no effective treatments available for most of these patients, particularly those afflicted with geographic atrophy, the advanced form of dry age-related macular degeneration, characterized by degeneration of the retinal pigment epithelium (RPE), choriocapillaris, and death of photoreceptors (PRs) (Bird et al., 2014).
Multiple cell-based therapies are currently under clinical investigation for the treatment of geographic atrophy and fall into two categories: (1) cell replacement strategies that focus on replacing dysfunctional RPE cells; and (2) cell preservation strategies in which transplanted cells provide trophic support to promote multiple aspects of retinal health, including neuronal survival and connectivity (Klassen, 2016; Venugopalan et al., 2016; Zhao et al., 2017). Human umbilical tissue-derived cells (hUTC; palucorcel), harvested from postpartum umbilical cord, that is void of cord blood, are thought to use the latter strategy (Lund et al., 2007). These cells have been successfully tested in a Phase 1/2a, multicenter, open-label, dose escalation, safety study (Ho et al., 2017). A Phase 2b, multicenter, double-masked, randomized study is ongoing to evaluate the safety and clinical response to the subretinal administration of hUTC (www.ClinicalTrials.gov, Identifier NCT02659098).
The therapeutic potential of hUTC administration has also been demonstrated in various animal disease models of stroke (Zhang et al., 2011, 2012, 2013; Jiang et al., 2012; Moore et al., 2013) and in a rat model of retinal degeneration, the Royal College of Surgeons (RCS) rat, which has a loss-of-function mutation in the Mertk gene (Lund et al., 2007). Previous studies, including our recent report, have provided strong evidence that paracrine factors secreted by hUTC enhance functional recovery and protect neurons from progressive degeneration and rescue RPE phagocytic dysfunction (Alder et al., 2012; Koh et al., 2015; Cao et al., 2016).
The factors secreted by hUTC include growth factors and cytokines with general neuroprotective effects. Moreover, hUTC enhance synaptic connectivity and promote neuronal outgrowth by secreting thrombospondin (TSP) family proteins, TSP1, TSP2, and TSP4 (Koh et al., 2015). TSPs induce synaptogenesis by their interaction with their neuronal receptor, the gabapentin receptor α2δ-1 (Eroglu et al., 2009). TSPs and α2δ-1 are also present in adult rodent retina; however, the cell source that provides TSPs in the retina has not been confirmed (Huang et al., 2013; Yafai et al., 2014). Furthermore, the involvement of impaired TSP/α2δ-1 signaling and abnormal synaptic development in the diseased retina has not been explored.
In the brain, astrocytes secrete TSPs to control excitatory synapse formation between neurons (Christopherson et al., 2005). However, retinal astrocytes reside outside of the synaptic layers. Instead, a specialized radial glial cell type, Müller glia (MG), spans the entire neural retina and extends their processes into the synaptic plexiform layers. MG are required for maintenance of PR health and connectivity (Williams et al., 2010); however, molecular mechanisms that underlie MG-neuron interactions are understudied.
In this study, we focused on the effects of hUTC on neural retina and investigated the cellular mechanisms that underlie how subretinal hUTC transplantation rescues vision in the RCS rat. We found that the RCS rat displayed significant deficits in synaptic development and these deficits strongly correlated with early morphological and reactivity changes in the MG and reduced expression of MG-secreted TSP1 and TSP2 and their neuronal receptor, α2δ-1. hUTC transplantation significantly preserved PRs and protected synaptic connectivity. In particular, the multiple hUTC injection paradigm, which provided best visual recovery, also attenuated the reactive changes in MG and specifically protected the α2δ-1-containing synapses. Furthermore, we found that loss-of-Mertk function only in MG of wild-type (WT) rats is sufficient to impair synaptic development and cause activation of MG, similar to what is observed in the RCS rats. Our findings highlight novel cellular and molecular mechanisms within the neural retina, which underlie disease mechanisms and pinpoint MG as an important cellular target for treatment of retinal degeneration.
Materials and Methods
Animal welfare statement.
All animal procedures were conducted according to the ARVO Statement for the Use of Animals in Ophthalmic and Vision Research and in accordance with the institutional animal care and use committee guidelines: Institutional Animal Care and Use Committee Protocol Numbers A-173-14-07, A147-17-06 (Duke University) and Institutional Animal Care and Use Committee 003801 (Cedars-Sinai Medical Center).
hUTC preparation for subretinal injection.
hUTC were isolated and cryopreserved as previously described (Koh et al., 2015). Cryopreserved hUTC (∼31.3 population doublings; 2 × 10⁶ viable cells/ml) were used for the present study. On each day of injection, frozen cells (2 or 3 vials) were thawed at 37°C in a water bath for ∼2 min. Upon thaw, cells were transferred to a single 15 ml conical tube containing 8 ml of balanced saline solution (BSS) Sterile Irrigating Solution (Alcon). An additional 1 ml of BSS was added to the cryovials, and the rinse was subsequently transferred to the 15 ml conical tube. Cells were centrifuged at 250 × g for 5 min at room temperature. The supernatant was removed, and the pellet was resuspended in 5 ml BSS. Cells were counted using a C-Chip Neubauer Improved Disposable Hemocytometer (IN CYTO) to determine the total number of viable cells. Remaining cells were subsequently centrifuged for 5 min at 250 × g. The supernatant was removed, and the cells were resuspended to a final concentration of ∼10,000 cells/μl in BSS. Each cell suspension was transferred from the conical tube to an Eppendorf tube and placed on ice. The time that cells were placed on ice was recorded. This time was used to set a 2 h window to complete the subretinal injections.
Isolation and culture of primary rat retinal ganglion cells (RGCs).
RGCs were purified by sequential immunopanning from P7 (postnatal day 7) Sprague Dawley rat retinas (Charles River) as previously described (Winzeler and Wang, 2013). Briefly, retinas were dissected and dissociated with papain (6 U/ml, Worthington). Dissociated cells were panned first with Bandeiraea Simplicifolia Lectin I (Vector Laboratories) coated Petri dishes to remove immune cells, cell debris, and fibroblasts. The unbound cells were transferred to a Petri dish coated with anti-Thy1 (clone T11D7) antibody for specific isolation of RGCs. The purified RGCs were gently trypsinized and replated onto poly-d-lysine and laminin-coated glass coverslips in 24-well plates (35,000 cells/coverslip). RGCs were cultured in a serum-free growth medium containing B27 (Invitrogen), BDNF, CNTF, insulin, and forskolin (full recipe of the media can be found in Winzeler and Wang, 2013).
Experimental design for subretinal hUTC injection.
Pigmented female and male dystrophic RCS rats (postnatal day P21–P22, P60) were used for the study. Age-matched Long–Evans (LE) rats served as controls. Animals were divided into 6 study groups, with 6 study animals per group (Table 1). All animals were maintained at Cedars-Sinai Medical Center.
Table 1.
Rat groups and subretinal hUTC treatments used in this study
| Group | Animals | Treatment | Day of treatment | Total cells/eye | Injection volume |
|---|---|---|---|---|---|
| 1 | Long Evans | None | — | — | — |
| 2 | RCS | None | — | — | — |
| 3 | RCS | hUTC | P22 | 20,000 | 2 μl |
| 4 | RCS | BSS | P21 | — | 2 μl |
| 5 | RCS | hUTC | P60 | 20,000 | 2 μl |
| 6 | RCS | hUTC | P21 and P60 | 20,000 (P21) | 2 μl (P21) |
| 20,000 (P60) | 2 μl (P60) |
Subretinal injections.
Subretinal injections were performed in RCS rats on P21–P22 (Groups 3 and 4) and P60 (Group 5). Group 6 animals received 2 injections in the same eye. The first injection was administered on P21 and the second injection on P60. All injections were performed in the right eye. The left eyes were not treated. Animals were anesthetized intraperitoneally with 75 mg/kg zetamine (VetOne) and 0.25 mg/kg dexmedetomidine (Zoetis) diluted in bacteriostatic 0.9% NaCl (Hospira). The eye was dilated with 1% tropicamide ophthalmic solution USP (Bausch & Lomb) followed by 2.5% phenylephrine hydrochloride ophthalmic solution (Paragon, BioTek). The eye was stabilized using a nonabsorbable suture (4-0) (Ethicon). The suture was placed behind the equator of the eyeball to pull the eyeball forward and allow for exposure of the dorsal-temporal portion of the eye.
To observe the fundus clearly, Gonak (Hub Pharmaceuticals) was placed on the cornea of the globe. A plastic ring was subsequently placed on the eyelid to keep the Gonak in place. A scissor was used to cut away conjunctiva, and a 30 ½ G metal needle was used to make a sclerotomy at upper temporal region of the eye; 2 μl cell suspension was drawn into a sterile glass pipette (internal diameter 50–150 μm) via a plastic tube filled with BSS that was attached to a 25 μl Hamilton syringe. To reduce intraocular pressure and to limit the efflux of cells, the cornea was punctured using a 30 ½ G metal needle. Cells or BSS (2 μl volume) were injected through the site of the sclerotomy. Immediately after injection, the fundus was examined for retinal damage or signs of vascular distress. The wound was sutured with a nonabsorbable surgical suture (10-0) (Ethicon). The suture around the eyeball was removed, and then the eyelid was put into its normal position. Finally, 0.5% erythromycin ophthalmic ointment (Bausch & Lomb) was used locally. Rats were given 1 mg/kg atipamezole (Orion) intraperitoneally to reverse the effects of the dexmedetomidine. The animals recovered from anesthesia on warm pads (37°C) before they were returned to their holding room. Animals that received hUTC and BSS injections received daily dexamethasone (Fresenius Kabi) injections (1.6 mg/kg, i.p.) for 2 weeks following the subretinal procedure. Additionally, these animals received cyclosporine-A (Teva Pharmaceuticals) in their drinking water (210 mg/L) throughout the course of the entire experiment.
Visual function assessments.
All animals were tested for spatial visual acuity at different predetermined time points (P30/31, P60, and P88-P93) using an optomotor testing apparatus (Cerebral Mechanics) as previously described (Prusky et al., 2004; Lund et al., 2007). Optokinetic response (OKR) allowed for noninvasive gross measures of visual acuity as a function of reflexive image stabilization.
Luminance threshold (LT) recordings were performed on 3 animals from each group on P90-P95, as previously described (Girman et al., 2005). Recordings were made from both the treated and untreated eyes. Briefly, animals were anesthetized, a small skin incision was made over the superior colliculi (SC), and 15–20 openings were drilled through the skull over the area of the SC dorsal projection. Glass-coated tungsten microelectrodes (resistance: 0.5 mΩ; bandpass 500 Hz to 5 kHz) were introduced through the openings into the SC. The brightness of a 5° spot was varied using neutral density filters (minimum steps of 0.1 log unit) over a baseline level of 5.2 log units until a response double the background activity was obtained: this was defined as the threshold level for that point on the visual field. A total of 15 positions were recorded from each SC. Data were expressed as a graph of percentage of the SC area with a LT below defined levels.
Retina preparation for immunohistochemistry (IHC).
After visual function assessments, the retinas from LE and RCS rats were collected. Animals were terminated on P94-P96 by CO2 asphyxiation, followed by bilateral pneumothorax. Eyes were removed and immersed in 2% PFA for 1 h and subsequently infiltrated with 10%, 20%, and 30% sucrose. Eyes were maintained in each solution for 1 h at room temperature and then transferred to 4°C overnight in 30% sucrose. Eyes were embedded in OCT (frozen tissue matrix) and cut in sequence (10 μm horizontal sections apart) on a cryostat. Every sixth section was placed on the same slide as the first section, and a total of four sections (50 μm apart) were collected per slide. A total 40–50 slides/eye were cut.
For the IHC analyses during development, age-matched LE and RCS retinas (P14, P21, and P30) were collected by intracardially perfusing with TBS (25 mm Tris-base, 135 mm NaCl, 3 mm KCl, pH 7.6) supplemented with 7.5 μm heparin followed with 4% PFA (Electron Microscopy Sciences) in TBS. The eyes are enucleated and lens was removed by making an incision in the cornea. The eyecups were fixed with 4% PFA in TBS for 2 h at room temperature. The eyecups were cryoprotected with 30% sucrose in TBS overnight and were then embedded in OCT (Tissue-Tek) compound and frozen.
Identification of synapses by immunocytochemistry.
Retina sections were washed three times and then permeabilized in PBS with 0.4% Triton X-100 (PBST; Roche) at room temperature. Sections were blocked in 5% NGS, normal donkey serum, or BSA in PBST for 1 h at room temperature. Primary antibodies (mouse anti-Bassoon 1:500 [RRID:AB_10618753, ADI-VAM-PS003-F, Enzo], rabbit anti-mGluR6 1:150 [RRID:not applicable, RA13105, Neuromics], guinea pig anti-VGlut1 1:750 [AB5905, Millipore], rabbit anti-PSD95 1:500 [RRID:AB_87705, 51-6900, Invitrogen], mouse anti-Gephyrin 1:250 [RRID:AB_1279448, 147-021, Synaptic Systems], goat anti-TSP1 1:200 [RRID:AB_2201958, AF3074, R&D Systems], goat-anti-TSP2 1:200 [RRID:AB_2202068, AF1635, R&D Systems], mouse anti-glutamine synthetase 1:1000 [RRID:AB_397879, 610517, BD Biosciences], rabbit anti-SOX9 1:4000 [RRID:AB_2239761, AB5535, Millipore], goat anti-ChAT[RRID:AB_11214092, AB144P, Millipore], rabbit anti-α2δ-1 [RRID:AB_258885, C5105, Sigma-Aldrich]), rabbit anti-α2δ-1 [RRID:AB_2039785, ACC-015, Alomone Labs], and rabbit anti-GFAP [RRID:AB_10013382, Z033429-2, Dako] were diluted in 5% NGS or 5% BSA containing PBST. Sections were incubated overnight at 4°C with primary antibodies. For TSP staining, the primary antibodies were incubated for 48 h at 4°C as previously described (Huang et al., 2013). Secondary Alexa-fluorophore-conjugated antibodies (Invitrogen) were added (1:200 in PBST with 5% NGS or 5% BSA) for 2 h at room temperature. Slides were mounted in Vectashield with DAPI (Vector Laboratories), and images were acquired on a Leica SP5 and SP8 confocal laser-scanning microscopy.
Quantification of synapses (synapse analysis).
Three or four animals per age of LE or RCS were used for synapse analysis. Three independent retina sections per each group of treatments (Groups 1–6) or age (P14, P21, and P30) were used for IHC. The 5-μm-thick confocal z stacks (optical section depth 0.33 μm, 15 sections/z stack) of the retinas were imaged at 63× magnification on a Leica SP5 confocal laser-scanning microscope. Maximum projections of three consecutive optical sections (corresponding to 1 μm total depth) were generated from the original z stack. Analyses were performed blind as to strain and/or treatments. The Puncta Analyzer plugin (written by Barry Wark, available upon request from C.E.; c.eroglu@cellbio.duke.edu) for ImageJ 1.29 (National Institutes of Health; http://imagej.nih.gov/ij/; version ImageJ 1.29 is available at https://sites.duke.edu/eroglulab/quantification-of-synapses/) was used to count the number of colocalized puncta. This quantification method is based on the fact that presynaptic and postsynaptic proteins (e.g., VGluT1 and PSD95) are not within the same cellular compartments of neurons (axons vs dendrites, respectively) and would only appear to partially colocalized at synaptic junctions due to their close proximity. This quantification method yields an accurate estimation of the number of synapses both in vitro and in vivo because it measures colocalization as opposed to staining of a single presynaptic or postsynaptic protein because synaptic proteins also often accumulate in extrasynaptic regions during the course of their life cycle. In agreement, numerous previous studies by us and others showed that synaptic changes observed by this quantification method is verified by techniques such as EM and electrophysiology (Christopherson et al., 2005; Eroglu et al., 2009; Kucukdereli et al., 2011; Allen et al., 2012; Risher et al., 2014; Koh et al., 2015; Singh et al., 2016). Details of the quantification method have been described previously (Ippolito and Eroglu, 2010). Briefly, 1-μm-thick maximum projections are separated into red and green channels, backgrounds are subtracted (rolling ball radius = 50), and thresholds are determined to detect discrete puncta without introducing noise. Minimum pixel size of puncta was set as 4 to remove any background noise. The Puncta Analyzer plugin then uses an algorithm to detect the number of puncta that are in close proximity across the two channels, yielding quantified colocalized puncta. To calculate percentage of WT colocalization, colocalized puncta values for WT were averaged, then all image values (WT and KO) were converted to percentage of the calculated WT average.
TUNEL assay.
To detect degenerative PRs, apoptotic cells were detected by TUNEL (In Situ Cell Death Detection Kit, Roche) staining according to the manufacturer's protocol. Briefly, cryosectioned (10–12 μm) retina was washed with PBS for 30 min and permeabilized in 0.1% Triton X-100 for 2 min on ice. The slides were washed twice with PBS followed by incubation with TUNEL reaction mixture for 6 min at 37°C in the dark. The slides were washed three times with PBS and mounted in Vectashield with DAPI (Vector Laboratories). The images of TUNEL-positive cells were acquired on a Leica SP5 confocal laser-scanning microscope.
RNA FISH.
A set of FISH probes targeting either rat Thbs1 or Thbs2 was purchased from Stellaris (LGC Biosearch Technologies). Each probe set was composed of 48 oligonucleotides (20 nucleotides each) that selectively bind to transcripts of either TSP1 (Thbs1) or TSP2 (Thbs2). The probe sets were labeled with fluorescent dye CAL Fluor Red 610 or Quasar 670, for Thbs1 or Thbs2, respectively. Briefly, 10 μm retina sections were fixed with 4% PFA for 15 min and washed twice with PBS containing RNase inhibitor (Invitrogen). The sections were permeabilized with ethanol for 2 h at room temperature. After wash and rehydration with PBS, the sections were sequentially incubated with primary (mouse anti-glutamine synthetase [GS], 1:200) and secondary (anti mouse-IgG AlexaFluor-488, 1:200) antibodies for 1 h at room temperature with PBS washes between steps. After immunostaining, the sections were postfixed with 4% PFA for 15 min at room temperature followed by a PBS wash. Then, RNA FISH was performed following the manufacturer's recommended protocol.
CRISPR/SaCas9-mediated ablation of MER receptor tyrosine kinase (MERTK), adeno-associated virus (AAV) design, virus production, and intravitreal injection.
To ablate Mertk gene specifically in MG, we purchased Clustered Regularly Interspaced Short Palindromic Repeats (CRISPR)/SaCas9 vector from Addgene (pX601, Plasmid #61591) and cloned an sgRNA (GCTGGATGTGATCTTCCAGTC) targeting rat Mertk gene between BsaI sites. AAVs containing CRISPR/SaCas9 were produced by the Duke Viral Vector Core using MG-specific capsid (ShH10) from Dr. John Flannery (University of California–Berkley) (Klimczak et al., 2009).
To verify that designed sgRNA targeted Mertk locus and disrupted MERTK expression, cortical astrocytes or retinal glia were isolated from P1 Sprague Dawley rat pups using standard methods as described by (McCarthy and de Vellis, 1980). The 2 × 10⁶ cells in a 10 cm dish were transduced with AAV-CRISPR/SaCas9. We verified CRISPR/SaCas9-mediated genome excision, first by conducting T7 endonuclease I assay (T7E1). To do so, rat genomic DNA was isolated from cortical or retinal astroglial cultures at day 3 after transduction, and ∼1100 bp of genomic region around sgRNA target site was amplified by PCR using the following primers: forward, TCGTGTGGGTGAGGCAGTGTTC; and reverse, CATGCTCAAGGCTCTGGGTTCC. The PCR amplicon was then subjected to T7E1 assay to verify cleavage, and the mutations visualized by the T7E1 assay were further confirmed by sequencing.
P7-P10 LE pups were used for intravitreal injections; then, retinas were collected at P21 and P45. A total of 2 μl containing 1 × 10¹² vg/ml of AAV-CRISPR was intravitreally injected per eye using 5 μl Hamilton syringes.
Preparation of retinal glia-conditioned media.
Retinal glia were isolated from P1 Sprague Dawley pups and cultured as previously described (McCarthy and de Vellis, 1980; Trachtenberg and Packey, 1983). Retinal glia were grown in 10 cm tissue culture dishes (Corning) and treated with 5 μl of 1 × 10¹² vg/ml AAV viral particles, then incubated overnight. At day 5 after transduction, the retina glia were washed twice with warm DPBS (Invitrogen) and 10 ml of conditioning media, composed of DMEM (Invitrogen) supplemented with l-glutamine (2 mm, Invitrogen), sodium pyruvate (1 mm, Invitrogen), penicillin (100 U/ml), and streptomycin (100 μg/ml, Invitrogen), was added to each dish. Media were conditioned for 5 d, then collected and concentrated 10 times by using 5 kDa molecular weight cutoff Vivaspin 20 centrifugal concentrators (Sartorius). The protein concentration of each conditioned media was measured by the standard BCA assay (Thermo Scientific) following the manufacturer's recommendations. Aliquots of retinal glia-conditioned media in low protein-binding tubes (Eppendorf) were rapidly frozen in liquid nitrogen and were stored at −80°C until use.
Retinal glia RGC coculture experiments.
For neuron/glia coculture experiments, 150,000 retinal glial cells were seeded into transwell inserts in growth media, described above. The next day, these cells were treated with AAV-CRISPR containing either control or Mertk-targeting sgRNA. At day 5 after transduction, retina glia were treated with hUTC-conditioned medium (UCM) prepared as previously described (Koh et al., 2015) for 3 d before coculture. On the day of coculture, the inserts with cells were washed twice with DPBS, then medium was replaced with RGC growth media. Transwell inserts were transferred into 24-well plates with 4 DIV RGCs that were grown on glass coverslips. The RGCs and retinal glial cells were then cocultured for 6 d to allow for synapses to form between cells. RGCs cultured alone (without inserts) served as a control.
Western blot analysis.
Either retinal glia-conditioned media or glial cell lysates were used for Western blot analysis. The conditioned media were prepared as described above. Whole-cell lysates were prepared using RIPA lysis buffer supplemented with protease inhibitor (Sigma-Aldrich). Protein concentration was determined for each sample by standard BCA assay (Thermo Scientific), and 20 μg of protein from each sample was boiled at 95°C for 5 min. Proteins were separated in 10% SDS-PAGE gels (Bio-Rad) and were then transferred onto PVDF membranes (Millipore). To detect protein expression, goat anti-TSP1 (1:250, RRID:AB_2201958), TSP2 (1:250, RRID:AB_2202068) (R&D Systems), mouse anti-GS (1:1000, RRID:AB_397879, BD Biosciences), goat anti-MERTK (1:250, RRID:AB_2098563, R&D Systems), and rabbit anti-GFAP (1:2000, RRID:AB_10013382, Dako) were used. HRP-conjugated anti-goat antibody (1:5000, RRID:AB_357236, R&D Systems) or, fluorescent anti-goat antibody (1:5000, RRID:AB_2650427, LI-COR Biosciences) was used as secondary antibody. The detection was performed with an ECL Western Blotting Analysis System kit (GE Healthcare) or Odyssey System (LI-COR Biosciences).
Statistical analysis.
Statistical analyses of the quantified data were performed using Student's t test or one-way ANOVA followed by post hoc test (Tukey's HSD), if applicable. For luminance threshold analyses, we performed Levene's test for homogeneity of variance to confirm that the variances of different groups were the same and then we applied Tukey's HSD multiple comparisons. JMP Genomics Pro 13.0 software (SAS) was used for all statistical analysis of the data. All data were expressed as mean ± SEM.
Results
Recovery of visual function by subretinal hUTC transplantation depends on the time of cell administration
A previous study demonstrated that subretinal transplantation of hUTC on P21 recovers visual function in the RCS rats (Lund et al., 2007). The therapeutic effects of hUTC transplantation were gained without transdifferentiation of transplanted cells into retinal cells. This observation suggested that hUTC support visual function recovery via paracrine effects that promote the health and function of the retinal cells. To achieve a better understanding of the cellular and molecular mechanisms involved in therapeutic effects of these cells on visual function, we first questioned whether it is necessary to administer hUTC to the RCS rats within a specific period of time to observe benefits. Furthermore, we also tested whether the therapeutic benefits of this treatment could be enhanced by repeated cell administration. To do so, we compared the efficacy of hUTC injection at two different time points: P21 and P60. Cryopreserved hUTC were freshly thawed and prepared on the day of transplantation at 10,000 cells/μl in BSS and then subretinally injected to right eyes of RCS rats on P21 (G3), P60 (G5), or both at P21 and P60 (G6) (Fig. 1A). Left eyes did not receive any treatment. All rats were under immunosuppression to eliminate the effects of cell transplantation-driven immune response to the experimental outcomes. Age-matched LE (G1), RCS rats receiving no treatment (G2), and RCS rats receiving vehicle (i.e., BSS only, G4) served as controls. Visual function was assessed by measuring the OKR on P30, P60 and P90 followed by luminance threshold response (LTR) on P90–P95. Following LTR testing, the retinas were collected for IHC analyses.
Figure 1.

Recovery of visual function by subretinal hUTC transplantation depends on cell injection on P21. A, Schematic representation of the experimental design. hUTC were injected into the subretinal space on P21 and/or P60. Visual function recovery was assessed on P30, P60, and P90–P95, and then retina samples were harvested from the same animals on P95. B, OKR tests demonstrated that left eyes without injection showed progressive loss of vision in RCS rats. C, Right eyes of RCS rats that received hUTC subretinally on P21 alone (G3) or on P21 and P60 (G6) demonstrated vision responses that were comparable with healthy control LE rats (G1), whereas the vehicle control group (BSS, G4) or P60 hUTC-treated group (G5) progressively lost visual function similar to that of untreated controls (G2). D, OKR results of right eyes on P90 demonstrate that G3 and G6 had significantly improved visual function. p < 0.05 (one-way ANOVA and Tukey's post hoc test). Different letters are statistically different. E, LTR on P90–P95 demonstrated that the superior colliculus of G6 animals was significantly more responsive to light stimuli than animals in G3. Data are mean ± SEM. OKR tests were performed in all animals in each group (n = 6). Luminance recordings were performed on 3 animals in each group.
OKR testing did not reveal any significant differences in visual function among the 6 study groups on P30 or P60; however, by P90 untreated RCS rats (G2), the vehicle-injected group (G4) and those RCS rats treated with cells on P60 (G5) showed significant vision loss. On the other hand, RCS rats receiving subretinal hUTC transplantation once on P21 (G3) or twice on P21 and P60 (G6) showed optokinetic responses that were equivalent to healthy LE rats (Fig. 1C,D; one-way ANOVA (F(5,66) = 16.7772, p < 0.0001) and Tukey's post hoc test). The left eyes (without treatment) from all RCS animals displayed impaired visual function at P90 (Fig. 1B).
To evaluate the effects of hUTC transplantation on retinal synaptic function, we measured the retinal response to light stimuli by recording luminance thresholds (LTRs) from the superior colliculus, a brain region that receives direct synaptic inputs from the RGCs. LTRs were performed as previously described (Girman et al., 2005). Interestingly, the retinas of G6 (repeated injections at P21 and P60) demonstrated significantly lower luminance thresholds and broader area under the curve than G3 (single injection at P21, Tukey's HSD, p = 0.003) and G4 (vehicle-injected P21, Tukey's HSD p = 0.002) at all the luminance levels (Fig. 1E).
Collectively, these results demonstrate that it is critical to inject hUTC at an early stage of retinal degeneration to maximize vision preservation in RCS rats, and the therapeutic effects of hUTC transplantation are enhanced by repeated injections.
hUTC treatment prevents PR apoptosis and delays outer nuclear layer (ONL) degeneration
Why is it critical to inject hUTC at P21 to have a therapeutic effect? We hypothesized that in this model it is necessary to conduct hUTC transplantation before significant PR cell loss occurs. The progressive PR loss in RCS rats has been extensively characterized with PR death first detected as early as P22 (Dowling and Sidman, 1962). Few TUNEL-positive “apoptotic” cells appear at P20, and notable TUNEL-positive PR cell staining is observed by P25 (Tso et al., 1994).
To determine the detailed timeline of retinal degeneration in this rat model, we collected and quantitatively analyzed RCS and LE retinas from untreated animals at different time points between P14 (early postnatal development, shortly after eye-opening) and P90 (late stages of the degenerative process). As previously noted, occasional apoptotic PR nuclei are present at P21 in the RCS rats, but thickness of the ONL, where the PRs reside, does not significantly differ from that of LE control rats at this time (Fig. 2A). On the other hand, we found a significant loss of ONL thickness and extensive TUNEL-positive PRs in RCS rat retinas at P30 compared with LE retinas (Fig. 2B,D; Student's t test, p < 0.0001). The majority of the PRs are lost in RCS rats by P60 (Fig. 2C,D; Student's t test, p < 0.0001). These results show that significant PR apoptosis and loss starts to occur between P21 and P30 in the RCS retinas. We next investigated how subretinal hUTC administration affects the PR cell layer thickness and TUNEL positivity at P95. We found that hUTC injection on P21 (G3) or repeated administrations on P21 and P60 (G6) both delay PR loss as demonstrated by a significant increase in ONL thickness compared with the vehicle-injected RCS group (G4 on P95 (Fig. 2E,F; one-way ANOVA, p < 0.0001). However, significant PR loss still occurs in these rats compared with WT LE controls at P95 (Fig. 2E,F; one-way ANOVA, p < 0.0001). Notably, many of the remaining PRs in the vehicle-injected RCS rat retinas are TUNEL-positive; however, hUTC transplantation significantly reduces the density of TUNEL-positive cells (Fig. 2E,G; one-way ANOVA, p < 0.0001). Repeated administration of hUTC at P21 and P60 further diminishes TUNEL positivity in the PR layer (Fig. 2G; one-way ANOVA, p < 0.0001). Together, these results show that hUTC administration at P21 is critical for preserving PRs in the RCS rat. These results also indicate that preservation of visual function triggered by hUTC administration is at least in part due to protection of PR numbers and health.
Figure 2.

RCS PR loss begins between P21 and P30, and P21 hUTC injection preserves RCS PRs. Representative images of retinal sections stained with TUNEL (green) revealing apoptotic PRs in DAPI-counterstained (blue) sections at (A) P21, (B) P30, and (C) P60. D, Quantitative analysis of relative ONL thickness of RCS normalized to age-matched controls (LE) showed significant PR loss between P21 and P30. E, Subretinal hUTC injection delayed PR loss in the RCS rat as demonstrated by increased ONL thickness and decreased TUNEL-positive PRs (green) in RCS+hUTC P21 and P60 compared with RCS+BSS. F, Quantification of the relative change in ONL thickness. G, Quantification of TUNEL-positive PR density in ONL. Data were obtained from a minimum of 3 animals of either sex and expressed as mean ± SEM. *p < 0.05, ***p < 0.0001.
Deficits in synapse development precede retinal degeneration in the RCS rat
Synaptic dysfunction and synapse loss are known to accompany retinal degeneration in the RCS rats (Gründer et al., 2001; Peng et al., 2003; Cuenca et al., 2005). However, it is not yet clear whether synapses are formed normally in these rats and then are lost during the degenerative process, or whether synapse development is already impaired in RCS retinas. Furthermore, previous findings suggest that the therapeutic effects of hUTC are mediated via paracrine effects (Lund et al., 2007), and hUTC-secreted factors enhance synaptic connectivity in vitro (Koh et al., 2015). Therefore, next we tested whether synaptic development is normal or impaired in the RCS rat retinas. To do so, we quantitatively analyzed the number of synapses in the RCS retinas compared with age-matched WT LE controls at P14 (before PR loss), P21 (onset of PR death), and P30 (after significant PR death has already occurred).
The neural retina is a well-organized structure with three distinct cellular layers, namely, the ONL, inner nuclear layer (INL), and the ganglion cell layer, respectively). Neurons that reside in each of these layers are connected with each other through stereotypical synaptic contacts located within the synaptic zones known as outer and inner plexiform layers (OPL and IPL, respectively) (Fig. 3A). To determine the number of synapses formed in these layers, we visualized and quantified the synapses by the colocalization of synapse type-specific presynaptic (green) and postsynaptic (red, excitatory; blue, inhibitory) markers using a previously standardized method (Ippolito and Eroglu, 2010). This method takes advantage of the fact that presynaptic and postsynaptic proteins are not in same cellular compartments (axons and dendrites, respectively), but they come in close proximity at synapses, and thus appear to colocalize when imaged at the resolution level of light microscopy.
Figure 3.

Synaptic development is impaired in RCS rats preceding PR loss. A, Schematic representation of the retinal layers. Presynapse (green) and postsynapse (red represents excitatory; blue represents inhibitory) are labeled in the synaptic layers. B, Representative images of the OPL with the PR ribbon synapses labeled for Bassoon (green) and mGluR6 (red) from LE (healthy) and RCS (degenerative) retinas on P14, P21, and P30. C, Quantification of ribbon synapses in the OPL between P14 and P30 revealed that synapse development in the RCS was already impaired on P14. D, Representative images of the IPL with the bipolar excitatory synapses labeled for VGluT1 (green) and PSD95 (red) from LE (healthy) and RCS (degenerative) retinas at P21. E, Quantification of bipolar excitatory synapses in the IPL between P14 and P30 revealed that synapse development in the RCS rat is compromised between P14 and P21. F, Representative images of the IPL with the excitatory and inhibitory synapses labeled for Bassoon (pre, green), PSD95 (excitatory post, red), and Gephyrin (inhibitory post, blue) from LE (healthy) and RCS (degenerative) retinas at P21. Quantification of (G) excitatory and (H) inhibitory synapses formed in the IPL between P14 and P30 revealed that deficits in excitatory synapse development occurred before deficits in inhibitory synapses. To demonstrate that the overlap in VGlut1 and PSD95 puncta is specific to synapses and is not due to random chance in densely stained tissue, confocal z stacks were split into two channels (VGlut1 and PSD95), the PSD95 channel was rotated 90° out of alignment, then the two channels were remerged and analyzed for apparent colocalization of presynaptic puncta. I, Representative LE retina IHC image of fixed (original) and rotated image. J, For both LE and RCS rat retinas, overlap frequency was significantly decreased in the rotated images compared with the original images. Data were obtained from a minimum of 3 animals of either sex and expressed as mean ± SEM. *p < 0.05.
In the OPL, the PRs form excitatory ribbon synapses onto the bipolar interneurons. We analyzed the number of OPL ribbon synapses by quantifying the colocalization of presynaptic Bassoon (green) and postsynaptic mGluR6 (red) puncta in age-matched LE and RCS retinas (Fig. 3B). We found that the number of OPL ribbon synapses in RCS retinas is significantly reduced compared with age-matched LE rats at all the time points analyzed (i.e., P14, P21, and P30; Fig. 3C; Student's t test, p = 0.0084). This result shows that ribbon synapse development in the OPL of RCS rats is already diminished at P14 and P21, before significant PR death occurs.
Vision-driven synaptic signals from PRs are relayed by bipolar cells of the INL. Bipolar cells project their axons into the IPL to provide presynaptic excitatory inputs onto the dendrites of RGCs (Fig. 3A). To determine whether the development of IPL bipolar cell synapses between bipolar cells and RGCs is also altered in the RCS rats, we marked these synapses by using vesicular glutamate transporter 1 (VGluT1, green) and postsynaptic density protein 95 (PSD-95, red) as presynaptic and postsynaptic markers, respectively (Fig. 3D). We found that similar to OPL, the IPL bipolar cell synapse development is also impaired in the RCS rat (Fig. 3E; P21 p = 0.0024 and P30 p < 0.0001, Student's t test). Interestingly, in the LE retinas, the density of bipolar cell synapses increases dramatically between P14 and P21, whereas in the RCS rat retinas this rapid synaptic growth does not take place (Fig. 3E). Together, these results show that both OPL and IPL excitatory synapse development is negatively affected in the RCS rats. These results also show that impairments in synaptic development precede significant PR loss, indicating a possible involvement of synaptic dysfunction in the onset of retinal degeneration.
In addition to VGluT1-positive bipolar cell synapses, IPL hosts a large number of other synaptic connections. Therefore, we further characterized the deficits of synaptic development in the IPL of the RCS rats by staining the retinas with the presynaptic marker Bassoon, which marks both excitatory and inhibitory presynapses, in combination with antibodies specific for excitatory (PSD95) and inhibitory (Gephyrin) postsynapses (Fig. 3F). We quantified the number of excitatory and inhibitory synapses by counting the colocalization between Bassoon/PSD-95 or Bassoon/Gephyrin, respectively. We found no significant differences in the numbers of either excitatory or inhibitory synapses between LE and RCS rats at P14 (Fig. 3G, p = 0.2981; Fig. 3H, p = 0.6730, Student's t test). However, at P21, there is a sharp reduction in the numbers of excitatory synapses in the RCS rats, whereas the number of inhibitory synapses is comparable with LE controls (Fig. 3G, p < 0.0001; Fig. 3H, p = 0.1840, Student's t test). By P30, we observed significantly fewer excitatory and inhibitory synapses in the RCS rat compared with LE controls (Fig. 3G, p = 0.0492; Fig. 3H, p < 0.0001, Student's t test). To ensure that the colocalization we observe between presynaptic and postsynaptic markers are specific and are not due to chance, we reanalyzed the same images after we randomized the puncta by rotating one channel 90° with respect to the other. In the randomized images, the colocalization was sharply diminished, confirming that the VGluT1/PSD95 overlap we observe is not due to random chance (Fig. 3I,J; one-way ANOVA, p < 0.0001). These results show that formations of multiple classes of synapses are altered in the RCS rats. The excitatory synapse development is impaired before P21, whereas inhibitory synapses are affected by P30, only after significant PR death occurs.
The synaptic connections of the IPL can be approximately divided into two sublayers, namely, the ON and OFF layers (Fig. 4A), based on the response of these synaptic connections to light stimuli (Werblin and Dowling, 1969; Hoon et al., 2014). To determine whether the synaptic deficits we observed in P21 RCS rat retinas were specific to one of these sublayers, we quantified the numbers of synapses formed in ON and OFF layers at P21. These sublayers were identified by costaining one of the presynaptic markers, Bassoon, with ChAT (Fig. 4F). The excitatory or inhibitory synapses located in S1-S2 and S3-S5 were categorized as ON and OFF layer synapses, respectively. Our results demonstrated that excitatory synaptic development is impaired concurrently in both ON and OFF layers (Fig. 4B,D; Student's t test, p < 0.0001); however, there were no significant differences in the number of inhibitory synapses in either sublayer (Fig. 4C, p = 0.3374; and Fig. 4E, p = 0.4045, Student's t test), paralleling the results obtained from the entire IPL (Fig. 3H).
Figure 4.

Synapses in both on- and off-sublaminae layers are developmentally impaired. A, Representative images in the IPL with the excitatory and inhibitory synapses labeled for Bassoon (pre, green), PSD95 (excitatory post, red), and Gephyrin (inhibitory post, blue) from LE (healthy) and RCS (degenerative) retinas on P21. OFF and ON layers were identified by layered enrichment of Bassoon. Excitatory synapse quantification shows both (B) OFF and (D) ON layer have reduced number of synapses in RCS rats on P21, although there were no significant changes in the number of inhibitory synapses formed in both (C) OFF and (E) ON layers. F, Representative P21 LE retina image of IPL costained with antibodies against Bassoon (green) and ChAT (red). Data were obtained from a minimum of 3 animals of either sex and expressed as mean ± SEM. *p < 0.05.
Collectively, these results illustrate that excitatory synaptic development in RCS rat retinas is impaired by P21, before the onset of significant retinal degeneration. The deficits in excitatory synaptic development occur in both the OPL and IPL. Furthermore, these results suggest that signaling mechanisms that control retinal synapse development is impaired in the RCS rat retinas.
MG exhibit altered morphology during early development preceding PR loss
Astrocytes are powerful controllers of excitatory synapse formation in the brain by secreting multiple synaptogenic factors, including TSPs (Christopherson et al., 2005; Eroglu et al., 2009). However, in the retina, the MG undertake astrocyte-like functions by extending their processes into the synaptic plexiform layers and positioning themselves at close proximity to the axons and dendrites. The MG processes span the retina and infiltrate the plexiform layers to clear synaptically released neurotransmitters and to maintain ion homeostasis. MG cellular processes can be labeled by staining with an antibody specific for GS (an important enzyme that is required for the ability of MG to convert glutamate to glutamine to be shuttled back to neurons), and the MG cell nuclei can be visualized by staining with an antibody against SOX9 (SRY-box 9; Fig. 5A).
Figure 5.

MG exhibit reactive morphology during early development preceding PR loss in the RCS rat. A, Schematic representation of the retinal layers and MG. Processes (GS, green) and nuclei (SOX9, red) of MG are labeled by IHC at (B) P14 and (C) P21. Representative pictures of GS+ MG processes in (D) OPL and (E) IPL. The percentages of area covered by MG processes are reduced in both (F) OPL and (G) IPL in RCS rat. H, Number of SOX9+ cell bodies and (I) distance between SOX9 cell bodies were increased in RCS rats, suggesting proliferative changes of MG. Data were obtained from a minimum of 3 animals of either sex and expressed as mean ± SEM. *p < 0.05.
Previous studies showed that, in the RCS retinas, MG progressively become “reactive” during the course of retinal degeneration (Härtig et al., 1995; Dyer and Cepko, 2000; Wang et al., 2005; Zhao et al., 2010; Fernández-Sánchez et al., 2015; Hippert et al., 2015). For example, analysis of retinal sections from RCS rats at P1 through P100 showed that MG become positive for GFAP as early as P35 (Kimura et al., 2000), an indication that reactive gliosis is initiated in RCS retinas at this age. On the other hand, no significant changes in the overall expression levels of GS were detected in RCS rats compared with healthy controls (Kimura et al., 2000). However, whether the number, distribution, and morphology of the MG are affected in RCS rats before the onset of GFAP expression is not known. To determine whether there are early changes in the MG of the RCS rats, preceding the onset of neuronal death, we immunostained age-matched LE and RCS retinas with antibodies against MG-specific markers, GS and SOX9, at P14 and P21. This analysis revealed that during the third week of postnatal development (P14-P21), the GS+ MG processes become more arborized within the synaptic layers in LE rats; however, this arborization is impaired in the RCS rat (Fig. 5B–E). We further analyzed the GS+ MG process infiltration into the synaptic layers at P21 by quantifying the percentage area of the plexiform neuropil covered by GS+ staining. We found that the percentage coverage of the neuropil by MG processes is significantly reduced in the IPL and trended toward a decrease in the OPL (Fig. 5F, p < 0.0001; and Fig. 5G, p = 0.0351, Student's t test) of the RCS rats compared with LE controls. Furthermore, we found a significant increase in the number of MG (marked by SOX9) in the RCS rat retinas compared with LE WT rats (Fig. 5H; Student's t test, p = 0.0351), and the SOX9+ nuclei appeared to have a disorganized distribution within the INL (Fig. 5C). In agreement with this, we found that the SOX9+ cell nuclei were more broadly distributed within the INL, as determined by a slight, but statistically significant, increase in the average distance from the mean SOX9+ nuclei position in the INL (Fig. 5I; Student's t test, p = 0.0012). Together, these findings indicate that MG in RCS rats display morphological and proliferative changes at P21, preceding significant PR loss. These changes in RCS MG coincide with the impaired synaptic development in these rats, suggesting that early activation of MG is linked to observed synaptic abnormalities.
Synaptogenic TSP1 and TSP2 are produced by MG, and their expression is reduced in the RCS rat retinas
We hypothesized that the synaptogenic signaling mediated by MG in the RCS rat retina is hampered, resulting in failure to promote synaptic development. Astrocyte-secreted TSP family proteins play an important role in excitatory synapse formation in the brain (Christopherson et al., 2005), and it has previously been reported that TSP-1 is also secreted by cultured MG in vitro (Yafai et al., 2014). Furthermore, IHC analyses of rat retina revealed the presence of TSP1 and TSP2 in the adult retina (Huang et al., 2013). TSPs are secreted proteins, and the signals for the proteins do not necessarily colocalize with the cell type that produces them. Therefore, to verify whether MG produce TSP1 and TSP2 in the rat retina, we used a combined approach of IHC and RNA FISH. We coimmunolabeled P21 LE retinal sections with an antibody against GS to mark MG and specific RNA FISH probes to localize the mRNAs that translate TSP1 and TSP2 (Thbs1 and Thbs2, respectively). The results demonstrated that, in the INL, where MG cell bodies are located, both Thbs1 and Thbs2 mRNAs are localized to the cytoplasm of GS+ cells (Fig. 6A). Interestingly, we also found Thbs1 and Thbs2 to be highly enriched within the GS+ MG processes in the OPL (Fig. 6B). These results confirm that mRNAs for TSP1 and TSP2 are produced by MG in the rat retina. These results also suggest that Thbs1 and Thbs2 mRNAs, which are present in perisynaptic MG processes, are locally translated for direct secretion of TSPs into the OPL to control retinal synapse formation and maintenance.
Figure 6.
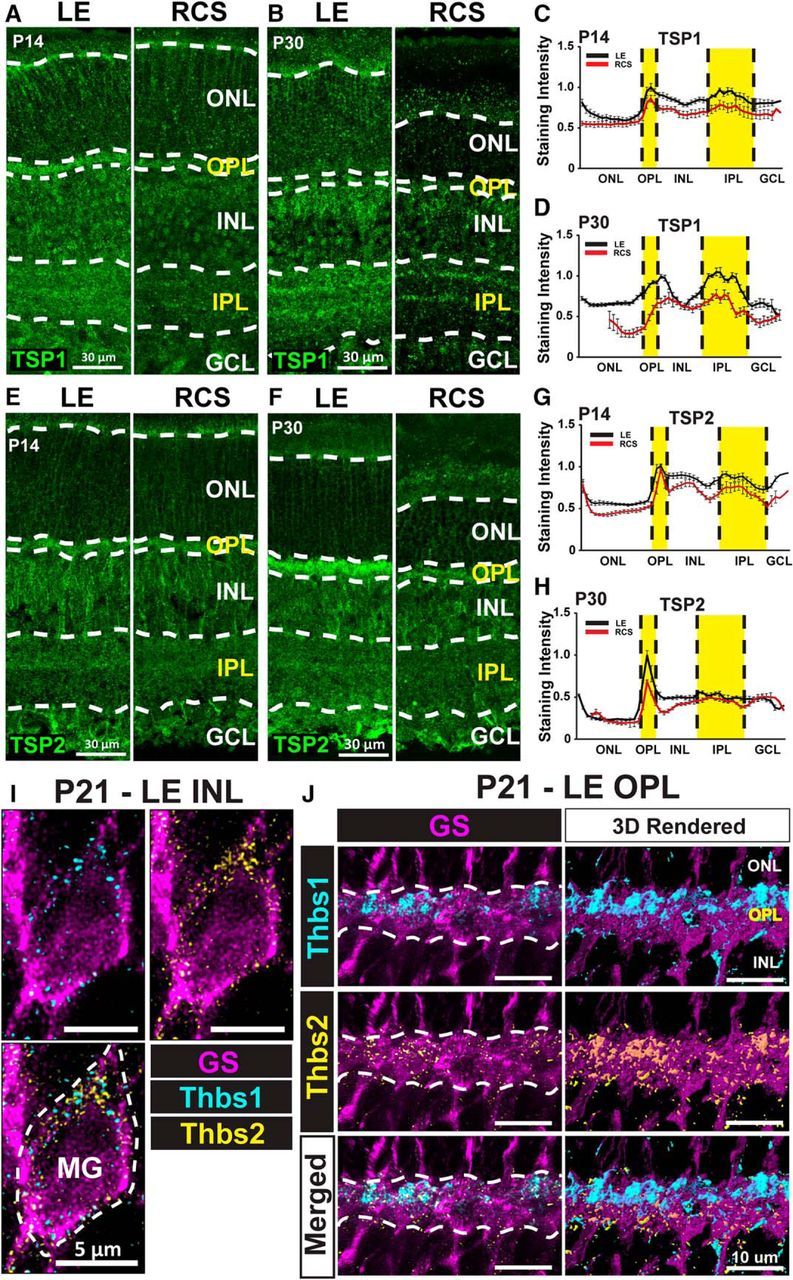
TSP1 and TSP2, expressed by MG, are reduced in RCS rat retinas. A, Representative images of the retina stained for TSP1 from LE (healthy) and RCS (degenerative) rats on P14 and (B) P30. Quantitative staining intensity analysis demonstrated that TSP1 is enriched in the synaptic layers, the expression was reduced in the RCS rat as early as (C) P14, and the expression gap became more distinct on (D) P30. Representative images of the retina stained for TSP2 on (E) P14 and (F) P30. Quantitative staining intensity analysis demonstrated that TSP2 was enriched in the OPL, the expression was reduced in RCS rat as early as (G) P14, and the expression gap became larger on (H) P30. I, Confocal microscopy images showing fluorescent spots corresponding to Thbs1 (cyan) and Thbs2 (yellow) mRNA in GS+ cell bodies (dashed line) in rat retina. J, The Thbs1 and Thbs2 mRNAs were also enriched in the synaptic layers in GS+ processes. 3D rendered images (right panels).
To determine whether TSP expression is affected in the RCS retinas, we immunostained retinal sections from RCS and LE rats for TSP1 or TSP2 at P14 and P30, coinciding with early and late postnatal development (Fig. 6C–J). We found noticeable differences in both TSP1 and TSP2 expression between genotypes at both ages, although the reduction in TSP1 or TSP2 expression in RCS rats was most evident at P30 (Fig. 6G–J). Furthermore, we also detected differences in the localization of TSP1 and TSP2 in the retina. Even though we detected staining for both TSPs throughout all the retinal layers at P30, we found TSP1 to be enriched in the IPL (Fig. 6G,I), whereas TSP2 is enriched in the OPL (Fig. 6H,J). Together, these results show that TSP1 and TSP2 are expressed in rat retinas from early to late postnatal development coinciding with periods of extensive synapse development, and their expressions are reduced in RCS rat retinas.
TSP-receptor α2δ-1 is localized to retinal synapses, and α2δ-1-containing synapses are diminished in RCS rats
Our results strongly suggest that the synaptogenic signaling provided by MG-secreted TSPs is impaired in the RCS rat, resulting in deficits in synaptic development. TSPs interact with their synaptogenic receptor, calcium channel subunit α2δ-1, to promote excitatory synapse formation (Eroglu et al., 2009). Hence, the expression of α2δ-1 in the retina is necessary for TSP-mediated synaptogenesis. To determine developmental expression pattern of α2δ-1 in the rat retina, we used an antibody against α2δ-1 to examine the expression pattern in healthy LE rats. We found that the expression of α2δ-1 is sharply increased between P14 and P30 (Fig. 7A,B, left). In addition, we found α2δ-1 to be primarily localized to the OPL and IPL (Fig. 7B, left), where the TSPs are also enriched (Fig. 6). In contrast in the RCS retinas, α2δ-1 expression is not sharply increased between P14 and P30, resulting in diminished expression of α2δ-1 compared with age-matched LE controls (Fig. 7A,B, right). The staining intensity analysis between LE and RCS rats further confirmed enrichment of α2δ-1 in synaptic layers and decreased expression of α2δ-1 in the RCS rat retinas (Fig. 7C,D).
Figure 7.

TSP-receptor α2δ-1 is synaptically expressed in the retina, and its expression is reduced in RCS rats. A, Representative images of the retina stained for α2δ-1 from LE (healthy) and RCS (degenerative) retinas at P14 and (B) P30. C, Quantitative staining intensity analysis demonstrated that α2δ-1 expression was reduced in RCS rat as early as P14. D, α2δ-1 was enriched in both the OPL and IPL, and the expression gap became more distinct at P30. Representative images of the (E) OPL and (F and G) IPL with the synapses labeled for Bassoon (F, green), VGluT1 (G, green), α2δ-1 (red), and NR1 (blue) from LE retina on P21 demonstrated postsynaptic expression of α2δ-1. Representative images of the (H) OPL and (J) IPL synapses labeled for Bassoon (green) and α2δ-1 (red) from LE (healthy) and RCS (degenerative) retinas on P21. Quantification of α2δ-1-containing synapses formed in the (I) OPL and (K) IPL reveals that the number of α2δ-1 synapse is already reduced in RCS rat by P21. Data were obtained from a minimum of 3 animals of either sex and expressed as mean ± SEM. ***p < 0.0001.
To determine whether α2δ-1 is localized to synapses, retinal sections from P21 LE rats were stained with an antibody against α2δ-1 in conjunction with pre- (Bassoon, green) and postsynaptic (NMDA receptor subunit 1, NR1) markers. The results showed that α2δ-1 closely colocalizes with NR1+ postsynaptic terminals in both the OPL and IPL, whereas α2δ-1 puncta juxtaposes a subset of Bassoon positive presynaptic puncta (Fig. 7E,F). These staining patterns suggest that α2δ-1 is predominantly localized to glutamatergic postsynapses in the retina. Importantly, quantitative analyses of α2δ-1+ synapses (marked as Bassoon/α2δ-1 oppositions) in P21 LE and RCS rat retinas showed that α2δ-1-containing synapses are severely reduced in the IPL and OPL of RCS rats at this age before significant retinal degeneration occurs (Fig. 7H–K; Student's t test, p < 0.0001).
Together, our results show that TSP1 and TSP 2 and their neuronal receptor α2δ-1 are expressed in the synaptic layers of the rat retina during the time period of extensive excitatory synapse formation (i.e., P14-P30). This finding indicates a critical role for TSP signaling in the establishment of retinal synaptic connectivity during normal development. Our results also suggest that reduced TSP/α2δ-1 signaling in RCS rat retinas may underlie impaired synapse formation.
hUTC transplantation specifically preserves α2δ-1-containing synapses in RCS rats
hUTC-secreted TSPs enhance synapse formation, maturation, and function in cultured retinal neurons in vitro (Koh et al., 2015). We found that in the neural retina MG secrete TSPs. Furthermore, we showed that TSP production and development of TSP receptor α2δ-1+ synapses are severely hampered in the RCS rats. Hence, we hypothesized that subretinal injection of hUTC may restore visual function by preserving synaptic connectivity and restoring TSP/α2δ-1 signaling in the RCS retinas.
To test this possibility, we first quantified the number of OPL ribbon synapses in P95 LE rats (G1), RCS rats treated subretinally with BSS at P21(G4), RCS rats treated subretinally with hUTC at P21 (G3), or both at P21 and P60 (G6). To do so, retinal sections were stained with antibodies against the presynaptic marker Bassoon (green) and the postsynaptic marker mGluR6 (red) (Fig. 8A). As expected from visual function assessments (Fig. 1), P21 BSS-injected RCS rats (G4) displayed dramatic loss in their OPL ribbon synapses at P95 compared with the WT LE controls (G1, Fig. 8A,C). Significantly higher numbers of OPL ribbon synapses were preserved in the RCS rat retinas that underwent hUTC administration at P21 (i.e., both G3 and G6). This result shows that, in addition to preserving PRs (Fig. 2E,F), hUTC injection at P21 also protects OPL ribbon synapse connectivity.
Figure 8.

Subretinal hUTC transplantation preserves OPL synapses in RCS rats. Representative images of the OPL with the PR ribbon synapses labeled for (A) Bassoon (green) and mGluR6 (red) and (B) Bassoon (green) and α2δ-1 (red) from LE (control), RCS + BSS, and RCS + hUTC P21 and P60 retinas on P95. Quantification of the number of synapses in the OPL revealed that hUTC transplantation protected (C) ribbon synapses. D, Particularly, α2δ-1-containing synapses were specifically preserved following hUTC treatment. Data were obtained from a minimum of 3 animals of either sex and expressed as mean ± SEM. ***p < 0.0001.
The preservation of ribbon synapses is not significantly different between animals receiving one (P21) or two (P21 + P60) injections (i.e., G3 and G6), respectively. However, the assessment of visual function revealed a marked improvement in the luminescence threshold responses of only the latter group (G6, Fig. 1E). To determine whether this difference could be explained by preservation of TSP/α2δ-1 signaling in the OPL, we measured the number of synapses containing TSP receptor α2δ-1 (visualized by the colocalization of Bassoon and α2δ-1). We found that α2δ-1-containing synapses are specifically preserved only in the RCS rats that received P21 and P60 double injections (Fig. 8B,D; one-way ANOVA, F(3,156) = 69.2185, p < 0.0001). This result strongly suggests that protection of α2δ-1-containing synapses may underlie enhanced functional recovery with the double injection treatment regimen.
To determine whether hUTC injections also affected synaptic connectivity in the IPL, we quantified the number of VGlut1/PSD95+ bipolar cell synapses of the same experimental groups: LE rats (G1), RCS rats treated subretinally with BSS at P21(G4), or RCS rats treated subretinally with hUTC at P21 (G3) or both at P21 and P60 (G6). Similar to the OPL, P21 BSS-injected RCS rats (G4) display a dramatic loss in their IPL bipolar cell synapses at P95 compared with the WT LE controls (Fig. 9A,B; one-way ANOVA, F(3,163) = 12.3739, p < 0.0001). Subretinal injection of hUTC did not protect IPL bipolar cell synapses; however, double injection of hUTC (G6, P21 and P60) protected a large majority of the TSP-receptor α2δ-1-containing synapses in the IPL (Fig. 9C,D; one-way ANOVA, F(3,167) = 82.9958, p < 0.0001). However, subretinal injection of hUTC did not rescue inhibitory synapses visualized by the colocalization of Bassoon (presynaptic) and Gephyrin (postsynaptic; Fig. 9E,F).
Figure 9.

Subretinal hUTC transplantation preserves α2δ-1-containing synapses in the IPL of RCS rats. A, Representative images of the IPL labeled for VGluT1 (green) and PSD95 (red) from LE (control), RCS+BSS, and RCS+hUTC P21 and P60 retinas on P95. B, Quantification of excitatory synapses in the IPL revealed that synapse numbers did not differ between RCS+BSS and RCS+hUTC P21 and P60. C, Representative images of the IPL labeled for Bassoon (green) and α2δ-1 (red) from LE (control), RCS+BSS, and RCS+hUTC P21 and P60 retinas on P95. D, The α2δ-1-containing synapses were specifically preserved with hUTC transplantation. E, Representative images of the IPL stained for Bassoon (green) and Gephyrin (blue) from LE (control), RCS+BSS, and RCS+hUTC P21 and P60 retinas on P95. F, hUTC transplantation did not preserve inhibitory synapses. Data were obtained from a minimum of 3 animals of either sex and expressed as mean ± SEM. *p < 0.05.
Collectively, these results show that hUTC transplantation in RCS rats enhances synaptic connectivity. Importantly, we found that hUTC transplantation protects specific subsets of retinal synapses. In particular, repeated hUTC transplantation preserves synapses that contain TSP-receptor α2δ-1 in both OPL and IPL. These results suggest an important role for TSP/α2δ-1- signaling in the proper connectivity and function of the retina and signify their importance as therapeutic molecular targets for treatment of retinal degeneration.
hUTC transplantation attenuates reactivity and preserves MG morphology
MG secrete TSPs and also provide important trophic and maintenance roles that enable proper retinal function (Williams et al., 2010). Therefore, we next tested whether hUTC injection improved MG morphology and function in the RCS rat retinas. To do so, we visualized MG in three groups of P95 rat retinas: that is, LE rats (G1), RCS rats treated subretinally with BSS at P21 (G4), and RCS rats treated subretinally with hUTC both at P21 and P60 (G6), by immunostaining with GS and SOX9 (Fig. 10A). Interestingly, the RCS rats that received two injections of hUTC (G6) display significantly improved MG structure and GS expression compared with those treated with vehicle (BSS) (Fig. 10A). In the double injection group (G6), GS+ MG processes localized to the outer limiting membrane (white arrow) maintained their tightly closed structure, which was comparable with healthy controls (LE). In contrast, the P21 vehicle-injected group (G4) showed abnormally extended and opened structures at the outer limiting membrane (Fig. 10A).
Figure 10.

hUTC transplantation preserves MG morphology and attenuates reactivity. A, Representative images of the MG labeled for GS (green) and SOX9 (red) from LE (control), RCS+BSS, and RCS+hUTC P21 and P60 retinae on P95. Percentages of (B) OPL and (C) IPL area covered by GS+ processes were increased following hUTC transplantation in the RCS rat. The number of SOX9+ cell bodies (D) distance between SOX9 cell bodies (E) were decreased in RCS rat with hUTC transplantation, suggesting reduced proliferative change of MG. F, Representative images of the MG labeled for GS (green) and GFAP (red) from LE (control), RCS+BSS, and RCS+hUTC P21 and P60 retinas on P95 demonstrate a sharply reduced reactive glial phenotype in the RCS+hUTC P21 and P60. Data were obtained from a minimum of 3 animals of either sex and expressed as mean ± SEM. *p < 0.05, ***p < 0.0001.
GS is a crucial enzyme that is required for the clearance and recycling of synaptically released glutamate. Loss of GS expression in astroglia is an indication of reactivity and loss of synaptic homeostasis (Härtig et al., 1995; Fernández-Sánchez et al., 2015; Hippert et al., 2015). We found that GS expression is preserved in the double hUTC-injected RCS rat retinas (G6), whereas vehicle-injected RCS rat retinas had a severe reduction in GS expression, particularly within the synaptic layers (Fig. 10B,C; one-way ANOVA, F(2,78) = 34.7322, p < 0.0001). The number of SOX9+ MG cell bodies was not different between the LE (G1) and vehicle-injected RCS rat groups (G4), but we observed a small but significant reduction in the number of SOX9+ cells in the double hUTC-injected group (G6, Fig. 10D; one-way ANOVA, F(2,24) = 3.6584, p = 0.041). On the other hand, the double hUTC injection group (G6) displayed a lesser degree of disorganization of MG cell bodies in the INL as determined by a significantly reduced distance between MG cell bodies and the average y axis of the INL (Fig. 10E; one-way ANOVA, F(2,445) = 15.1905, p < 0.0001). This result further indicates that subretinal hUTC transplantation reduces reactive changes in the MG.
In agreement with this possibility, the reactive glia marker GFAP is absent from MG in P95 healthy control rat retinas (LE) but heavily upregulated in the vehicle-injected RCS rat group. Remarkably, double hUTC injection greatly subdued GFAP expression in the RCS rat retinas (Fig. 10E). These results show that repeated hUTC transplantation at P21 and P60 prevents reactive MG changes in RCS rat retinas, revealing a novel therapeutic effect for hUTC transplantation.
Cell-autonomous loss of MERTK expression is sufficient to induce reactive changes in MG
The RCS rat contains a deletion mutation in the gene that encodes MERTK. MERTK protein has well-established roles in regulation of phagocytosis and is expressed by the RPE cells (Feng et al., 2002); therefore, it is widely accepted that MERTK loss of function causes retinal degeneration by impairing the phagocytosis of the PR outer segment debris by RPE (D'Cruz et al., 2000; Nandrot et al., 2000). However, MERTK is also expressed by microglia and MG in the retina (Roesch et al., 2008, 2012; Siegert et al., 2012). Importantly, the expression level of MERTK in MG significantly increases with degenerative stress (Roesch et al., 2012). Thus, the loss of this gene in MG could have significant effects on the health and connectivity of the RCS rats. To test this possibility, we selectively ablated MERTK expression in MG of LE rats using CRISPR/SaCas9 system. To do so, we cloned an sgRNA against rat Mertk gene into a vector that contains SaCas9, a short Cas9 homolog that can be packaged into an AAV together with the sgRNA (Ran et al., 2015). AAVs were produced with a capsid protein that provides MG-selective transduction (Klimczak et al., 2009). AAVs were intravitreally injected into the eyes of P7–P10 LE pups (Fig. 11A,B). The left eyes were injected with the sgRNA targeting Mertk (MERTK KO), and the right eyes received the AAVs, which does not include an sgRNA, serving as controls (Fig. 11C). We confirmed that the sgRNA specific for Mertk causes genetic mutations in the Mertk locus and reduces MERTK protein production in cultured astrocytes (Fig. 11D,E). Furthermore, IHC analyses demonstrated highly selective expression of HA-tagged SaCas9 in MG because the HA-tagged SaCas9 was exclusively enriched in the GS+ MG cell bodies and processes in both left (treatment) and right eyes (control) (Fig. 11F).
Figure 11.

MG-specific deletion of MERTK using AAV-CRISPR/SaCas9 system. A, To accomplish MG-specific MERTK deletion, CRISPR/SaCas9 vector targeting the MERTK gene is enveloped with shH10 mutant AAV capsid. B, AAVs are intravitreally delivered to target MG. C, In vivo intravitreal injection of AAV-CRISPR-MERTK (left eye) or AAV-CRISPR-Control (right eye). D, T7 Endonuclease I assay confirms CRISPR/SaCas9-induced cleavage in MERTK target sequence. Arrows indicate cleaved PCR amplicon. E, Western blot of rat cortical astrocytes transduced with AAVs confirms reduced MERTK protein expression by CRISPR/SaCas9-AAV. F, Colocalization of GS (green, MG) and HA-tagged SaCas9 (red) demonstrates cell-type-specific transduction of CRISPR/SaCas9-AAV. Scale bar, 10 μm.
Loss of MERTK specifically in MG did not cause any overt PR cell loss (Fig. 12). To determine whether knocking out MERTK in MG of LE rats induces reactive changes similar to what we observed in RCS rats, we quantitatively analyzed the expression of GS and the number and distribution of (SOX9+) MG cell bodies at P21 and P45 (Fig. 12A). We found a significant reduction in the infiltration of GS+ processes in both synaptic layers in MG-specific MERTK KOs at P21, similar to our findings in the RCS rats (Fig. 5). At this age, there was already a significant reduction in the area covered by GS+ staining in the IPL (Fig. 12C; Student's t test, p = 0.0080), whereas there was no significant change in the OPL (Fig. 12B; Student's t test, p = 0.3402) or the number of SOX9 between left and right retinas (Fig. 12D; Student's t test, p = 0.6862). The reactive changes became more severe by P45, demonstrated by significantly reduced GS+ area in both OPL (Fig. 12E; Student's t test, p < 0.0001) and IPL (Fig. 12F; Student's t test, p < 0.0001). These changes were coincident with increased number of SOX9+ MG cell bodies within the INL (Fig. 12G; Student's t test, p < 0.0001). The increased MG number was accompanied by atypical distribution of MG cell bodies. The disorganization was analyzed by comparing average SOX9 intensity profiles within the INL between left and right eyeball retinas (Fig. 12I). The results demonstrated that increased numbers of SOX9+ MG at P45 had greater disorganization of MG cell bodies within the INL, whereas MG organization remained the same at P21 (Fig. 12J,K; ANCOVA, p < 0.0001). Together, these findings demonstrate that deleting MERTK in WT MG induces morphological and proliferative changes similar to the RCS rats, suggesting that MG dysfunction of the RCS rat may be independent of RPE dysfunction. It is important to note that, despite the severe reactive changes in MG upon MERTK deletion, the PR layer thickness did not appear to be affected in the MG-specific MERTK KO retinas.
Figure 12.

Loss of MERTK in MG induces reactive changes. A, Representative images of MG labeled with GS (green) and SOX9 (red) from P45 CTR (injected with Control-AAV, which only contains SaCas9) or P45 KO (injected with AAV containing CRISPR against Mertk). Loss of GS+ MG processes and disorganized SOX9+ MG nuclei in the INL are easily noticeable at this time point. Percentages of OPL and IPL area covered by GS+ MG processes in MERTK-KO retinas compared with CTR (B, C) at P21 and (E, F) at P45 (D, G). (H) GFAP (red) expression is sharply increased in P45 MERTK-KO retinas. The number of SOX9+ cell bodies is increased. I–K, The distribution of SOX9 cell bodies is disorganized in P45 MERTK-KO retinas, suggesting proliferative and reactive changes in MG. The disorganization was analyzed by measuring average SOX9 intensity profiles within the INL, then comparing between CTR and KO retinas. All data were obtained from a minimum of 3 animals of either sex and expressed as mean ± SEM. *p < 0.05.
Loss of MERTK in MG impairs retinal synapse development
To determine whether loss of MERTK in MG is sufficient to cause synapse development problems similar to those observed in RCS rat retinas, we quantitatively analyzed the number of synapses in the inner and outer synaptic layers of right (control) and left (MERTK KO) retinas at P21 and P45. In the OPL, the number of ribbon synapses analyzed by the colocalization of Bassoon (presynaptic) and mGluR6 (postsynaptic) was significantly reduced in MERTK KO retinas compared with controls at both P21 and P45 (Fig. 13A,B; Student's t test, p < 0.0001). We next analyzed IPL excitatory synapses based on colocalization of VGluT1 (presynaptic) and PSD95 (postsynaptic) and found that there was a significant defect during early development (P21); however, the defect was no longer detectible at P45 (Fig. 13C, p < 0.0001; and Fig. 13D, p = 0.2323, Student's t test). Furthermore, α2δ-1+ synapses determined by colocalization with Bassoon were severely reduced in both synaptic layers (OPL and IPL) and time points (P21 and P45; Fig. 13E–H). These results provide strong evidence that loss of MERTK in MG could significantly contribute to diminished visual function in retinal degeneration caused by MERTK mutations by impairing the formation and/or maintenance of retinal synapses.
Figure 13.
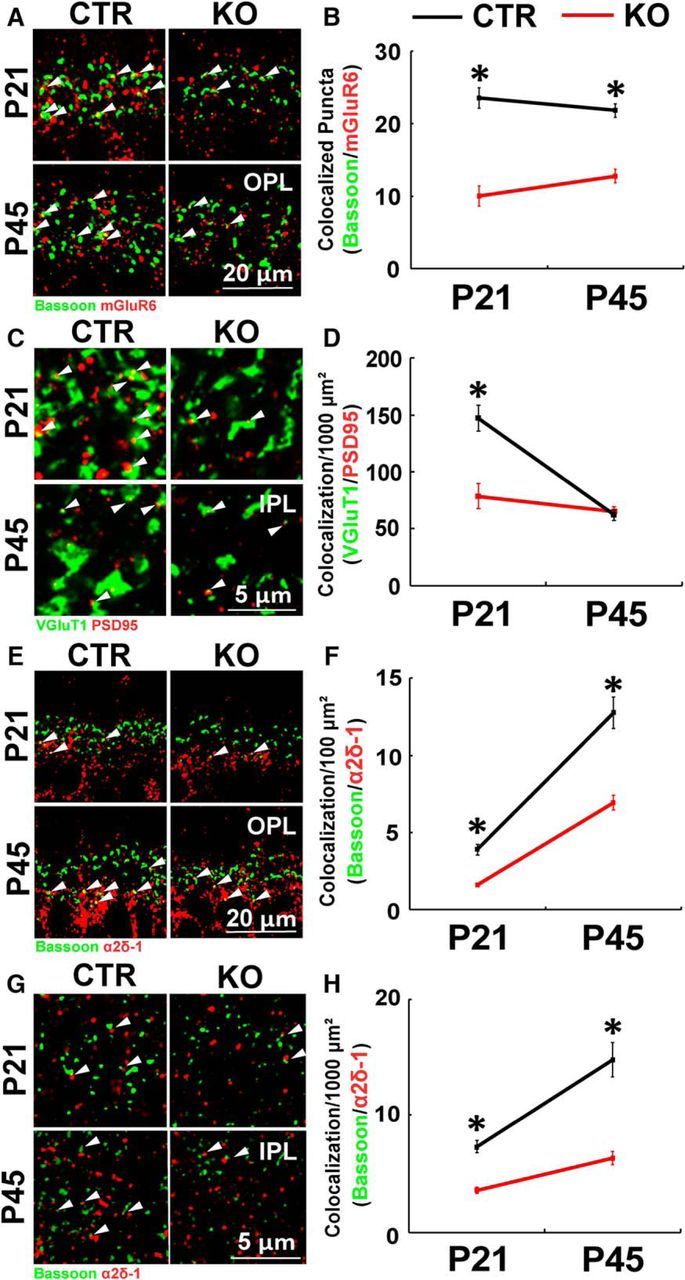
KO of MERTK in MG results in impaired synapse development in vivo. A, Representative images of the OPL synapses labeled by Bassoon (green) and mGluR6 (red) from Control (CTR, right eyeballs) and MERTK KO (KO, left eyeballs) at P21 and P45. B, Quantification of synapses in the OPL revealed that synapse development is impaired in MG-specific MERTK-KO at both P21 and P45. C, IPL excitatory synapses are visualized by VGluT1 (green) and PSD95 (red). D, Quantification of synapse number demonstrates that early synaptic development at P21 is significantly affected by MERTK KO but not at P45. Representative images of the (E) OPL and (G) IPL synapses labeled for Bassoon (green) and α2δ-1 (red). Quantification of the number of α2δ-1-containing synapses in both (F) OPL and (H) IPL revealed that KO of MERTK in MG induces severely reduced number of α2δ-1-containing synapses at P21 and P45. Data were obtained from a minimum of 3 animals of either sex and expressed as mean ± SEM. *p < 0.05.
MERTK KO impairs synaptogenic function of cultured retinal glia
Astrocyte-secreted synaptogenic proteins, such as TSP1 and TSP2, induce formation of excitatory synapses between purified RGC cultures (Christopherson et al., 2005). We next used this cell culture system to test whether loss-of-function mutations in MERTK impair synaptogenic activity of retinal glia. To do so, we first isolated rat retinal glia (Trachtenberg and Packey, 1983), which then were treated with the same control or MERTK-targeting CRISPR/SaCas9 AAVs (as described in Fig. 11) for 5 d. MERTK KO or control retinal glia were next cocultured with RGCs for another 6 d. The number of synapses formed between RGCs was assessed by the colocalization of Bassoon (presynaptic) and Homer (postsynaptic) as previously described (Koh et al., 2015) (see also Materials and Methods). Retinal glia strongly induced excitatory synapse formation between RGCs compared with RGCs cultured alone (Fig. 14D; one-way ANOVA, F(2,87) = 14.2296, p < 0.0001). However, the MERTK-KO retinal glia did not induce significant excitatory synapse formation (Fig. 14D). To confirm that synaptogenic effect of retinal glia was mediated via secreted factors, the CRISPR/SaCas9 AAV-treated retinal glia were cultured separately and conditioned media (CM) were collected as previously described (Christopherson et al., 2005; Koh et al., 2015). Then RGCs were treated with control or MERTK KO retinal glia-conditioned medium for 6 d (Fig. 14B). Because astrocytes are known to secrete multiple synaptogenic factors (Ullian et al., 2001), astrocyte CM was used as a positive control. The results demonstrated that addition of retinal glia CM is sufficient to induce excitatory synapse formation, comparable with astrocyte CM treatment (Fig. 14E; one-way ANOVA, F(3,116) = 9.3117, p < 0.0001). Importantly, retinal glia CM collected from MERTK KO cells did not promote synaptogenesis, which further indicates that deletion of MERTK from the retina glia impairs synaptogenic activity of these cells (Fig. 14E).
Figure 14.

KO of MERTK in cultured retina glia (i.e., MG and retinal astrocytes) impairs synaptogenic function. A, Schematic representation of coculture experiments. Purified RGCs were either cultured alone or cocultured with retinal glia. The retinal glia were plated onto transwell inserts, which were pretreated with CRISPR/SaCas9-AAVs 5 d before coculture with neurons (RGCs). For UCM treatment experiments, the control and MERTK KO retinal glia inserts were further treated with UTC conditioned medium prepared from cells transduced by lentiviruses containing control scramble shRNA (CTR UCM) or shRNAs against TSP1, TSP2, and TSP4 (TSP KD UCM) for 3 d before coculture with RGCs. B, Schematic representation of the experimental design. Purified RGCs were treated with either control (SaCas9 only) or MERTK KO (MTK KO) retinal glia conditioned medium (RG CM). After 6 d treatment with conditioned media, the number of synapses is determined by immunocytochemistry. C, Representative images of RGCs stained with antibodies against presynaptic Bassoon (green, pre) and postsynaptic Homer (red, postsynaptic). White arrows indicate the colocalized synaptic puncta. Quantification of fold increase in synapse number of the RGCs that were either (D) cocultured or (E) treated with conditioned medium demonstrates that loss of MERTK in retina glia impairs their synaptogenic activity (n = 30 cells/condition). Data are mean ± SEM. ***p < 0.0001. F, Treatment of MERTK KO retina glia with either scrambled shRNA transduced UCM or TSP1 + TSP2 + TSP4 knockdown shRNA transduced UTC conditioned medium (TSP-KD UCM) rescues the synaptogenic activity (n = 30 cells/condition). Data are mean ± SEM. ***p < 0.0001, *p < 0.05. G, Western blot analyses using the cell lysates from control and MERTK KO retina glia. Represented Western blot images are from an individual experiment with three biological replicates. Quantitative analysis of (H) TSP1, (I) TSP2, (J) GFAP, and (K) GS (n = 3 per condition). L, Left, Western blot analyses using the retina glia conditioned medium. Right, Total protein loaded is visualized by Coomassie blue staining. Quantitative analyses of retina glia-secreted (M) TSP1 and (N) TSP2 (n = 3 per condition). Data are mean ± SEM. *p < 0.05.
hUTC-secreted factors recover synaptogenic function of MERTK KO retina glia
Because subretinal hUTC transplantation attenuates reactivity of MG and rescues retinal synaptic connectivity in vivo (Figs. 8–10), we tested whether hUTC secrete factors that could rescue synaptogenic function of the MERTK KO retina glia. In our previous study, we found that hUTC secrete synaptogenic TSP1, TSP2, and TSP4 (Koh et al., 2015), which may directly influence synaptic rewiring in vivo, or may signal to MG to regulate their synaptogenic functions. Therefore, we also examined whether UCM from hUTC in which TSP1, TSP2, and TSP4 were knocked down could still rescue the impaired synaptogenic function of the MERTK KO retina glia.
To test these possibilities, MERTK KO retina glia were first treated with UCM for 5 d before coculture with RGCs. UCM were collected from hUTC transduced with lentiviruses containing either scrambled shRNAs or a combination of TSP1, TSP2, and TSP4 targeting shRNAs as previously described (Koh et al., 2015). The transwell inserts in which the retinal glia were treated with UCM were thoroughly washed with DPBS before coculture with RGCs to prevent direct interaction of the factors within the UCM and the RGCs. Quantification of the number of synapses in cultured RGCs revealed that pretreating MERTK KO retina glia with UCM rescued impaired synaptogenic function of these glial cells, as demonstrated by significantly greater number of synapses after coculture (Fig. 14F; one-way ANOVA, F(4,145) = 8.8020, p < 0.0001). Triple knockdown of TSP family proteins from the hUTC did not completely inhibit this rescue effect of UCM, suggesting that TSP family proteins are not the only constituents of the hUTC-MG signaling that is involved in the rescue of the glial synaptogenic signaling.
Why do MERTK-KO retinal glia lose their synaptogenic function? To determine whether deletion of MERTK affects retinal glia-secreted synaptogenic TSPs, we examined the expression level of TSPs from the cell lysates and conditioned medium of CRISPR/SaCas9 AAV-transduced cells. Quantitative analyses of the protein abundance indicated that the total amount of synaptogenic proteins TSP1 and TSP2 or glial markers GS and GFAP in the cell lysates were unchanged between control and MERTK-KO conditions (Fig. 14H–K). However, the amount of secreted TSP1 was significantly reduced in the retinal glia CM (Fig. 14M; Student's t test, p = 0.0115), whereas the TSP2 abundance was not affected (Fig. 14N; Student's t test, p = 0.8002). These results suggest that KO of MERTK in retinal glia affects TSP1 secretion and changes the composition of the glial-secretome that would impact many different aspects of retinal synaptogenesis and health.
Discussion
Our results provide novel insights into the mechanisms by which subretinal hUTC transplantation provides therapeutic effects in retinal degenerative diseases. Here we show that subretinal delivery of hUTC to RCS rats at P21, before PR loss, is critical to protect visual function, and repeating cell administration on P60 enhances the therapeutic benefits. We also demonstrate that synaptic impairments alongside morphological and functional changes in MG occur before the onset of significant PR loss in RCS rat retinas. hUTC transplantation protects synaptic connectivity and attenuates MG reactivity. In particular, MG-secreted synaptogenic factors TSP1 and TSP2 and their neuronal receptor α2δ-1 are sharply reduced, indicating an important role for diminished synaptogenic TSP signaling in the pathophysiology of the retinal degeneration observed in RCS rats. Interestingly, rescue of retinal function by hUTC transplantation strongly correlates with the protection of α2δ-1-containing synapses and attenuation of MG activation. CRISPR/SaCas9-mediated deletion of MERTK specifically in retinal glial cells was sufficient to recapitulate the reactive changes seen in the MG of RCS retinas. These reactive changes were also accompanied by reduced synaptic development providing a strong link between MG dysfunction and synaptic pathologies observed in RCS retinas. Furthermore, our in vitro experiments provide evidence that MERTK mutation has cell autonomous effects in MG, causing them to be less synaptogenic, potentially by disrupting TSP1 secretion. Importantly, secreted factors from hUTC restore the synaptogenic functions of retinal glia. Together, our findings reveal that the protective paracrine signals provided by hUTC improve the retinal microenvironment and synaptic connectivity at least in part through supporting MG function. Here we also provide the first evidence that MERTK mutation affects retinal health, not solely through the role of this protein in RPE. MG dysfunction due to loss of MERTK function in these glial cells may contribute significantly to loss of vision. Thus, our findings provide novel cellular mechanisms of action for hUTC in treating retinal degeneration and pinpoint MG as important cellular targets for therapy.
Subretinal hUTC transplantation at P21 protects visual function and PRs
Previous studies using the RCS rats have tested therapeutic efficacy of various cell sources, including hUTC (Lund et al., 2007), RPE (Wang et al., 2008), Schwann cells (McGill et al., 2007), retinal progenitor cells (Qu et al., 2015), and stem cell-derived RPE (Thomas et al., 2016). These studies showed that injection of cell therapy products between P21 and P28 could rescue visual function. Each of these studies administered their cell therapy of interest between P21 and P28, whereas only one study (Wang et al., 2008) compared the efficacy of RPE transplantation with a later time at P60. Similar to our findings, injection of RPE cells at P21 provides a superior therapeutic effect than administration at P60 (Wang et al., 2008). Even though it is not clear whether cell transplantation of another cell type on P60 could have potential beneficial effects, our results clearly show that subretinal transplantation of hUTC on P21, before significant PR death, is necessary for positive functional outcomes (Figs. 1, 2). Visual acuity analysis and electrophysiological outcomes revealed that a repeated cell injection at P60 (in addition to P21) further enhances the rescue effect. This result indicates that the paracrine effects of hUTC last much longer than the cells; however, they diminish over time. Thus, repeated administration may present important benefits.
Impaired synaptic development, TSP signaling, and MG reactivity precede PR loss in RCS rats
The RCS rat contains a deletion mutation in the MERTK gene. It is widely accepted that MERTK deletion, which causes retinal degeneration in RCS rats, primarily affects phagocytosis of the PR outer segment debris by RPE cells (D'Cruz et al., 2000; Nandrot et al., 2000). MERTK is also expressed by microglia and MG in the retina (Roesch et al., 2008, 2012; Siegert et al., 2012). Importantly, the expression level of MERTK in MG significantly increases with degenerative stress (Roesch et al., 2012). Thus, the loss of this gene could have important effects on retinal function via multiple cell types and cellular mechanisms. In this study, we found that MERTK loss in MG is sufficient to induce reactive changes in these cells. These reactive changes are accompanied by reduced expression of GS. Furthermore, excitatory synapses formed in the OPL and IPL are severely affected, indicating that the ability of MG to support synapse development and maintenance is impaired. These results mimic the early MG-reactive changes and synaptic development deficits of the RCS rats that precede PR (PR) death (Fig. 2) and overt RPE dysfunction (Feng et al., 2002). These results show that loss of MERTK not only causes RPE dysfunction but also impairs MG contributing to important disease phenotypes. Interestingly, we did not find any evidence of PR loss in the MERTK KO retinas at P45, the latest time point we studied (data not shown). These combined results suggest that degeneration of PRs is mainly driven by loss of MERTK in other retinal cells, such as RPE, as previously reported (D'Cruz et al., 2000; Nandrot et al., 2000), whereas the synaptic development and connectivity deficits in the RCS rats are primarily driven by the MG dysfunction.
Previous studies demonstrated that astrocyte-secreted TSP1 and TSP2, which signal through their neuronal receptor α2δ-1, are necessary and sufficient for synapse formation in the brain (Christopherson et al., 2005; Eroglu et al., 2009; Risher and Eroglu, 2012). However, whether these proteins play important roles in retinal connectivity is not known. MG were previously proposed as a source of TSP1 in vitro and in vivo (Eichler et al., 2004; Yafai et al., 2014). Our study further extends these observations; and importantly, our findings put forth that impaired TSP/α2δ-1 signaling is an underlying molecular mechanism in retinal degenerative diseases. In parallel with the reactive changes that occur in MG during early development (P14-P30), the expressions of TSP1, TSP2, and α2δ-1 are sharply decreased in the RCS rat retinas (Figs. 5–7). The reduced TSP/α2δ-1 signaling strongly correlates with severely impaired synaptic development in both synaptic layers, OPL and IPL (Figs. 3, 4). The deficits in synaptic development are found before the onset of PR degeneration, and both synaptic layers are affected, suggesting that the failure in retinal synapse formation is caused by dysfunctional MG-driven synaptogenesis rather than PR loss.
Subretinal hUTC transplantation attenuates reactive changes in MG and protects α2δ-1-containing synapses
MG play a crucial role in modulating retinal function by providing physiological support to retinal neurons and regulating synaptic connectivity (Vecino et al., 2016). Thus, it is critical that MG function is preserved to maintain normal visual function. Dysfunctional MG are a common feature found in many animal models of retinal degeneration, including the RCS rat (Härtig et al., 1995; Fletcher and Kalloniatis, 1997; Dyer and Cepko, 2000; Zhao et al., 2010; Fernández-Sánchez et al., 2015; Hippert et al., 2015). The reactive changes of MG are characterized by morphological changes, including the loss of the “honeycomb”-like ensheathment surrounding PRs, process extension toward the subretinal space, and increased numbers of cell bodies as a result of MG proliferation (Dyer and Cepko, 2000; Fernández-Sánchez et al., 2015). Expression of GFAP is increased while GS expression is downregulated (Härtig et al., 1995). In our study, we show that early morphological changes indicating MG activation precede PR loss. Remarkably, subretinal hUTC transplantation attenuates the reactive changes in the RCS rat retina. Our in vitro studies further demonstrate that retinal glia secrete synaptogenic factors, including TSP1 and TSP2, that induce synapse formation in RGCs. Ablating MERTK abolished retinal glia-induced synapse formation, and treatment of MERTK KO retina glia with UCM was sufficient to rescue the synaptogenic function. These results indicate that hUTC-secreted factors are sufficient to rescue the synaptogenic functions of MG. In parallel, previous studies have shown that hUTC secrete receptor tyrosine kinase ligands and rescue phagocytic defect in the of the RPE cells in RCS rats (Alder et al., 2012; Cao et al., 2016). These combined results strongly suggest that the therapeutic effects of subretinal hUTC transplantation are mediated by improving MG and RPE function, thus nurturing a healthy physiological microenvironment within the retina.
We found that α2δ-1-containing synapses are greatly reduced in RCS rats and are specifically preserved after hUTC transplantation. Furthermore, MERTK deletion in retinal glia decreases TSP1 secretion. Together, these results strongly indicate the importance of maintaining TSP/α2δ-1-mediated synaptogenic signaling in preserving normal visual function. Our results also suggest that, even though hUTC themselves secrete TSPs, they preserve retinal synaptic connectivity primarily by improving MG-secretion of TSP1.
In conclusion, our findings reveal novel synaptic and glial mechanisms of subretinal hUTC transplantation for retinal degeneration. These findings indicate that hUTC provide signals that support PR health and MG function, and protects subsets of retinal synapses that are critical for maintaining vision. Furthermore, our findings suggest that TSP/α2δ-1 signaling is important for retinal function and is impaired in RCS retinas. These findings highlight MG and TSP/α2δ-1 signaling as cellular and molecular targets for curing retinal degenerative diseases.
Footnotes
This work was supported in part by National Institutes of Health Grants NEI 1F32 EY027997 and NIA 2T32AG000029 to S.K., Duke University Chancellor's Discovery Award and Kahn Neurotechnology Development grant to C.E., and Duke Regeneration Next Initiative Postdoctoral Fellowship to S.K. We thank Bin Gao (Janssen R&D) for statistical support.
Parts of the work described were performed under sponsored research agreements between Duke University and Janssen R&D, and Cedars-Sinai Medical Center and Janssen R&D. N.S.D. and I.R.H. are employees of Janssen R&D. The remaining authors declare no competing financial interests.
References
- Alder J, Kramer BC, Hoskin C, Thakker-Varia S (2012) Brain-derived neurotrophic factor produced by human umbilical tissue-derived cells is required for its effect on hippocampal dendritic differentiation. Dev Neurobiol 72:755–765. 10.1002/dneu.20980 [DOI] [PubMed] [Google Scholar]
- Allen NJ, Bennett ML, Foo LC, Wang GX, Chakraborty C, Smith SJ, Barres BA (2012) Astrocyte glypicans 4 and 6 promote formation of excitatory synapses via GluA1 AMPA receptors. Nature 486:410–414. 10.1038/nature11059 [DOI] [PMC free article] [PubMed] [Google Scholar]
- Bird AC, Phillips RL, Hageman GS (2014) Geographic atrophy: a histopathological assessment. JAMA Ophthalmol 132:338–345. 10.1001/jamaophthalmol.2013.5799 [DOI] [PMC free article] [PubMed] [Google Scholar]
- Cao J, Murat C, An W, Yao X, Lee J, Santulli-Marotto S, Harris IR, Inana G (2016) Human umbilical tissue-derived cells rescue retinal pigment epithelium dysfunction in retinal degeneration. Stem Cells 34:367–379. 10.1002/stem.2239 [DOI] [PubMed] [Google Scholar]
- Christopherson KS, Ullian EM, Stokes CC, Mullowney CE, Hell JW, Agah A, Lawler J, Mosher DF, Bornstein P, Barres BA (2005) Thrombospondins are astrocyte-secreted proteins that promote CNS synaptogenesis. Cell 120:421–433. 10.1016/j.cell.2004.12.020 [DOI] [PubMed] [Google Scholar]
- Cuenca N, Pinilla I, Sauvé Y, Lund R (2005) Early changes in synaptic connectivity following progressive photoreceptor degeneration in RCS rats. Eur J Neurosci 22:1057–1072. 10.1111/j.1460-9568.2005.04300.x [DOI] [PubMed] [Google Scholar]
- D'Cruz PM, Yasumura D, Weir J, Matthes MT, Abderrahim H, LaVail MM, Vollrath D (2000) Mutation of the receptor tyrosine kinase gene mertk in the retinal dystrophic RCS rat. Hum Mol Genet 9:645–651. 10.1093/hmg/9.4.645 [DOI] [PubMed] [Google Scholar]
- Dowling JE, Sidman RL (1962) Inherited retinal dystrophy in the rat. J Cell Biol 14:73–109. 10.1083/jcb.14.1.73 [DOI] [PMC free article] [PubMed] [Google Scholar]
- Dyer MA, Cepko CL (2000) Control of Müller glial cell proliferation and activation following retinal injury. Nat Neurosci 3:873–880. 10.1038/78774 [DOI] [PubMed] [Google Scholar]
- Eichler W, Yafai Y, Wiedemann P, Reichenbach A (2004) Angiogenesis-related factors derived from retinal glial (Müller) cells in hypoxia. Neuroreport 15:1633–1637. 10.1097/01.wnr.0000133071.00786.a4 [DOI] [PubMed] [Google Scholar]
- Eroglu C, Allen NJ, Susman MW, O'Rourke NA, Park CY, Ozkan E, Chakraborty C, Mulinyawe SB, Annis DS, Huberman AD, Green EM, Lawler J, Dolmetsch R, Garcia KC, Smith SJ, Luo ZD, Rosenthal A, Mosher DF, Barres BA (2009) Gabapentin receptor alpha2delta-1 is a neuronal thrombospondin receptor responsible for excitatory CNS synaptogenesis. Cell 139:380–392. 10.1016/j.cell.2009.09.025 [DOI] [PMC free article] [PubMed] [Google Scholar]
- Feng W, Yasumura D, Matthes MT, LaVail MM, Vollrath D (2002) Mertk triggers uptake of photoreceptor outer segments during phagocytosis by cultured retinal pigment epithelial cells. J Biol Chem 277:17016–17022. 10.1074/jbc.M107876200 [DOI] [PubMed] [Google Scholar]
- Fernández-Sánchez L, Lax P, Campello L, Pinilla I, Cuenca N (2015) Astrocytes and Müller cell alterations during retinal degeneration in a transgenic rat model of retinitis pigmentosa. Front Cell Neurosci 9:484. 10.3389/fncel.2015.00484 [DOI] [PMC free article] [PubMed] [Google Scholar]
- Fletcher EL, Kalloniatis M (1997) Neurochemical development of the degenerating rat retina. J Comp Neurol 388:1–22. 10.1002/(SICI)1096-9861(19971110)388:1%3C1::AID-CNE1%3E3.0.CO;2-5 [DOI] [PubMed] [Google Scholar]
- Girman SV, Wang S, Lund RD (2005) Time course of deterioration of rod and cone function in RCS rat and the effects of subretinal cell grafting: a light- and dark-adaptation study. Vision Res 45:343–354. 10.1016/j.visres.2004.08.023 [DOI] [PubMed] [Google Scholar]
- Gründer T, Kohler K, Guenther E (2001) Alterations in NMDA receptor expression during retinal degeneration in the RCS rat. Vis Neurosci 18:781–787. 10.1017/S0952523801185111 [DOI] [PubMed] [Google Scholar]
- Härtig W, Grosche J, Distler C, Grimm D, el-Hifnawi E, Reichenbach A (1995) Alterations of Müller (glial) cells in dystrophic retinae of RCS rats. J Neurocytol 24:507–517. 10.1007/BF01179976 [DOI] [PubMed] [Google Scholar]
- Hippert C, Graca AB, Barber AC, West EL, Smith AJ, Ali RR, Pearson RA (2015) Müller glia activation in response to inherited retinal degeneration is highly varied and disease-specific. PLoS One 10:e0120415. 10.1371/journal.pone.0120415 [DOI] [PMC free article] [PubMed] [Google Scholar]
- Ho AC, Chang TS, Samuel M, Williamson P, Willenbucher RF, Malone T (2017) Experience with a subretinal cell-based therapy in patients with geographic atrophy secondary to age-related macular degeneration. Am J Ophthalmol 179:67–80. 10.1016/j.ajo.2017.04.006 [DOI] [PubMed] [Google Scholar]
- Hoon M, Okawa H, Della Santina L, Wong RO (2014) Functional architecture of the retina: development and disease. Prog Retin Eye Res 42:44–84. 10.1016/j.preteyeres.2014.06.003 [DOI] [PMC free article] [PubMed] [Google Scholar]
- Huang J, Zhou L, Wang H, Luo J, Zeng L, Xiong K, Chen D (2013) Distribution of thrombospondins and their neuronal receptor alpha2delta1 in the rat retina. Exp Eye Res 111:36–49. 10.1016/j.exer.2013.03.012 [DOI] [PubMed] [Google Scholar]
- Ippolito DM, Eroglu C (2010) Quantifying synapses: an immunocytochemistry-based assay to quantify synapse number. J Vis Exp 45:2270. 10.3791/2270 [DOI] [PMC free article] [PubMed] [Google Scholar]
- Jiang Q, Thiffault C, Kramer BC, Ding GL, Zhang L, Nejad-Davarani SP, Li L, Arbab AS, Lu M, Navia B, Victor SJ, Hong K, Li QJ, Wang SY, Li Y, Chopp M (2012) MRI detects brain reorganization after human umbilical tissue-derived cells (hUTC) treatment of stroke in rat. PLoS One 7:e42845. 10.1371/journal.pone.0042845 [DOI] [PMC free article] [PubMed] [Google Scholar]
- Kimura N, Nishikawa S, Tamai M (2000) Müller cells in developing rats with inherited retinal dystrophy. Tohoku J Exp Med 191:157–166. 10.1620/tjem.191.157 [DOI] [PubMed] [Google Scholar]
- Klassen H. (2016) Stem cells in clinical trials for treatment of retinal degeneration. Expert Opin Biol Ther 16:7–14. 10.1517/14712598.2016.1093110 [DOI] [PubMed] [Google Scholar]
- Klimczak RR, Koerber JT, Dalkara D, Flannery JG, Schaffer DV (2009) A novel adeno-associated viral variant for efficient and selective intravitreal transduction of rat Müller cells. PLoS One 4:e7467. 10.1371/journal.pone.0007467 [DOI] [PMC free article] [PubMed] [Google Scholar]
- Koh S, Kim N, Yin HH, Harris IR, Dejneka NS, Eroglu C (2015) Human umbilical tissue-derived cells promote synapse formation and neurite outgrowth via thrombospondin family proteins. J Neurosci 35:15649–15665. 10.1523/JNEUROSCI.1364-15.2015 [DOI] [PMC free article] [PubMed] [Google Scholar]
- Kucukdereli H, Allen NJ, Lee AT, Feng A, Ozlu MI, Conatser LM, Chakraborty C, Workman G, Weaver M, Sage EH, Barres BA, Eroglu C (2011) Control of excitatory CNS synaptogenesis by astrocyte-secreted proteins hevin and SPARC. Proc Natl Acad Sci U S A 108:E440–E449. 10.1073/pnas.1104977108 [DOI] [PMC free article] [PubMed] [Google Scholar]
- Lim LS, Mitchell P, Seddon JM, Holz FG, Wong TY (2012) Age-related macular degeneration. Lancet 379:1728–1738. 10.1016/S0140-6736(12)60282-7 [DOI] [PubMed] [Google Scholar]
- Lund RD, Wang S, Lu B, Girman S, Holmes T, Sauvé Y, Messina DJ, Harris IR, Kihm AJ, Harmon AM, Chin FY, Gosiewska A, Mistry SK (2007) Cells isolated from umbilical cord tissue rescue photoreceptors and visual functions in a rodent model of retinal disease. Stem Cells 25:602–611. 10.1634/stemcells.2006-0308 [DOI] [PubMed] [Google Scholar]
- McCarthy KD, de Vellis J (1980) Preparation of separate astroglial and oligodendroglial cell cultures from rat cerebral tissue. J Cell Biol 85:890–902. 10.1083/jcb.85.3.890 [DOI] [PMC free article] [PubMed] [Google Scholar]
- McGill TJ, Lund RD, Douglas RM, Wang S, Lu B, Silver BD, Secretan MR, Arthur JN, Prusky GT (2007) Syngeneic Schwann cell transplantation preserves vision in RCS rat without immunosuppression. Invest Ophthalmol Vis Sci 48:1906–1912. 10.1167/iovs.06-1117 [DOI] [PubMed] [Google Scholar]
- Moore TL, Pessina MA, Finklestein SP, Kramer BC, Killiany RJ, Rosene DL (2013) Recovery of fine motor performance after ischemic damage to motor cortex is facilitated by cell therapy in the rhesus monkey. Somatosens Mot Res 30:185–196. 10.3109/08990220.2013.790806 [DOI] [PMC free article] [PubMed] [Google Scholar]
- Nandrot E, Dufour EM, Provost AC, Péquignot MO, Bonnel S, Gogat K, Marchant D, Rouillac C, Sépulchre de Condé B, Bihoreau MT, Shaver C, Dufier JL, Marsac C, Lathrop M, Menasche M, Abitbol MM (2000) Homozygous deletion in the coding sequence of the c-mer gene in RCS rats unravels general mechanisms of physiological cell adhesion and apoptosis. Neurobiol Dis 7:586–599. 10.1006/nbdi.2000.0328 [DOI] [PubMed] [Google Scholar]
- Peng YW, Senda T, Hao Y, Matsuno K, Wong F (2003) Ectopic synaptogenesis during retinal degeneration in the royal college of surgeons rat. Neuroscience 119:813–820. 10.1016/S0306-4522(03)00153-2 [DOI] [PubMed] [Google Scholar]
- Prusky GT, Alam NM, Beekman S, Douglas RM (2004) Rapid quantification of adult and developing mouse spatial vision using a virtual optomotor system. Invest Ophthalmol Vis Sci 45:4611–4616. 10.1167/iovs.04-0541 [DOI] [PubMed] [Google Scholar]
- Qu Z, Guan Y, Cui L, Song J, Gu J, Zhao H, Xu L, Lu L, Jin Y, Xu GT (2015) Transplantation of rat embryonic stem cell-derived retinal progenitor cells preserves the retinal structure and function in rat retinal degeneration. Stem Cell Res Ther 6:219. 10.1186/s13287-015-0207-x [DOI] [PMC free article] [PubMed] [Google Scholar]
- Ran FA, Cong L, Yan WX, Scott DA, Gootenberg JS, Kriz AJ, Zetsche B, Shalem O, Wu X, Makarova KS, Koonin EV, Sharp PA, Zhang F (2015) In vivo genome editing using staphylococcus aureus Cas9. Nature 520:186–191. 10.1038/nature14299 [DOI] [PMC free article] [PubMed] [Google Scholar]
- Risher WC, Eroglu C (2012) Thrombospondins as key regulators of synaptogenesis in the central nervous system. Matrix Biol 31:170–177. 10.1016/j.matbio.2012.01.004 [DOI] [PMC free article] [PubMed] [Google Scholar]
- Risher WC, Patel S, Kim IH, Uezu A, Bhagat S, Wilton DK, Pilaz LJ, Singh Alvarado J, Calhan OY, Silver DL, Stevens B, Calakos N, Soderling SH, Eroglu C (2014) Astrocytes refine cortical connectivity at dendritic spines. eLife 3:04047. 10.7554/eLife.04047 [DOI] [PMC free article] [PubMed] [Google Scholar]
- Roesch K, Jadhav AP, Trimarchi JM, Stadler MB, Roska B, Sun BB, Cepko CL (2008) The transcriptome of retinal Müller glial cells. J Comp Neurol 509:225–238. 10.1002/cne.21730 [DOI] [PMC free article] [PubMed] [Google Scholar]
- Roesch K, Stadler MB, Cepko CL (2012) Gene expression changes within Müller glial cells in retinitis pigmentosa. Mol Vis 18:1197–1214. [PMC free article] [PubMed] [Google Scholar]
- Siegert S, Cabuy E, Scherf BG, Kohler H, Panda S, Le YZ, Fehling HJ, Gaidatzis D, Stadler MB, Roska B (2012) Transcriptional code and disease map for adult retinal cell types. Nat Neurosci 15:487–495.S1–S2. 10.1038/nn.3032 [DOI] [PubMed] [Google Scholar]
- Singh SK, Stogsdill JA, Pulimood NS, Dingsdale H, Kim YH, Pilaz LJ, Kim IH, Manhaes AC, Rodrigues WS Jr, Pamukcu A, Enustun E, Ertuz Z, Scheiffele P, Soderling SH, Silver DL, Ji RR, Medina AE, Eroglu C (2016) Astrocytes assemble thalamocortical synapses by bridging NRX1alpha and NL1 via hevin. Cell 164:183–196. 10.1016/j.cell.2015.11.034 [DOI] [PMC free article] [PubMed] [Google Scholar]
- Thomas BB, Zhu D, Zhang L, Thomas PB, Hu Y, Nazari H, Stefanini F, Falabella P, Clegg DO, Hinton DR, Humayun MS (2016) Survival and functionality of hESC-derived retinal pigment epithelium cells cultured as a monolayer on polymer substrates transplanted in RCS rats. Invest Ophthalmol Vis Sci 57:2877–2887. 10.1167/iovs.16-19238 [DOI] [PubMed] [Google Scholar]
- Trachtenberg MC, Packey DJ (1983) Rapid isolation of mammalian Müller cells. Brain Res 261:43–52. 10.1016/0006-8993(83)91281-7 [DOI] [PubMed] [Google Scholar]
- Tso MO, Zhang C, Abler AS, Chang CJ, Wong F, Chang GQ, Lam TT (1994) Apoptosis leads to photoreceptor degeneration in inherited retinal dystrophy of RCS rats. Invest Ophthalmol Vis Sci 35:2693–2699. [PubMed] [Google Scholar]
- Ullian EM, Sapperstein SK, Christopherson KS, Barres BA (2001) Control of synapse number by glia. Science 291:657–661. 10.1126/science.291.5504.657 [DOI] [PubMed] [Google Scholar]
- Vecino E, Rodriguez FD, Ruzafa N, Pereiro X, Sharma SC (2016) Glia-neuron interactions in the mammalian retina. Prog Ret Eye Res 51:1–40. 10.1016/j.preteyeres.2015.06.003 [DOI] [PubMed] [Google Scholar]
- Venugopalan P, Wang Y, Nguyen T, Huang A, Müller KJ, Goldberg JL (2016) Transplanted neurons integrate into adult retinas and respond to light. Nat Commun 7:10472. 10.1038/ncomms10472 [DOI] [PMC free article] [PubMed] [Google Scholar]
- Wang S, Lu B, Lund RD (2005) Morphological changes in the Royal College of Surgeons rat retina during photoreceptor degeneration and after cell-based therapy. J Comp Neurol 491:400–417. 10.1002/cne.20695 [DOI] [PubMed] [Google Scholar]
- Wang S, Lu B, Girman S, Holmes T, Bischoff N, Lund RD (2008) Morphological and functional rescue in RCS rats after RPE cell line transplantation at a later stage of degeneration. Invest Ophthalmol Vis Sci 49:416–421. 10.1167/iovs.07-0992 [DOI] [PubMed] [Google Scholar]
- Werblin FS, Dowling JE (1969) Organization of the retina of the mudpuppy, Necturus maculosus: II. Intracellular recording. J Neurophysiol 32:339–355. 10.1152/jn.1969.32.3.339 [DOI] [PubMed] [Google Scholar]
- Williams PR, Suzuki SC, Yoshimatsu T, Lawrence OT, Waldron SJ, Parsons MJ, Nonet ML, Wong RO (2010) In vivo development of outer retinal synapses in the absence of glial contact. J Neurosci 30:11951–11961. 10.1523/JNEUROSCI.3391-10.2010 [DOI] [PMC free article] [PubMed] [Google Scholar]
- Winzeler A, Wang JT (2013) Purification and culture of retinal ganglion cells from rodents. Cold Spring Harbor Protoc 2013:643–652. 10.1101/pdb.top070961 [DOI] [PubMed] [Google Scholar]
- Yafai Y, Eichler W, Iandiev I, Unterlauft JD, Jochmann C, Wiedemann P, Bringmann A (2014) Thrombospondin-1 is produced by retinal glial cells and inhibits the growth of vascular endothelial cells. Ophthalmic Res 52:81–88. 10.1159/000362371 [DOI] [PubMed] [Google Scholar]
- Zhang L, Li Y, Zhang C, Chopp M, Gosiewska A, Hong K (2011) Delayed administration of human umbilical tissue-derived cells improved neurological functional recovery in a rodent model of focal ischemia. Stroke 42:1437–1444. 10.1161/STROKEAHA.110.593129 [DOI] [PubMed] [Google Scholar]
- Zhang L, Li Y, Romanko M, Kramer BC, Gosiewska A, Chopp M, Hong K (2012) Different routes of administration of human umbilical tissue-derived cells improve functional recovery in the rat after focal cerebral ischemia. Brain Res 1489:104–112. 10.1016/j.brainres.2012.10.017 [DOI] [PubMed] [Google Scholar]
- Zhang L, Yi L, Chopp M, Kramer BC, Romanko M, Gosiewska A, Hong K (2013) Intravenous administration of human umbilical tissue-derived cells improves neurological function in aged rats after embolic stroke. Cell Transplant 22:1569–1576. 10.3727/096368912X658674 [DOI] [PubMed] [Google Scholar]
- Zhao C, Wang Q, Temple S (2017) Stem cell therapies for retinal diseases: recapitulating development to replace degenerated cells. Development 144:1368–1381. 10.1242/dev.133108 [DOI] [PMC free article] [PubMed] [Google Scholar]
- Zhao TT, Tian CY, Yin ZQ (2010) Activation of Müller cells occurs during retinal degeneration in RCS rats. Adv Exp Med Biol 664:575–583. 10.1007/978-1-4419-1399-9_66 [DOI] [PubMed] [Google Scholar]