

Abstract
Exercise and calorie restriction (CR) can each improve insulin sensitivity in older individuals, but benefits of combining these treatments on skeletal muscle insulin signaling and glucose uptake are poorly understood, especially in predominantly slow-twitch muscles (eg, soleus). Accordingly, our purpose was to determine independent and combined effects of prior acute exercise and CR (beginning at 14 weeks old) on insulin signaling and glucose uptake in insulin-stimulated soleus muscles of 30-month-old rats. CR alone (but not exercise alone) versus ad libitum sedentary controls induced greater insulin-stimulated glucose uptake. There was a main effect of diet (CR > ad libitum) for insulin-stimulated Akt Ser473 and Akt Thr308 phosphorylation. CR alone versus ad libitum sedentary increased Akt substrate of 160kDa (AS160) Ser 588 phosphorylation and TBC1D1 Thr 596 , but not AS160 Thr 642 phosphorylation or abundance of GLUT4, GLUT1, or hexokinase II proteins. Combined CR and exercise versus CR alone did not further increase insulin-stimulated glucose uptake although phosphorylation of Akt Ser473 , Akt Thr308 , TBC1D1 Thr596 , and AMPK Thr172 for the combined group exceeded values for CR and/or exercise alone. These results revealed that although the soleus was highly responsive to a CR-induced enhancement of insulin-stimulated glucose uptake, the exercise protocol did not elevate insulin-stimulated glucose uptake, either alone or when combined with CR.
Keywords: Glucose transport, Glucose transporter, Dietary restriction, Insulin resistance, Physical activity
Whole-body insulin resistance is predictive of the subsequent development of many age-related diseases ( 1 ). Because skeletal muscle accounts for the largest portion of insulin-mediated glucose uptake ( 2 ), elucidating interventions that increase skeletal muscle glucose uptake is highly relevant for improving health with advancing age. Either exercise or moderate calorie restriction (CR; consuming ~20%–40% below ad libitum [AL] intake) can independently elevate insulin-mediated glucose uptake in either predominantly fast-twitch or predominantly slow-twitch skeletal muscle of rats up to 24 months old ( 3–7 ). A crucial aspect of the current study was the inclusion of (i) a sedentary and AL control group that was not subjected to either CR or exercise; (ii) a CR only group; (iii) an exercise only group; and (iv) a combined CR and exercise group. Including all four groups is essential to assess the independent and combined effects of CR and exercise. To the best of our knowledge, both insulin signaling and glucose uptake by skeletal muscle have been previously reported for all four of these groups only in our recent study ( 8 ). Separate benefits of CR or acute exercise were observed in the predominantly fast-twitch epitrochlearis muscle from 30-month-old rats, and CR combined with exercise produced even greater insulin-stimulated glucose uptake compared with exercise or CR alone in the epitrochlearis ( 8 ).
Physiological responses to diet and exercise can diverge for muscles with different fiber-type profiles. Thus, a second crucial aspect of this study was that it focused on the predominantly slow-twitch soleus from the same rats that provided the fast-twitch epitrochlearis in our earlier study ( 8 ) with the aim of determining the independent and combined effects of acute exercise and chronic CR on insulin-stimulated glucose uptake in the predominantly slow-twitch soleus. Using the same rats provides an advantage when comparing the results from the two muscles.
The second aim of the current study was to elucidate potential mechanisms for CR and/or exercise effects on insulin-stimulated glucose uptake by the soleus. Isolated soleus muscles from 30-month-old rats were analyzed to ascertain the effects of chronic CR (initiated at 14 weeks old) and/or acute exercise on (i) insulin-stimulated glucose uptake; (ii) activation of key insulin signaling steps that regulate glucose uptake (insulin receptor Tyr 1146 phosphorylation, Akt Ser 473 and Thr 308 phosphorylation, AS160 Ser 588 and Thr 642 phosphorylation, and TBC1D1 Thr 590 phosphorylation); (iii) abundance of GLUT4, GLUT1, and hexokinase II (proteins that control glucose transport and phosphorylation); (iv) Ser 2231 phosphorylation of Filamin-C (FLNc); and (v) Thr 172 phosphorylation of AMPK. We hypothesized that CR and exercise would each lead to increased insulin-stimulated glucose uptake and that a further increase would occur with combined CR and exercise. We also hypothesized that the elevated insulin-stimulated glucose uptake with the respective treatments would be accompanied by increased Akt phosphorylation.
Research Design and Methods
Materials
All of the chemicals were from Sigma-Aldrich (St. Louis, MO) or Fisher Scientific (Hanover Park, IL) or unless otherwise noted. The apparatus and reagents for sodium dodecyl sulfate–polyacrylamide gel electrophoresis and immunoblotting were obtained from Bio-Rad Laboratories (Hercules, CA). Pierce MemCode Reversible Protein Stain Kit and bicinchoninic acid protein assay were from Thermo Fisher (Waltham, MA). Anti-phospho insulin receptor Tyr 1146 (pIR Tyr1146 ; #3021), anti-insulin receptor (IR; #3025), anti-phospho Akt Ser 473 (pAkt Ser473 ; #9272), anti-phospho Akt Thr 308 (pAkt Thr308 ; #9275), anti-Akt (#4691), anti-Akt2 (#3063), anti-phospho Akt2 Ser 474 (pAkt2 Ser474 ; #8599), anti-phospho AS160 Thr 642 (pAS160 Thr642 ; #8881), anti-phospho AS160 Ser 588 (pAS160 Ser588 ; #8730), anti-TBC1D1 (#5929), anti-phospho TBC1D1 Thr 596 (pTBC1D1 Thr596 ; #6927), anti-phospho AMPKα Thr 172 (pAMPK Thr172 ; #2531), anti-AMP-activated protein kinase-α (AMPK; #5831), anti-hexokinase II (#2867), and anti-rabbit IgG horseradish peroxidase conjugate (#7074) were from Cell Signaling Technology (Danvers, MA). Anti-GLUT4 (#CBL243), anti-GLUT1 (#CBL242), and anti-Akt substrate of 160kDa (AS160; #ABS54) were obtained from EMD Millipore (Billerica, MA). Anti-Filamin-C (FLNc; #sc-48496), anti-goat IgG horseradish peroxidase conjugate (#sc-2020), and anti-mouse IgG horseradish peroxidase conjugate (#sc-2060) were purchased from Santa Cruz Biotechnology (Santa Cruz, CA). Anti-phospho Filamin-C Ser 2231 (pFLNc Ser2231 ; #PB-131) was obtained from Kinasource (Dundee, Scotland, UK). [ 3 H]-2-Deoxy- d -glucose ([ 3 H]-2-DG) and d -[ 14 C]-mannitol were purchased from PerkinElmer (Boston, MA).
Animal Treatment
Animal care procedures were approved by the University of Michigan Committee on Use and Care of Animals. AL and CR male Fischer-344 × Brown Norway (FBN) rats were obtained from National Institute of Aging (NIA) Calorie Restricted Rodent Colony at approximately 29 months old. Calorie restriction for the CR group was begun in 14-week-old rats when they were housed at the NIA. Animals were individually housed at the University of Michigan in specific pathogen-free conditions in shoebox cages (12-12 hour light-dark cycle; lights out at 17:00 hours) for approximately 1 month prior to the terminal experiment. AL rats were given NIH31 chow and CR rats were provided with NIH31/NIA-fortified chow including sufficient vitamin supplementation for the CR animals to ingest vitamins at levels comparable with the AL controls eating NIH31 chow. The CR rats were provided 60%–65% of AL daily intake. Animals were fed between 15:30 and 16:30 pm daily, and food intake was determined each day. The terminal experiment was performed when the animals were ~30 months old. The animals were fasted at approximately 19:00 on the night before the experiment. At approximately 07:00 on the next morning, the rats in the exercise groups swam in a barrel filled with water (35°C; 45cm depth; three AL and three CR rats). The exercise was nine swimming bouts (10 minutes per bout) with 10-minute rest periods between each bout. Following 90 minutes of exercise, rats were dried and returned to their cages without food. Soleus muscles were dissected from anesthetized time-matched sedentary and exercised animals at 3–4 hours after the conclusion of exercise.
Muscle Dissection and Incubation
When rats were deeply anesthetized by an intraperitoneal injection of sodium pentobarbital (50mg/kg), soleus muscles were dissected out and rapidly rinsed in Krebs–Henseleit buffer. Muscles were longitudinally split into four strips that were placed in vials including the appropriate media, shaken at 45 revolutions per minute while continuously gassed (95% O 2 –5% CO 2 ) in a heated (35°C) water bath. Krebs–Henseleit buffer (2mL) supplemented with bovine serum albumin (0.1%), 2mM sodium pyruvate, 6mM mannitol, and no insulin (basal) or a submaximally effective insulin dose (0.6nM) was included in the vials during the initial incubation step (30 minutes). Muscles were subsequently transferred for 20 minutes to a vial containing 2mL Krebs–Henseleit buffer/bovine serum albumin, the same insulin dose, 0.1mM 2-DG (with a final specific activity of 2.25 mCi/mmol [ 3 H]-2-DG), and 5.9mM mannitol (with a final specific activity of 0.022 mCi/mmol [ 14 C]-mannitol). Following this step, muscles were blotted on filter paper moistened with ice-cold Krebs–Henseleit buffer, trimmed, freeze-clamped using aluminum tongs cooled in liquid nitrogen, and stored at −80°C for subsequent processing and analysis.
Muscle Processing
Frozen muscles were weighed and then homogenized in ice-cold lysis buffer (1mL) using a TissueLyser II homogenizer (Qiagen, Valencia, CA). The lysis buffer included T-PER Tissue Protein Extraction Reagent (#PI-78510; Thermo Scientific, Rockford, IL) along with 1mM ethylenediaminetetraacetic acid, 1mM ethylene glycol tetraacetic acid, 2.5mM sodium pyrophosphate, 1mM sodium vanadate, 1mM β-glycerophosphate, 1 µg/mL leupeptin, and 1mM phenylmethylsulfonyl fluoride. Lysates were rotated for 1 hour (4°C) prior to centrifugation (15,000 g for 15 minutes at 4°C). The supernatants were transferred to microfuge tubes and stored at −80°C for subsequent analyses. Protein concentration was determined using the bicinchoninic acid procedure (Pierce Biotechnology, Rockford, IL; #23225).
2-Deoxy- d -Glucose Uptake
Aliquots of the supernatants from muscle lysates were pipetted in a vial along with scintillation cocktail (Research Products International, Mount Prospect, IL). A scintillation counter (PerkinElmer) determined the 3 H and 14 C disintegrations per minute. 2-DG uptake was calculated as previously described ( 9–11 ).
Immunoblotting
An equal amount of protein from muscle lysates was combined with 6× Laemmli buffer, boiled (5 minutes), separated by sodium dodecyl sulfate–polyacrylamide gel electrophoresis (7% resolving gel), and transferred to polyvinyl difluoride membranes. Equal loading was confirmed using the MemCode protein stain. Bovine serum albumin (5% in TBST; Tris-buffered saline, pH 7.5 plus 0.1% Tween-20) was used for blocking (1 hour at room temperature). Membranes were then washed (3 times 5 minutes in TBST) and subsequently incubated with primary antibody (in TBST plus 5% bovine serum albumin) overnight (4°C) and washed (3 times for 5 minutes in TBST). Next, membranes were incubated with secondary antibody (1 hour at room temperature) and washed (3 times for 5 minutes) in TBST, followed by washing (3 times for 5 minutes) in TBS. Enhanced chemiluminescence (Luminata Forte Western HRP Substrate; #WBLUF0100; Millipore) was used to visualize the protein bands that were quantified via densitometry (AlphaEase FC; Alpha Innotech, San Leandro, CA). Results were expressed relative to the normalized mean of all the samples on the blot.
Statistical Analysis
Two-way analysis of variance was performed for each insulin dose (0 or 0.6nM), and the two independent factors were diet (the two levels for diet were AL or CR) and exercise (the two levels for exercise were sedentary or 3 hours post-exercise). The interaction effect (Diet × Exercise) was also determined, and the Tukey test was used for post hoc analysis to identify the source of significant variance for main effects or interaction effects (SigmaPlot version 11.0; Systat Software, San Jose, CA). When data were not characterized by normal distribution and/or equal variance, they were transformed to attain normality and equal variance before performing two-way analysis of variance. Kruskal–Wallis one-way analysis of variance on ranks was used if transformation was unable to normalize the data or equalize the variance, and post hoc analysis used Dunn’s method. Spearman’s rank order correlation was used to test associations between two parameters.
Results
2-Deoxy- d -Glucose Uptake
For 2-DG uptake in muscles incubated without insulin ( Figure 1 ), there was a significant ( p < .01) main effect of diet (CR > AL). Post hoc analysis indicated the 3 hours post-exercise and CR (3hPEX-CR) group exceeded the 3 hours post-exercise and AL (3hPEX-AL; p < .01). For 2-DG uptake in muscles incubated with insulin ( Figure 1 ), there was significant ( p < .001) main effect of diet (CR > AL). Post hoc analysis revealed the sedentary and CR (SED-CR) group exceeded the sedentary and AL (SED-AL) group ( p < .001), the 3hPEX-CR group was greater than 3hPEX-AL groups ( p < .001).
Figure 1.

Rates of 2-deoxy- d -glucose (2-DG) uptake in muscles from sedentary ad libitum (SED-AL), sedentary calorie restricted (SED-CR), 3 hours post-exercise ad libitum (3hPEX-AL), and 3 hours post-exercise calorie restricted (3hPEX-CR) rats. Data were analyzed using two-way analysis of variance within each insulin level (without or with insulin). Post hoc analysis indicated for muscles without insulin: ‡ 3hPEX-CR > 3hPEX-AL ( p < .01). Post hoc analysis indicated for muscles with insulin: *SED-CR > SED-AL ( p < .001), † 3hPEX-CR > 3hPEX-AL ( p < .001). Values are means ± SE ; n = 8–11 per treatment group.
Immunoblotting
Equal loading of samples was confirmed based on the MemCode results ( 8 , 12 ). For all of the phosphorylated proteins, the data were expressed as a ratio of the phosphorylated-to-total protein values. Expressing the results as phosphorylated-to-total protein ratio rather than as the phosphorylated protein without dividing by the total protein value did not change the interpretation of the results for any of the proteins that were assessed.
Insulin Receptor
For total IR abundance, there was a moderate (~19%), but significant effect of diet (AL > CR) either without insulin ( p < .05) or with insulin ( p < .05; data not shown). Post hoc analysis indicated that in the absence of insulin, SED-CR exceeded SED-AL values ( p < .05). In the presence of insulin, 3hPEX-CR values were greater than 3hPEX-AL values ( p < .01; data not shown). For pIR Tyr1146 /IR ratio in the absence of insulin, there were significant effects of diet (AL > CR; p < .001) and exercise (SED > 3hPEX; p < .001; Figure 2 ). Post hoc analysis indicated that SED-AL values exceeded both SED-CR ( p < .001) and 3hPEX-AL values ( p < .01), 3hPEX-AL ( p < .001) and CR-SED values ( p < .05) were each greater than 3hPEX-CR values. For pIR Tyr1146 /IR ratio in the presence of insulin, there was no significant effect of diet and exercise ( Figure 2 ).
Figure 2.

Phosphorylated pIR Tyr1146 /IR (A) in muscles from sedentary ad libitum (SED-AL), sedentary calorie restricted (SED-CR), 3 hours post-exercise ad libitum (3hPEX-AL), and 3 hours post-exercise calorie restricted (3hPEX-CR) rats. Representative immunoblots (B). Data were analyzed using two-way analysis of variance for samples with insulin. Post hoc analysis indicated for muscles without insulin: *SED-AL > 3hPEX-AL ( p < .001) and SED-CR ( p < .01). † SED-CR ( p < .05) and 3hPEX-AL ( p < .001) > 3hPEX-CR. Values are means ± SE ; n = 8–11 per treatment group.
Akt and Akt2
There was no significant effect of diet or exercise on total Akt or total Akt2 abundance (data not shown). For pAkt Thr308 /Akt ratio in the absence of insulin, there was significant ( p < .01) main effect of diet (CR > AL; Figure 3A ). Post hoc analysis revealed that the SED-CR group was greater than the SED-AL group ( p < .05) and the 3hPEX-CR exceeded the 3hPEX-AL group ( p < .05). For pAkt Thr308 /Akt ratio in the presence of insulin, there were significant effects of diet (CR > AL; p < .01) and exercise (3hPEX > SED; p < .05; Figure 3A ). Post hoc analysis indicated that the 3hPEX-CR group was greater than the 3hPEX-AL group ( p < .01). For the pAkt Ser473 /Akt ratio in the absence of insulin, the SED-CR exceeded the SED-AL group ( p < .01; Figure 3B ). In the presence of insulin, there were significant main effects of diet (CR > AL; p < .01) and exercise (3hPEX > SED; p < .05) on the pAkt Ser473 /Akt ratio ( Figure 3B ). Post hoc analysis demonstrated that the 3hPEX-CR group exceeded both the 3hPEX-AL ( p < .01) and the SED-CR ( p < .05) groups. For the pAkt2 Ser474 /Akt2 ratio in the absence of insulin, there was a significant effect of diet (CR > AL; p < .05; Supplementary Figure 1 ). In the presence of insulin, there were significant effects of diet (CR > AL; p < .001) and exercise (3hPEX > SED; p < .05), as well as a significant Diet × Exercise interaction ( p < .05). Post hoc analysis indicated that the 3hPEX-CR group exceeded both the 3hPEX-AL and SED-CR groups ( p < .01). There was a significant ( p < .00001) correlation ( R = .891) between pAkt2 Ser474 /Akt2 and pAkt Ser473 /Akt.
Figure 3.
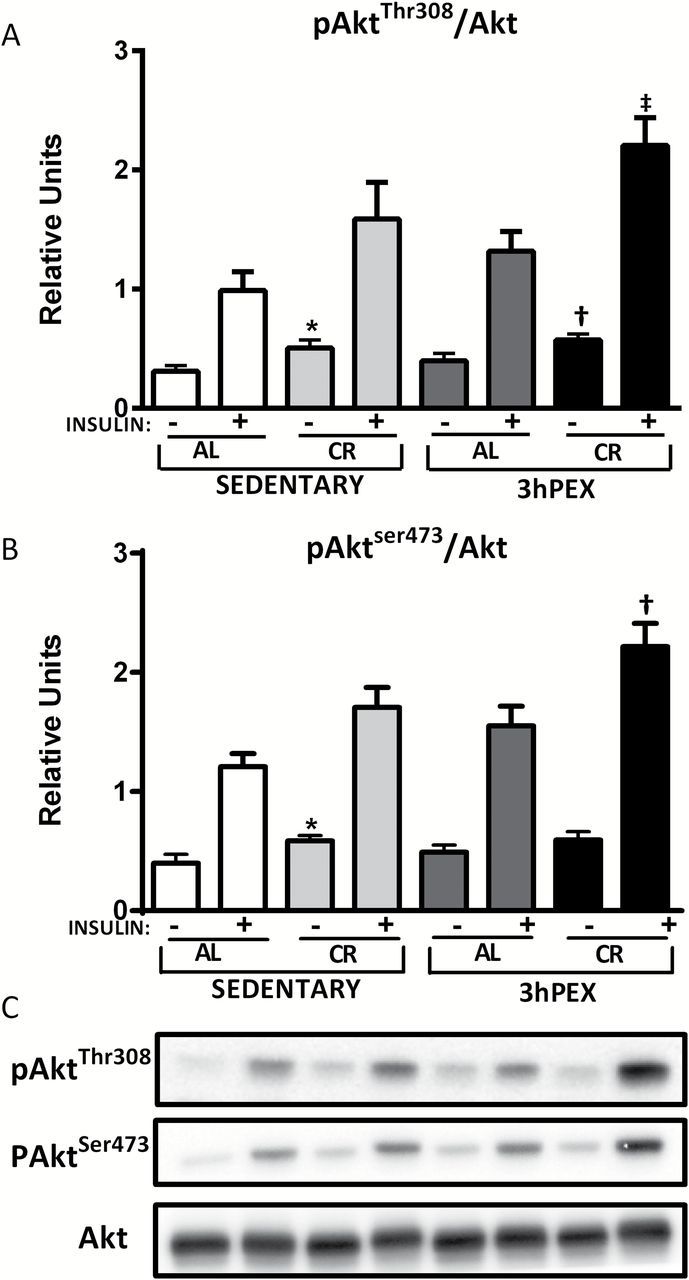
Phosphorylated Akt Thr308 /Akt (A), and phosphorylated Akt Ser473 /Akt (B), in muscles from sedentary ad libitum (SED-AL), sedentary calorie restricted (SED-CR), 3 hours post-exercise ad libitum (3hPEX-AL), and 3 hours post-exercise calorie restricted (3hPEX-CR) rats. Representative immunoblots (C). Results for Akt Ser473 /Akt without insulin were analyzed using one-way analysis of variance (ANOVA) on ranks because these data were not normally distributed. All other data were analyzed using two-way ANOVA within each insulin level (without or with insulin). Post hoc analysis indicated for muscles without insulin: *SED-CR > SED-AL ( p < .05 for Akt Thr308 , p < .01 for Akt Ser473 ); † 3hPEX-CR > 3hPEX-AL ( p < .05). Post hoc analysis indicated for muscles with insulin: ‡ 3hPEX-CR > 3hPEX-AL ( p < .01); † 3hPEX-CR > 3hPEX-AL ( p < .01) and SED-CR ( p < .05). Values are means ± SE ; n = 8–11 per treatment group.
AS160
There was no significant effect of diet or exercise on AS160 total abundance (data not shown). For the ratio of pAS160 Ser588 /AS160 in the absence of insulin, there were no significant effects of diet or exercise, but there was a significant Diet × Exercise interaction ( p < .05; Figure 4A ). Post hoc analysis revealed 3hPEX-CR values exceeded 3hPEX-AL values ( p < .05). For the ratio of pAS160 Ser588 /AS160 in the presence of insulin, there was a significant effect of diet (CR > AL; p < .01; Figure 4A ). Post hoc analysis revealed that SED-CR values exceeded SED-AL values ( p < .01). For the ratio of pAS160 Thr642 /AS160, there were no significant effects of diet or exercise, either in the absence or presence of insulin ( Figure 4B ).
Figure 4.

Phosphorylated AS160 Ser588 /AS160 (A), and phosphorylated AS160 Thr642 /AS160 (B), phosphorylated TBC1D1 Thr596 /TBC1D1 (D), in muscles from sedentary ad libitum (SED-AL), sedentary calorie restricted (SED-CR), 3 hours post-exercise ad libitum (3hPEX-AL), and 3 hours post-exercise calorie restricted (3hPEX-CR) rats. Representative immunoblots (C and E). Data were analyzed using two-way analysis of variance within each insulin level (without or with insulin). Post hoc analysis indicated that for muscles incubated without insulin: † 3hPEX-CR > 3hPEX-AL ( p < .01). Post hoc analysis indicated for muscles with insulin: *SED-CR > SED-AL ( p < .05 for pAS160 Ser588 ; p < .001 for pTBC1D1 Thr596 ). † 3hPEX-CR > 3hPEX-AL ( p < .001). Values are means ± SE ; n = 8–11 per treatment group.
TBC1D1
There was no significant effect of diet or exercise on total TBC1D1 abundance (data not shown). For the ratio of pTBC1D1 Thr596 /TBC1D1 in the absence of insulin, there were no significant effects of either diet or exercise. For the ratio of pTBC1D1 Thr596 /TBC1D1 in the presence of insulin, there was a significant effect of diet (CR > AL; p < .001; Figure 4D ). Post hoc analysis indicated that SED-CR exceeded SED-AL ( p < .001), and 3hPEX-CR was greater than 3hPEX-AL ( p < .001).
Filamin-C
For FLNc in the absence of insulin, there was a small (~10%), but significant diet effect on total abundance (AL > CR; p < .01; data not shown), and post hoc analysis indicated that SED-AL values were greater than SED-CR values ( p < .05). For the FLNc Ser2231 /FLNc ratio, there were no significant effects of diet or exercise either without insulin or with insulin ( Figure 5 ).
Figure 5.

Phosphorylated FLNc Ser2231 /FLNc (A) in muscles from sedentary ad libitum (SED-AL), sedentary calorie restricted (SED-CR), 3 hours post-exercise ad libitum (3hPEX-AL), and 3 hours post-exercise calorie restricted (3hPEX-CR) rats. Representative immunoblots (B). Data were analyzed using two-way analysis of variance for samples with insulin. Values are means ± SE ; n = 8–11 per treatment group.
AMPK
For total AMPK abundance, there was a small (~12%), but significant effect of diet (AL > CR) without insulin ( p < .05; data not shown). Post hoc analysis indicated no further significant effect. For pAMPK Thr172 /AMPK ratio in the absence of insulin, there were significant effects of exercise (3hPEX > SED; p < .05; Figure 6 ). Post hoc analysis indicated no further significant effect. For pAMPK Thr172 /AMPK ratio in the presence of insulin, there were significant effects of exercise (3hPEX > SED; p < .05; Figure 6 ). Post hoc analysis revealed that 3hPEX-CR values were greater than both 3hPEX-AL ( p < .05) and SED-CR values ( p < .01).
Figure 6.

Phosphorylated AMPK Thr172 /AMPK (A) in muscles from sedentary ad libitum (SED-AL), sedentary calorie restricted (SED-CR), 3 hours post-exercise ad libitum (3hPEX-AL), and 3 hours post-exercise calorie restricted (3hPEX-CR) rats. Representative immunoblots (B). Data were analyzed using two-way analysis of variance within each insulin level (without or with insulin). Post hoc analysis indicated for muscles with insulin: *3hPEX-CR > 3hPEX-AL ( p < .05) and SED-CR ( p < .01). Values are means ± SE ; n = 8–11 per treatment group.
GLUT4, GLUT1, and Hexokinase II
There was a small (~7%), but significant ( p < .01) diet effect and a Diet × Exercise interaction ( p < .01) on GLUT4 abundance (CR > AL; Supplementary Figure 2 ), and post hoc analysis indicated that 3hPEX-CR values exceeded both 3hPEX-AL ( p < .001) and SED-CR ( p < .01) values. There was a small (~11%), but significant ( p < .01) exercise effect on GLUT1 abundance (SED > 3hPEX; Supplementary Figure 3 ). There were no significant effects of diet or exercise on hexokinase II abundance ( Supplementary Figure 4 ).
Discussion
This study was the first to evaluate the combined effects of CR and acute exercise on insulin-stimulated glucose uptake and insulin signaling in a predominantly slow-twitch muscle. The most important new functional results were that insulin-stimulated glucose uptake by the soleus of 30-month-old rats (i) was significantly increased by CR alone; (ii) not significantly increased by acute exercise alone; and (iii) was not greater for combined CR and acute exercise versus CR alone. By evaluating key insulin signaling proteins and the proteins that regulate glucose transport and phosphorylation, the current study also provided novel insights into the potential mechanisms for these functional outcomes.
No animal model exactly replicates human biology, but the male FBN rat is a preferred model for elucidating aging effects on skeletal muscle with potential relevance for humans ( 13 ). Focusing first on the effects of CR alone, this study extended the observations from earlier research that demonstrated CR caused greater insulin-stimulated glucose uptake in the predominantly slow-twitch soleus of 24-month-old male FBN rats ( 5 ). For male FBN rats, 24 months corresponds with ~90% survival and 30 months corresponds to ~70% survival ( 14 ). For men in the U.S. population, 90% survival corresponds to ~55 years old, and 70% survival corresponds to ~70 years old ( 15 ). Although modest age-related changes are evident in the soleus of 30-month-old FBN rats (eg, reduced citrate synthase and lactate dehydrogenase activities), soleus mass does not markedly decline until later in life ( 16 , 17 ). Previous research indicated that CR produced increased insulin-stimulated glucose uptake in the predominantly fast-twitch epitrochlearis muscle at 30 months old ( 8 ). The consistent effect of CR on insulin-stimulated glucose in the soleus and epitrochlearis from older rats corresponds with the results of many studies with younger rodents that have found that CR can improve insulin-stimulated glucose uptake in muscles with differing fiber-type profiles ( 18–20 ). Taken together, these studies have revealed CR’s very robust effect on insulin-stimulated glucose uptake in isolated muscles of diverse fiber-type compositions across a wide range of the adult life span.
The most consistent CR effect on insulin signaling in muscle is increased insulin-stimulated Akt phosphorylation. In the current study, there was a significant main effect of diet (CR > AL) for Akt phosphorylation on both Ser 473 and Thr 308 . Earlier research in the soleus of 24-month-old rats also demonstrated greater insulin-stimulated Akt phosphorylation on both Ser 473 and Thr 308 ( 5 ). In the soleus of ~2 to 3-month-old mice, CR resulted in greater Akt Ser 473 and Thr 308 phosphorylation ( 18 , 21 ). Several studies have found that CR causes elevated Akt phosphorylation on Ser 473 and Thr 308 in epitrochlearis muscles of ~5 to 9-month-old rats ( 20 , 22–25 ). The current study was the first to demonstrate CR leads to greater Akt2 phosphorylation in muscle from old animals. This result is significant because it confirms earlier results for CR in young animals ( 18 , 22 , 24 ) and because Akt2 is the isoform that regulates insulin-stimulated glucose transport ( 26 ). A previous study demonstrated that in 9-month-old rats, a selective Akt inhibitor prevented CR’s enhancement of both Akt phosphorylation and insulin-stimulated glucose uptake in the predominantly fast-twitch epitrochlearis muscle ( 24 ). It would be valuable to use a similar approach to learn if CR effects on Akt phosphorylation are also crucial for increased insulin-stimulated glucose uptake in the soleus.
Compelling evidence links site-specific phosphorylation of AS160 on Ser 588 and Thr 642 to insulin’s activation of Akt to GLUT4 glucose transporter translocation to cell surface membranes and greater glucose uptake ( 27–33 ). CR alone resulted in greater phosphorylation of AS160 on Ser 588 , but not on Thr 642 . Earlier research demonstrated that in the epitrochlearis from 9-month-old rats, CR induces greater AS160 phosphorylation on both Thr 642 and Ser 588 ( 20 ). However, analysis of the soleus from 9- and 24-month-old rats revealed that CR did not elevate insulin-stimulated AS160 phosphorylation on either site ( 5 , 20 , 34 ). Taken together, these results suggest that the CR-induced enhancement of insulin-stimulated glucose uptake in the soleus may involve Akt substrates other than AS160.
Therefore, we evaluated the phosphorylation of TBC1D1, a paralog protein of AS160 that is also an Akt substrate ( 28 , 35 ). TBC1D1 Thr 596 , which corresponds to Thr 642 in AS160, becomes phosphorylated in response to insulin treatment ( 28 , 36 , 37 ). The current study included the novel observation that CR led to greater pTBC1D1 Thr 596 in insulin-stimulated muscle. Convincing evidence links phosphorylation of AS160 on Ser 588 and Thr 642 to insulin-stimulated GLUT4 translocation and glucose transport ( 28 ), but the role of TBC1D1 Thr 596 phosphorylation for insulin-stimulated glucose transport in muscle is uncertain in light of the report that insulin-stimulated glucose uptake was unaffected in muscle overexpressing TBC1D1 that was mutated to prevent Thr 596 phosphorylation ( 38 ). However, it is possible that the endogenous, nonmutated TBC1D1 in the muscle of this earlier study may have been sufficient for the normal glucose uptake ( 38 ).
FLNc is another interesting protein because it is an insulin-regulated Akt substrate and actin-binding protein that is selectively expressed in skeletal muscle ( 39 , 40 ), and actin remodeling has been linked to the subcellular localization of insulin signaling proteins and GLUT4 ( 41 ). In addition, the abundance of GLUT4 is positively correlated to the abundance of FLNc in single fibers from rat skeletal muscle ( 42 ). Furthermore, FLNc becomes Ser 2231 phosphorylated in response to insulin stimulation ( 24 , 43 ). However, in the current study, CR did not alter FLNc Ser2231 phosphorylation. This outcome differs from earlier results for the epitrochlearis of 9-, 24-, and 30-month-old rats in which CR resulted in greater insulin-stimulated FLNc Ser2231 phosphorylation ( 8 , 24 , 43 ). The current data indicate that in the soleus, greater FLNc phosphorylation was not essential for enhanced insulin-stimulated glucose uptake.
The combined CR and exercise group was characterized by elevated pAMPK Thr 172 in insulin-stimulated muscles. However, glucose uptake for the combined CR and exercise group did not exceed glucose uptake for CR alone. Elevated AMPK phosphorylation in the combined group may have some functional consequences because AMPK has a vast number of biological effects, including altered lipid metabolism, protein metabolism, and gene expression ( 44 ).
There was no evidence that greater GLUT4 or hexokinase II abundance was important for the CR-induced increase in glucose uptake by the soleus, consistent with earlier results in the soleus of 24-month-old rats ( 5 ). Furthermore, neither GLUT4 nor hexokinase II levels were elevated by CR in the predominantly fast-twitch epitrochlearis of 30-month-old rats ( 8 ). Previous research in the epitrochlearis of young rats demonstrated that CR can induce greater insulin-stimulated GLUT4 translocation ( 45 ), and it seems reasonable to predict a similar result for the soleus of older animals.
The modestly (~17%) greater basal glucose uptake for SED-CR versus SED-AL is similar to the trend from our earlier studies for ~15%–20% greater basal glucose in the soleus of CR rats ( 5 , 34 ). We assessed GLUT1 abundance, a glucose transporter that contributes to basal glucose uptake, but found no CR effect. AMPK activation is believed to trigger increased cell-surface GLUT4 content, leading to greater insulin-independent glucose uptake ( 46 ), but CR alone did not increase pAMPK Thr 172 . Additional research will be needed to determine if CR alters any of the various other signals that are proposed to elevate insulin-independent glucose uptake ( 46 ).
AMPK activation can also modulate insulin sensitivity ( 44 , 47 ). Earlier research has differed with regard to CR’s effect on the activation of AMPK in muscle. In the current study, CR alone did not alter AMPK Thr172 phosphorylation, consistent with results of most of the previous studies that tested for possible CR effects on AMPK in muscle ( 18 , 20 , 21 , 48 , 49 ). However, a smaller number of studies have found CR-related activation of muscle AMPK ( 50–52 ). The reason for the differing results is uncertain, but differences in the muscles studied may be a factor. Studies that reported no CR effect have included rat soleus and epitrochlearis ( 20 ) and mouse extensor digitorum longus, gastrocnemius, soleus, and unspecified muscles ( 18 , 21 , 48 , 49 ). Studies reporting that CR increased AMPK activation were in mouse quadriceps, hindlimb muscles, and unspecified muscles ( 50–52 ).
Focusing on the independent effects of exercise, insulin-mediated glucose uptake was not significantly elevated in the current study. This observation differs from earlier results in 24-month-old rats, in which soleus glucose uptake was increased after a similar exercise protocol ( 4 ). It also differs from results for the epitrochlearis from the same rats ( 8 ). It is possible that with advancing age, the soleus becomes less responsive to exercise-induced improvements in insulin sensitivity. It is also possible that in the current study, the soleus was insufficiently recruited to enhance subsequent insulin-stimulated glucose uptake and that a different exercise protocol would be effective for increasing insulin-stimulated glucose uptake by the soleus of 30-month-old rats.
It is notable that the absence of an exercise effect on insulin-stimulated glucose uptake in the soleus was accompanied by no significant exercise effects on the phosphorylation of any of the signaling proteins that were studied (Akt, AS160, TBC1D1, FLNc, or AMPK). There was also no effect of exercise alone on GLUT4 or hexokinase II abundance in the soleus. The same exercise protocol in the same rats was previously found to elevate Akt Ser 473 and Thr 308 phosphorylation and FLNc Ser2231 phosphorylation in insulin-stimulated epitrochlearis concomitant with greater GLUT4 abundance ( 8 ). However, it is uncertain if any of these results can account for the difference between the soleus and the epitrochlearis for exercise effects on insulin-stimulated glucose uptake.
Changes in mitochondrial function and/or muscle lipids are associated with altered insulin sensitivity, so it is reasonable to consider possible relationships between these parameters and improved insulin sensitivity after CR and/or exercise. An advantage of assessing insulin sensitivity a few hours after acute exercise in this study was that it would not be expected to produce large changes in mitochondrial content. However, even acute exercise can transiently influence mitochondrial function. Accumulation of ceramides and/or diacylglycerols are associated with insulin resistance ( 53 ), but acute exercise caused increased insulin-stimulated glucose uptake by epitrochlearis from young rats with normal insulin sensitivity and insulin resistant rats without lowering muscle ceramides or diacylglycerols ( 54 ). Reports indicate CR-induced improvement in mitochondrial function and/or content ( 55–59 ), but other studies have not supported this idea ( 60 , 61 ). Reduced muscle ceramide levels are not required for improved insulin sensitivity in FBN rats with CR ( 62 ). The roles of mitochondria and/or lipids in the CR and exercise effects on insulin sensitivity have not been directly tested in old age.
Rats and mice are often studied to identify mechanisms that regulate muscle insulin sensitivity. The soleus is composed of ~70% slow-twitch fibers in humans, ~80%–90% slow-twitch fibers in rats, and ~30%–50% slow-twitch fibers in mice ( 16 , 63–69 ). AS160 abundance did not differ among the gastrocnemius, vastus lateralis, and soleus of humans ( 64 ). Similarly, in 12 different rat muscles with widely different fiber-type profiles (including the soleus), there were no significant differences for AS160 abundance ( 65 ). In contrast, for mice, AS160 abundance was ~10-fold greater for the soleus versus the extensor digitorum longus ( 63 ). Either human ( 64 ) or rat ( 70 , 71 ) muscle studied immediately after exercise had significant increases in pAS160 Ser588 and pAS160 Thr642 , whereas in mice, there were no significant increases in pAS160 Ser588 and pAS160 Thr642 in the extensor digitorum longus or soleus immediately post-exercise ( 71 ). These observations indicate several advantages for the rat as a model for understanding glucose uptake in human muscle.
What are the effects of CR and/or exercise on insulin sensitivity in humans? From ~3 to 48 hours after acute exercise by humans, whole-body insulin sensitivity is increased as determined by the hyperinsulinemic glucose clamp method ( 72–74 ). In obese humans (53 years) with impaired glucose tolerance or mild type 2 diabetes, CR produced increased insulin-stimulated glucose disposal determined by the glucose clamp ( 75 ). In overweight humans (45–65 years), combined CR and chronic exercise compared with either CR or exercise alone produced a greater improvement in Matsuda insulin sensitivity index using the frequently sampled oral glucose tolerance test ( 76 ). In overweight humans (25–50 years), CR combined with chronic exercise versus CR alone produced a greater increase in insulin sensitivity determined by the insulin-modified frequently sampled intravenous glucose tolerance test ( 77 ). In nonobese older (~60 years) humans, diet-induced weight loss combined with chronic exercise was more effective than either treatment alone for lowering the insulin response to an oral glucose tolerance test ( 78 , 79 ). In earlier studies of chronic exercise in humans, insulin sensitivity was evaluated 12–48 hours after the last exercise session, when at least a portion of effects on glucose disposal were likely attributable to the final exercise bout ( 72 , 80 ). To summarize, the available evidence for humans indicates that CR or acute exercise alone can improve insulin sensitivity, and combined CR and chronic exercise produces greater benefits than either treatment alone.
What is known about the effects of CR and/or exercise on insulin signaling, GLUT4, and GLUT1 in human muscle? In humans (22–28 years), prior acute exercise did not alter insulin’s effects on proximal insulin signaling steps ranging from the insulin receptor to Akt ( 81 , 82 ), but it produced greater insulin-stimulated AS160 phosphorylation ( 83 ). In young rats after acute exercise, there were no effects on proximal insulin signaling from the insulin receptor to Akt, but there was increased AS160 phosphorylation ( 54 , 84 ). GLUT4 protein abundance in human muscle has been reported to increase a few hours after acute exercise, but other studies did not detect this increase ( 46 ). In humans with type 2 diabetes (51 years), CR had no effect on muscle insulin receptor binding or tyrosine kinase activity ( 85 ). We are unaware of published data on the effects of combined CR and exercise on insulin signaling or GLUT4 in human muscle. We do not know of studies that assessed GLUT1 protein in human muscle after CR and/or acute exercise. We are also unaware of human studies reporting CR and/or acute exercise effects on glucose uptake, insulin signaling, GLUT1, or GLUT4 protein in slow-twitch muscle. The current study provides valuable information that is absent in the human literature.
In conclusion, the current study revealed that the effect of CR alone on insulin-stimulated glucose uptake by the soleus from 30-month-old rats is similar to results from earlier research for the epitochlearis from rats of the same age and for the epitrochlearis or the soleus from younger animals. The study also revealed that insulin-stimulated glucose uptake in the soleus was unresponsive to either acute exercise alone or combined CR and acute exercise. This outcome contrasted with the recent report of significant effects of identical interventions on insulin-stimulated glucose uptake by the epitrochlearis from the same 30-month-old rats ( 8 ). Future research should test in old rats (i) if CR-related enhancement in Akt activation is required for the CR effect on insulin-stimulated glucose uptake by the soleus and (ii) if the lack of effects of exercise alone or combined exercise and CR on insulin-stimulated glucose uptake were attributable to insufficient soleus recruitment during the exercise protocol.
Funding
This research was supported by National Institutes of Health Grant (AG-010026) to G.D.C.
Supplementary Material
Acknowledgments
We appreciate the valuable technical assistance of Carlos M. Castorena.
References
- 1. Facchini FS, Hua N, Abbasi F, Reaven GM . Insulin resistance as a predictor of age-related diseases . J Clin Endocrinol Metab . 2001. ; 86 : 3574 – 3578 . [DOI] [PubMed] [Google Scholar]
- 2. DeFronzo RA, Jacot E, Jequier E, Maeder E, Wahren J, Felber JP . The effect of insulin on the disposal of intravenous glucose. Results from indirect calorimetry and hepatic and femoral venous catheterization . Diabetes . 1981. ; 30 : 1000 – 1007 . doi: 10.2337/diab.30.12.1000 [DOI] [PubMed] [Google Scholar]
- 3. Cartee GD, Briggs-Tung C, Kietzke EW . Persistent effects of exercise on skeletal muscle glucose transport across the life-span of rats . J Appl Physiol (1985) . 1993. ; 75 : 972 – 978 . [DOI] [PubMed] [Google Scholar]
- 4. Xiao Y, Sharma N, Arias EB, Castorena CM, Cartee GD . A persistent increase in insulin-stimulated glucose uptake by both fast-twitch and slow-twitch skeletal muscles after a single exercise session by old rats . Age (Dordr) . 2013. ; 35 : 573 – 582 . doi:10.1007/s11357-012-9383-0 [DOI] [PMC free article] [PubMed] [Google Scholar]
- 5. Sequea DA, Sharma N, Arias EB, Cartee GD . Calorie restriction enhances insulin-stimulated glucose uptake and Akt phosphorylation in both fast-twitch and slow-twitch skeletal muscle of 24-month-old rats . J Gerontol A Biol Sci Med Sci . 2012. ; 67 : 1279 – 1285 . doi:10.1093/gerona/gls085 [DOI] [PMC free article] [PubMed] [Google Scholar]
- 6. Dean DJ, Cartee GD . Brief dietary restriction increases skeletal muscle glucose transport in old Fischer 344 rats . J Gerontol A Biol Sci Med Sci . 1996. ; 51 : B208 – B213 . doi:10.1093/gerona/51A.3.B208 [DOI] [PubMed] [Google Scholar]
- 7. Cartee GD, Kietzke EW, Briggs-Tung C . Adaptation of muscle glucose transport with caloric restriction in adult, middle-aged, and old rats . Am J Physiol . 1994. ; 266 ( 5 Pt 2 ): R1443 – R1447 . [DOI] [PubMed] [Google Scholar]
- 8. Sharma N, Wang H, Arias EB, Castorena CM, Cartee GD . Mechanisms for independent and combined effects of calorie restriction and acute exercise on insulin-stimulated glucose uptake by skeletal muscle of old rats . Am J Physiol Endocrinol Metab . 2015. ; 308 : E603 – 612 . doi:10.1152/ajpendo.00618.2014 [DOI] [PMC free article] [PubMed] [Google Scholar]
- 9. Cartee GD, Bohn EE . Growth hormone reduces glucose transport but not GLUT-1 or GLUT-4 in adult and old rats . Am J Physiol . 1995. ; 268 ( 5 Pt 1 ): E902 – E909 . [DOI] [PubMed] [Google Scholar]
- 10. Hansen PA, Gulve EA, Holloszy JO . Suitability of 2-deoxyglucose for in vitro measurement of glucose transport activity in skeletal muscle . J Appl Physiol (1985) . 1994. ; 76 : 979 – 985 . [DOI] [PubMed] [Google Scholar]
- 11. Young DA, Uhl JJ, Cartee GD, Holloszy JO . Activation of glucose transport in muscle by prolonged exposure to insulin. Effects of glucose and insulin concentrations . J Biol Chem . 1986. ; 261 : 16049 – 16053 . [PubMed] [Google Scholar]
- 12. Antharavally BS, Carter B, Bell PA, Krishna Mallia A . A high-affinity reversible protein stain for Western blots . Anal Biochem . 2004. ; 329 : 276 – 280 . doi:10.1016/j.ab.2004.02.049 [DOI] [PubMed] [Google Scholar]
- 13. Ballak SB, Degens H, de Haan A, Jaspers RT . Aging related changes in determinants of muscle force generating capacity: a comparison of muscle aging in men and male rodents . Ageing Res Rev . 2014. ; 14 : 43 – 55 . doi:10.1016/j.arr.2014.01.005 [DOI] [PubMed] [Google Scholar]
- 14. Turturro A, Witt WW, Lewis S, Hass BS, Lipman RD, Hart RW . Growth curves and survival characteristics of the animals used in the Biomarkers of Aging Program . J Gerontol A Biol Sci Med Sci . 1999. ; 54 : B492 – B501 . doi:10.1093/gerona/54.11.B492 [DOI] [PubMed] [Google Scholar]
- 15. Arias E . United States life tables, 2009 . Natl Vital Stat Rep . 2014. ; 62 : 1 – 63 . [PubMed] [Google Scholar]
- 16. Snow LM, McLoon LK, Thompson LV . Adult and developmental myosin heavy chain isoforms in soleus muscle of aging Fischer Brown Norway rat . Anat Rec A Discov Mol Cell Evol Biol . 2005. ; 286 : 866 – 873 . doi:10.1002/ar.a.20218 [DOI] [PubMed] [Google Scholar]
- 17. Cartee GD, Bohn EE, Gibson BT, Farrar RP . Growth hormone supplementation increases skeletal muscle mass of old male Fischer 344/brown Norway rats . J Gerontol A Biol Sci Med Sci . 1996. ; 51 : B214 – B219 . doi:10.1093/gerona/51A.3.B214 [DOI] [PubMed] [Google Scholar]
- 18. McCurdy CE, Cartee GD . Akt2 is essential for the full effect of calorie restriction on insulin-stimulated glucose uptake in skeletal muscle . Diabetes . 2005. ; 54 : 1349 – 1356 . doi:10.2337/diabetes.54.5.1349 [DOI] [PubMed] [Google Scholar]
- 19. Gazdag AC, Dumke CL, Kahn CR, Cartee GD . Calorie restriction increases insulin-stimulated glucose transport in skeletal muscle from IRS-1 knockout mice . Diabetes . 1999. ; 48 : 1930 – 1936 . doi:10.2337/diabetes.48.10.1930 [DOI] [PubMed] [Google Scholar]
- 20. Sharma N, Arias EB, Bhat AD, et al. Mechanisms for increased insulin-stimulated Akt phosphorylation and glucose uptake in fast- and slow-twitch skeletal muscles of calorie-restricted rats . Am J Physiol Endocrinol Metab . 2011. ; 300 : E966 – E978 . doi:10.1152/ajpendo.00659.2010 [DOI] [PMC free article] [PubMed] [Google Scholar]
- 21. Schenk S, McCurdy CE, Philp A, et al. Sirt1 enhances skeletal muscle insulin sensitivity in mice during caloric restriction . J Clin Invest . 2011. ; 121 : 4281 – 4288 . doi:10.1172/JCI58554 [DOI] [PMC free article] [PubMed] [Google Scholar]
- 22. McCurdy CE, Davidson RT, Cartee GD . Brief calorie restriction increases Akt2 phosphorylation in insulin-stimulated rat skeletal muscle . Am J Physiol Endocrinol Metab . 2003. ; 285 : E693 – E700 . doi:10.1152/ajpendo.00224.2003 [DOI] [PMC free article] [PubMed] [Google Scholar]
- 23. McCurdy CE, Davidson RT, Cartee GD . Calorie restriction increases the ratio of phosphatidylinositol 3-kinase catalytic to regulatory subunits in rat skeletal muscle . Am J Physiol Endocrinol Metab . 2005. ; 288 : E996 – E1001 . doi:10.1152/ajpendo.00566.2004 [DOI] [PubMed] [Google Scholar]
- 24. Sharma N, Arias EB, Sequea DA, Cartee GD . Preventing the calorie restriction-induced increase in insulin-stimulated Akt2 phosphorylation eliminates calorie restriction’s effect on glucose uptake in skeletal muscle . Biochim Biophys Acta . 2012. ; 1822 : 1735 – 1740 . doi:10.1016/j.bbadis.2012.07.012 [DOI] [PMC free article] [PubMed] [Google Scholar]
- 25. Davidson RT, Arias EB, Cartee GD . Calorie restriction increases muscle insulin action but not IRS-1-, IRS-2-, or phosphotyrosine-PI 3-kinase . Am J Physiol Endocrinol Metab . 2002. ; 282 : E270 – E276 . doi:10.1152/ajpendo.00232.2001 [DOI] [PubMed] [Google Scholar]
- 26. Bae SS, Cho H, Mu J, Birnbaum MJ . Isoform-specific regulation of insulin-dependent glucose uptake by Akt/protein kinase B . J Biol Chem . 2003. ; 278 : 49530 – 49536 . doi:10.1074/jbc.M306782200 [DOI] [PubMed] [Google Scholar]
- 27. Cartee GD, Funai K . Exercise and insulin: Convergence or divergence at AS160 and TBC1D1? Exerc Sport Sci Rev . 2009. ; 37 : 188 – 195 . doi:10.1097/JES.0b013e3181b7b7c5 [DOI] [PMC free article] [PubMed] [Google Scholar]
- 28. Cartee GD . Roles of TBC1D1 and TBC1D4 in insulin- and exercise-stimulated glucose transport of skeletal muscle . Diabetologia . 2015. ; 58 : 19 – 30 . doi:10.1007/s00125-014-3395-5 [DOI] [PMC free article] [PubMed] [Google Scholar]
- 29. Cartee GD, Wojtaszewski JF . Role of Akt substrate of 160kDa in insulin-stimulated and contraction-stimulated glucose transport . Appl Physiol Nutr Metab . 2007. ; 32 : 557 – 566 . [DOI] [PubMed] [Google Scholar]
- 30. Ishikura S, Bilan PJ, Klip A . Rabs 8A and 14 are targets of the insulin-regulated Rab-GAP AS160 regulating GLUT4 traffic in muscle cells . Biochem Biophys Res Commun . 2007. ; 353 : 1074 – 1079 . doi:10.1016/j.bbrc.2006.12.140 [DOI] [PubMed] [Google Scholar]
- 31. Chen S, Wasserman DH, MacKintosh C, Sakamoto K . Mice with AS160/TBC1D4-Thr649Ala knockin mutation are glucose intolerant with reduced insulin sensitivity and altered GLUT4 trafficking . Cell Metab . 2011. ; 13 : 68 – 79 . doi:10.1016/j.cmet.2010.12.005 [DOI] [PMC free article] [PubMed] [Google Scholar]
- 32. Sano H, Kane S, Sano E, et al. Insulin-stimulated phosphorylation of a Rab GTPase-activating protein regulates GLUT4 translocation . J Biol Chem . 2003. ; 278 : 14599 – 14602 . doi:10.1074/jbc.C300063200 [DOI] [PubMed] [Google Scholar]
- 33. Kramer HF, Witczak CA, Taylor EB, Fujii N, Hirshman MF, Goodyear LJ . AS160 regulates insulin- and contraction-stimulated glucose uptake in mouse skeletal muscle . J Biol Chem . 2006. ; 281 : 31478 – 31485 . doi:10.1074/jbc.M605461200 [DOI] [PubMed] [Google Scholar]
- 34. Sharma N, Sequea DA, Arias EB, Cartee GD . Greater insulin-mediated Akt phosphorylation concomitant with heterogeneous effects on phosphorylation of Akt substrates in soleus of calorie-restricted rats . Am J Physiol Regul Integr Comp Physiol . 2012. ; 303 : R1261 – R1267 . doi:10.1152/ajpregu.00457.2012 [DOI] [PMC free article] [PubMed] [Google Scholar]
- 35. Sakamoto K, Holman GD . Emerging role for AS160/TBC1D4 and TBC1D1 in the regulation of GLUT4 traffic . Am J Physiol Endocrinol Metab . 2008. ; 295 : E29 – E37 . doi:10.1152/ajpendo.90331.2008 [DOI] [PMC free article] [PubMed] [Google Scholar]
- 36. Peck GR, Chavez JA, Roach WG, et al. Insulin-stimulated phosphorylation of the Rab GTPase-activating protein TBC1D1 regulates GLUT4 translocation . J Biol Chem . 2009. ; 284 : 30016 – 30023 . doi:10.1074/jbc.M109.035568 [DOI] [PMC free article] [PubMed] [Google Scholar]
- 37. Vichaiwong K, Purohit S, An D, et al. Contraction regulates site-specific phosphorylation of TBC1D1 in skeletal muscle . Biochem J . 2010. ; 431 : 311 – 320 . doi:10.1042/BJ20101100 [DOI] [PMC free article] [PubMed] [Google Scholar]
- 38. An D, Toyoda T, Taylor EB, et al. TBC1D1 regulates insulin- and contraction-induced glucose transport in mouse skeletal muscle . Diabetes . 2010. ; 59 : 1358 – 1365 . doi:10.2337/db09-1266 [DOI] [PMC free article] [PubMed] [Google Scholar]
- 39. Fujita M, Mitsuhashi H, Isogai S, et al. Filamin C plays an essential role in the maintenance of the structural integrity of cardiac and skeletal muscles, revealed by the medaka mutant zacro . Dev Biol . 2012. ; 361 : 79 – 89 . doi:10.1016/j.ydbio.2011.10.008 [DOI] [PubMed] [Google Scholar]
- 40. Murray JT, Campbell DG, Peggie M, Mora A, Cohen P . Identification of filamin C as a new physiological substrate of PKBalpha using KESTREL . Biochem J . 2004. ; 384 ( Pt 3 ): 489 – 494 . doi:10.1042/BJ20041058 [DOI] [PMC free article] [PubMed] [Google Scholar]
- 41. Zaid H, Antonescu CN, Randhawa VK, Klip A . Insulin action on glucose transporters through molecular switches, tracks and tethers . Biochem J . 2008. ; 413 : 201 – 215 . doi:10.1042/BJ20080723 [DOI] [PubMed] [Google Scholar]
- 42. Castorena CM, Arias EB, Sharma N, Bogan JS, Cartee GD . Fiber type effects on contraction-stimulated glucose uptake and GLUT4 abundance in single fibers from rat skeletal muscle . Am J Physiol Endocrinol Metab . 2015. ; 308 : E223 – E230 . doi:10.1152/ajpendo.00466.2014 [DOI] [PMC free article] [PubMed] [Google Scholar]
- 43. Sequea DA, Sharma N, Arias EB, Cartee GD . Greater filamin C, GSK3α, and GSK3β serine phosphorylation in insulin-stimulated isolated skeletal muscles of calorie restricted 24 month-old rats . Mech Ageing Dev . 2013. ; 134 : 60 – 63 . doi:10.1016/j.mad.2012.12.002 [DOI] [PMC free article] [PubMed] [Google Scholar]
- 44. Ruderman NB, Carling D, Prentki M, Cacicedo JM . AMPK, insulin resistance, and the metabolic syndrome . J Clin Invest . 2013. ; 123 : 2764 – 2772 . doi:10.1172/JCI67227 [DOI] [PMC free article] [PubMed] [Google Scholar]
- 45. Dean DJ, Brozinick JT, Jr, Cushman SW, Cartee GD . Calorie restriction increases cell surface GLUT-4 in insulin-stimulated skeletal muscle . Am J Physiol . 1998. ; 275 ( 6 Pt 1 ): E957 – E964 . [DOI] [PubMed] [Google Scholar]
- 46. Richter EA, Hargreaves M . Exercise, GLUT4, and skeletal muscle glucose uptake . Physiol Rev . 2013. ; 93 : 993 – 1017 . doi:10.1152/physrev.00038.2012 [DOI] [PubMed] [Google Scholar]
- 47. O’Neill HM . AMPK and Exercise: Glucose Uptake and Insulin Sensitivity . Diabetes Metab J . 2013. ; 37 : 1 – 21 . doi:10.4093/dmj.2013.37.1.1 [DOI] [PMC free article] [PubMed] [Google Scholar]
- 48. Cui M, Yu H, Wang J, Gao J, Li J . Chronic caloric restriction and exercise improve metabolic conditions of dietary-induced obese mice in autophagy correlated manner without involving AMPK . J Diabetes Res . 2013. ; 2013 : 852754 . doi:10.1155/2013/852754 [DOI] [PMC free article] [PubMed] [Google Scholar]
- 49. Gonzalez AA, Kumar R, Mulligan JD, Davis AJ, Weindruch R, Saupe KW . Metabolic adaptations to fasting and chronic caloric restriction in heart, muscle, and liver do not include changes in AMPK activity . Am J Physiol Endocrinol Metab . 2004. ; 287 : E1032 – E1037 . doi:10.1152/ajpendo.00172.2004 [DOI] [PubMed] [Google Scholar]
- 50. Al-Regaiey KA, Masternak MM, Bonkowski MS, Panici JA, Kopchick JJ, Bartke A . Effects of caloric restriction and growth hormone resistance on insulin-related intermediates in the skeletal muscle . J Gerontol A Biol Sci Med Sci . 2007. ; 62 : 18 – 26 . [DOI] [PubMed] [Google Scholar]
- 51. Palacios OM, Carmona JJ, Michan S, et al. Diet and exercise signals regulate SIRT3 and activate AMPK and PGC-1alpha in skeletal muscle . Aging (Albany NY) . 2009. ; 1 : 771 – 783 . [DOI] [PMC free article] [PubMed] [Google Scholar]
- 52. Wang P, Zhang RY, Song J, et al. Loss of AMP-activated protein kinase-α2 impairs the insulin-sensitizing effect of calorie restriction in skeletal muscle . Diabetes . 2012. ; 61 : 1051 – 1061 . doi:10.2337/db11-1180 [DOI] [PMC free article] [PubMed] [Google Scholar]
- 53. Samuel VT, Shulman GI . Mechanisms for insulin resistance: common threads and missing links . Cell . 2012. ; 148 : 852 – 871 . doi:10.1016/j.cell.2012.02.017 [DOI] [PMC free article] [PubMed] [Google Scholar]
- 54. Castorena CM, Arias EB, Sharma N, Cartee GD . Postexercise improvement in insulin-stimulated glucose uptake occurs concomitant with greater AS160 phosphorylation in muscle from normal and insulin-resistant rats . Diabetes . 2014. ; 63 : 2297 – 2308 . doi:10.2337/db13-1686 [DOI] [PMC free article] [PubMed] [Google Scholar]
- 55. Civitarese AE, Carling S, Heilbronn LK, et al. ; CALERIE Pennington Team . Calorie restriction increases muscle mitochondrial biogenesis in healthy humans . PLoS Med . 2007. ; 4 : e76 . doi:10.1371/journal.pmed.0040076 [DOI] [PMC free article] [PubMed] [Google Scholar]
- 56. Baker DJ, Betik AC, Krause DJ, Hepple RT . No decline in skeletal muscle oxidative capacity with aging in long-term calorically restricted rats: effects are independent of mitochondrial DNA integrity . J Gerontol A Biol Sci Med Sci . 2006. ; 61 : 675 – 684 . [DOI] [PubMed] [Google Scholar]
- 57. Bevilacqua L, Ramsey JJ, Hagopian K, Weindruch R, Harper ME . Long-term caloric restriction increases UCP3 content but decreases proton leak and reactive oxygen species production in rat skeletal muscle mitochondria . Am J Physiol Endocrinol Metab . 2005. ; 289 : E429 – E438 . doi:10.1152/ajpendo.00435.2004 [DOI] [PubMed] [Google Scholar]
- 58. López-Lluch G, Irusta PM, Navas P, de Cabo R . Mitochondrial biogenesis and healthy aging . Exp Gerontol . 2008. ; 43 : 813 – 819 . doi:10.1016/j.exger.2008.06.014 [DOI] [PMC free article] [PubMed] [Google Scholar]
- 59. Martin-Montalvo A, de Cabo R . Mitochondrial metabolic reprogramming induced by calorie restriction . Antioxid Redox Signal . 2013. ; 19 : 310 – 320 . doi:10.1089/ars.2012.4866 [DOI] [PMC free article] [PubMed] [Google Scholar]
- 60. Hancock CR, Han DH, Higashida K, Kim SH, Holloszy JO . Does calorie restriction induce mitochondrial biogenesis? A reevaluation . FASEB J . 2011. ; 25 : 785 – 791 . doi:10.1096/fj.10-170415 [DOI] [PMC free article] [PubMed] [Google Scholar]
- 61. Finley LW, Lee J, Souza A, et al. Skeletal muscle transcriptional coactivator PGC-1α mediates mitochondrial, but not metabolic, changes during calorie restriction . Proc Natl Acad Sci U S A . 2012. ; 109 : 2931 – 2936 . doi:10.1073/pnas.1115813109 [DOI] [PMC free article] [PubMed] [Google Scholar]
- 62. Obanda DN, Yu Y, Wang ZQ, Cefalu WT . Modulation of sphingolipid metabolism with calorie restriction enhances insulin action in skeletal muscle . J Nutr Biochem . 2015. ; 26 : 687 – 695 . doi:10.1016/j.jnutbio.2015.01.007 [DOI] [PMC free article] [PubMed] [Google Scholar]
- 63. Taylor EB, An D, Kramer HF, et al. Discovery of TBC1D1 as an insulin-, AICAR-, and contraction-stimulated signaling nexus in mouse skeletal muscle . J Biol Chem . 2008. ; 283 : 9787 – 9796 . doi:10.1074/jbc.M708839200 [DOI] [PMC free article] [PubMed] [Google Scholar]
- 64. Jensen TE, Leutert R, Rasmussen ST, et al. EMG-normalised kinase activation during exercise is higher in human gastrocnemius compared to soleus muscle . PLoS One . 2012. ; 7 : e31054 . doi:10.1371/journal.pone.0031054 [DOI] [PMC free article] [PubMed] [Google Scholar]
- 65. Castorena CM, Mackrell JG, Bogan JS, Kanzaki M, Cartee GD . Clustering of GLUT4, TUG, and RUVBL2 protein levels correlate with myosin heavy chain isoform pattern in skeletal muscles, but AS160 and TBC1D1 levels do not . J Appl Physiol (1985) . 2011. ; 111 : 1106 – 1117 . doi:10.1152/japplphysiol.00631.2011 [DOI] [PMC free article] [PubMed] [Google Scholar]
- 66. Trappe S, Costill D, Gallagher P, et al. Exercise in space: human skeletal muscle after 6 months aboard the International Space Station . J Appl Physiol (1985) . 2009. ; 106 : 1159 – 1168 . doi:10.1152/japplphysiol.91578.2008 [DOI] [PubMed] [Google Scholar]
- 67. Stelzer JE, Widrick JJ . Effect of hindlimb suspension on the functional properties of slow and fast soleus fibers from three strains of mice . J Appl Physiol (1985) . 2003. ; 95 : 2425 – 2433 . doi:10.1152/japplphysiol.01091.2002 [DOI] [PubMed] [Google Scholar]
- 68. Graber TG, Kim JH, Grange RW, McLoon LK, Thompson LV . C57BL/6 life span study: age-related declines in muscle power production and contractile velocity . Age (Dordr) . 2015. ; 37 : 9773 . doi:10.1007/s11357-015-9773-1 [DOI] [PMC free article] [PubMed] [Google Scholar]
- 69. Wigston DJ, English AW . Fiber-type proportions in mammalian soleus muscle during postnatal development . J Neurobiol . 1992. ; 23 : 61 – 70 . doi:10.1002/neu.480230107 [DOI] [PubMed] [Google Scholar]
- 70. Schweitzer GG, Arias EB, Cartee GD . Sustained postexercise increases in AS160 Thr642 and Ser588 phosphorylation in skeletal muscle without sustained increases in kinase phosphorylation . J Appl Physiol (1985) . 2012. ; 113 : 1852 – 1861 . doi:10.1152/japplphysiol.00619.2012 [DOI] [PMC free article] [PubMed] [Google Scholar]
- 71. Treebak JT, Pehmøller C, Kristensen JM, et al. Acute exercise and physiological insulin induce distinct phosphorylation signatures on TBC1D1 and TBC1D4 proteins in human skeletal muscle . J Physiol . 2014. ; 592 ( Pt 2 ): 351 – 375 . doi:10.1113/jphysiol.2013.266338 [DOI] [PMC free article] [PubMed] [Google Scholar]
- 72. Perseghin G, Price TB, Petersen KF, et al. Increased glucose transport-phosphorylation and muscle glycogen synthesis after exercise training in insulin-resistant subjects . N Engl J Med . 1996. ; 335 : 1357 – 1362 . doi:10.1056/NEJM199610313351804 [DOI] [PubMed] [Google Scholar]
- 73. Wojtaszewski JF, Jørgensen SB, Frøsig C, MacDonald C, Birk JB, Richter EA . Insulin signalling: effects of prior exercise . Acta Physiol Scand . 2003. ; 178 : 321 – 328 . doi:10.1046/j.1365-201X.2003.01151.x [DOI] [PubMed] [Google Scholar]
- 74. Maarbjerg SJ, Sylow L, Richter EA . Current understanding of increased insulin sensitivity after exercise - emerging candidates . Acta Physiol (Oxf) . 2011. ; 202 : 323 – 335 . doi:10.1111/j.1748-1716.2011.02267.x [DOI] [PubMed] [Google Scholar]
- 75. Arciero PJ, Vukovich MD, Holloszy JO, Racette SB, Kohrt WM . Comparison of short-term diet and exercise on insulin action in individuals with abnormal glucose tolerance . J Appl Physiol (1985) . 1999. ; 86 : 1930 – 1935 . [DOI] [PubMed] [Google Scholar]
- 76. Weiss EP, Albert SG, Reeds DN, et al. Calorie Restriction and Matched Weight Loss From Exercise: Independent and Additive Effects on Glucoregulation and the Incretin System in Overweight Women and Men . Diabetes Care . 2015. ; 38 : 1253 – 1262 . doi:10.2337/dc14-2913 [DOI] [PMC free article] [PubMed] [Google Scholar]
- 77. Larson-Meyer DE, Heilbronn LK, Redman LM, et al. Effect of calorie restriction with or without exercise on insulin sensitivity, beta-cell function, fat cell size, and ectopic lipid in overweight subjects . Diabetes Care . 2006. ; 29 : 1337 – 1344 . doi:10.2337/dc05-2565 [DOI] [PMC free article] [PubMed] [Google Scholar]
- 78. Dengel DR, Galecki AT, Hagberg JM, Pratley RE . The independent and combined effects of weight loss and aerobic exercise on blood pressure and oral glucose tolerance in older men . Am J Hypertens . 1998. ; 11 : 1405 – 1412 . doi:10.1016/S0895-7061(98)00185-X [DOI] [PubMed] [Google Scholar]
- 79. Dengel DR, Pratley RE, Hagberg JM, Rogus EM, Goldberg AP . Distinct effects of aerobic exercise training and weight loss on glucose homeostasis in obese sedentary men . J Appl Physiol (1985) . 1996. ; 81 : 318 – 325 . [DOI] [PubMed] [Google Scholar]
- 80. Heath GW, Gavin JR, 3rd, Hinderliter JM, Hagberg JM, Bloomfield SA, Holloszy JO . Effects of exercise and lack of exercise on glucose tolerance and insulin sensitivity . J Appl Physiol Respir Environ Exerc Physiol . 1983. ; 55 : 512 – 517 . [DOI] [PubMed] [Google Scholar]
- 81. Wojtaszewski JF, Hansen BF, Kiens B, Richter EA . Insulin signaling in human skeletal muscle: time course and effect of exercise . Diabetes . 1997. ; 46 : 1775 – 1781 . doi:10.2337/diab.46.11.1775 [DOI] [PubMed] [Google Scholar]
- 82. Wojtaszewski JF, Hansen BF, Gade et al. Insulin signaling and insulin sensitivity after exercise in human skeletal muscle . Diabetes . 2000. ; 49 : 325 – 331 . doi:10.2337/diabetes.49.3.325 [DOI] [PubMed] [Google Scholar]
- 83. Pehmøller C, Brandt N, Birk JB, et al. Exercise alleviates lipid-induced insulin resistance in human skeletal muscle-signaling interaction at the level of TBC1 domain family member 4 . Diabetes . 2012. ; 61 : 2743 – 2752 . doi:10.2337/db11-1572 [DOI] [PMC free article] [PubMed] [Google Scholar]
- 84. Funai K, Schweitzer GG, Sharma N, Kanzaki M, Cartee GD . Increased AS160 phosphorylation, but not TBC1D1 phosphorylation, with increased postexercise insulin sensitivity in rat skeletal muscle . Am J Physiol Endocrinol Metab . 2009. ; 297 : E242 – E251 . doi:10.1152/ajpendo.00194.2009 [DOI] [PMC free article] [PubMed] [Google Scholar]
- 85. Bak JF, Møller N, Schmitz O, Saaek A, Pedersen O . In vivo insulin action and muscle glycogen synthase activity in type 2 (non-insulin-dependent) diabetes mellitus: effects of diet treatment . Diabetologia . 1992. ; 35 : 777 – 784 . [DOI] [PubMed] [Google Scholar]
Associated Data
This section collects any data citations, data availability statements, or supplementary materials included in this article.