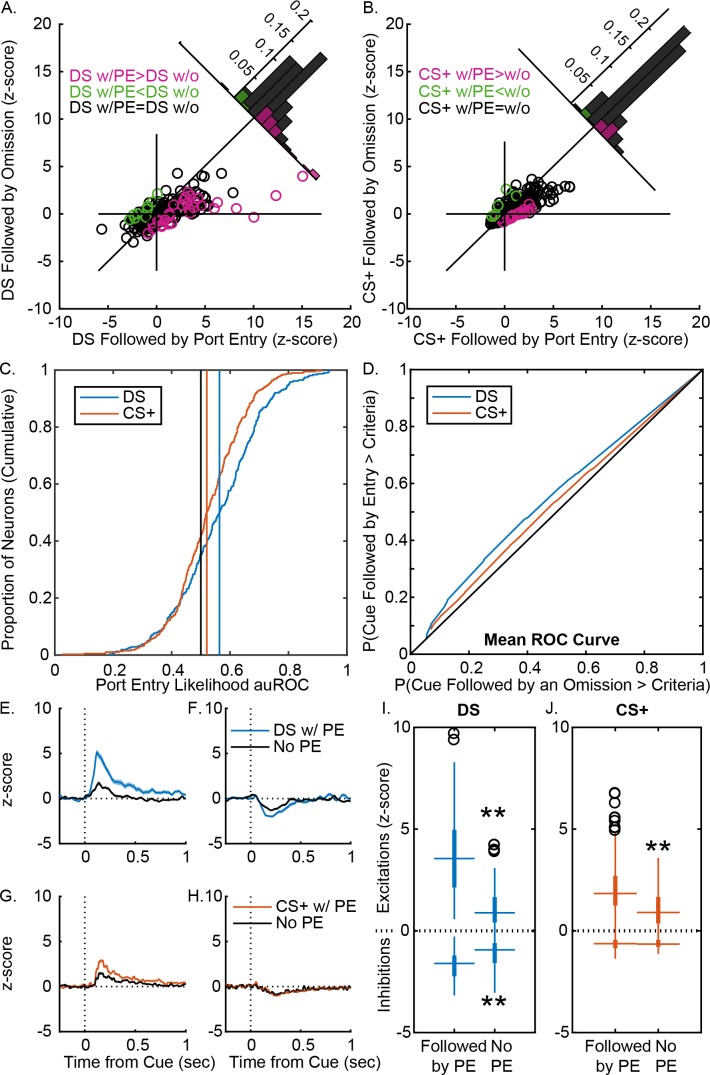
Figure 4. VP responses to cues more robustly predict response likelihood after instrumental training.
(A) Scatterplot of normalized (mean z-score) responses to the DS on trials when it was followed by a port entry versus responses to the DS on trials when it was not followed by a port entry, showing neurons that fire significantly more on trials with a response (pink), on trials with no response (green) or on neither trial type (black). Inset histogram shows the distribution of units based on the difference in their normalized response on the two trial types. (B) Scatterplot of normalized (mean z-score) responses to the CS+ on trials when it was followed by a port entry versus responses to the CS+ on trials when it was not followed by a port entry, showing neurons that fire significantly more on trials with a response (pink), on trials with no response (green) or on neither trial type (black). Inset histogram shows the distribution of units based on the difference in their normalized response on the two trial types. (C) Distribution of auROCs for the assessment of response likelihood prediction following the DS (blue) or the CS+ (orange), with vertical lines showing the mean auROC for each distribution, and the mean from the control distribution (black). (D) Mean ROC curve for the DS (blue) and the CS+ (orange). Average (mean ± SEM) normalized response to the DS on trials with a port entry (blue) and without a port entry (black) in DS excited neurons (E) and DS inhibited neurons (F), shown from 0.5 s prior to 1 s after cue onset. Average (mean ± SEM) normalized response to the CS+ on trials with a port entry (orange) and without a port entry (black) in CS+ excited neurons (G) and CS+ inhibited neurons (H), shown from 0.5 s prior to 1 s after cue onset. (I) Box plots of normalized responses to the DS (blue) on trials with (left) and without (right) a port entry in DS excited (top) and DS inhibited (bottom) neurons. (J) Box plots of normalized responses to the CS+ (orange) on trials with (left) and without (right) a port entry in CS+ excited (top) and CS+ inhibited (bottom) neurons. **=p < 0.01.

