

Abstract
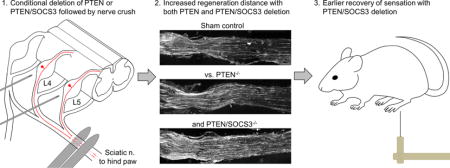
Axons within the peripheral nervous system are capable of regeneration, but full functional recovery is rare. Recent work has shown that conditional deletion of two key signaling inhibitors of the PI3K and Jak/Stat pathways—phosphatase and tensin homolog (PTEN) and suppressor of cytokine signaling-3 (SOCS3), respectively—promotes regeneration of normally non-regenerative central nervous system axons. Moreover, in studies of optic nerve regeneration, co-deletion of both PTEN and SOCS3 has an even greater effect. Here, we test the hypotheses (1) that PTEN deletion enhances axon regeneration following sciatic nerve crush and (2) that PTEN/SOCS3 co-deletion further promotes regeneration. PTENfl/fl and PTEN/SOCS3fl/fl mice received direct injections of AAV-Cre into the fourth and fifth lumbar dorsal root ganglia (DRG) two weeks prior to sciatic nerve crush. Western blot analysis of whole cell lysates from DRG using phospho-specific antibodies revealed that PTEN deletion did not enhance or prolong PI3K signaling following sciatic nerve crush. However, PTEN/SOCS3 co-deletion activated PI3K for at least 7 days post-injury in contrast to controls, where activation peaked at 3 days. Quantification of SCG10-expressing regenerating sensory axons in the sciatic nerve after crush injury revealed longer distance regeneration at 3 days post-injury with both PTEN and PTEN/SOCS3 co-deletion. Additionally, analysis of noxious thermosensation and mechanosensation with PTEN/SOCS3 co-deletion revealed enhanced sensation at 14 and 21 days after crush, respectively, after which all treatment groups reached the same functional plateau. These findings indicate that co-deletion of PTEN and SOCS3 results in modest but measureable enhancement of early regeneration of DRG axons following crush injury.
Graphical abstract
Introduction
Peripheral nerve damage occurs in approximately 5% of all trauma cases (Noble et al., 1998). Given that, there are roughly 40 million trauma cases in the United States each year (National Hospital Ambulatory Medical Care Survey: 2011, n.d.), this equates to approximately 2 million peripheral nerve injuries annually. Unfortunately, while axons in the peripheral nervous system are capable of regeneration, full functional recovery is rarely achieved. Together, the alarming incidence of peripheral nerve damage and the lack of consistent recovery highlight the need for new therapeutic interventions aimed at improving axon regeneration in the periphery.
The environment of the damaged peripheral nerve is conducive to axonal regeneration. Schwann cells de-differentiate and clear debris along with macrophages (reviewed in Navarro et al., 2007). These de-differentiated Schwann cells provide neurotrophic and physical support for regenerating axons. Additionally, neurons of the peripheral nervous system have an intrinsic capacity for regeneration. Even so, regeneration in the periphery may be limited by a number of factors including severity of the injury, nerve gaps that require bridging, distance to the peripheral target, age, and a lack of specific innervation (de Ruiter et al., 2008; Fu and Gordon, 1995).
Recent studies have been aimed at improving intrinsic regenerative capacity by deleting the signaling inhibitors phosphatase and tensin homolog (PTEN) and suppressor of cytokine signaling 3 (SOCS3). Conditional genetic deletion of PTEN promotes regeneration of optic nerve axons (Park et al., 2008). Similarly, conditional deletion or shRNA-mediated suppression of PTEN promotes regeneration of corticospinal tract axons (Danilov and Steward, 2015; Lewandowski and Steward, 2014; Liu et al., 2010). These findings stand out due to the complete lack of axonal regeneration of these CNS axons under normal conditions. Additionally, co-deletion of PTEN and SOCS3 exponentially increases axon regeneration in the optic nerve (Sun et al., 2011). While there is evidence to suggest that manipulation of the PI3K pathway may enhance regeneration in the periphery (Abe et al., 2010; Christie et al., 2010), conditional deletion of PTEN in dorsal root ganglia sensory neurons has not been investigated. Furthermore, to the best of our knowledge, there have been no studies involving co-suppression of PTEN and SOCS3 on axon regeneration in peripheral nerves. Thus, the goal here is to assess whether PTEN deletion alone or PTEN/SOCS3 co-deletion will enhance regeneration of peripheral sensory axons that already have a capacity for regeneration.
Materials and Methods
Animals
A total of 244 adult male mice (3- to 5-months-old at first surgery) were used in this study. A complete breakdown of the number of animals from each genetic background used in the experiments performed here is presented in Table 1. Animals were obtained from two local colonies of transgenic mouse lines bred in pairs as homozygous mutants. PTEN-floxed mice (PTENfl/fl; n = 123) on a 129S background contain flox sequences around exon 5 of the PTEN gene. PTEN/SOCS3-floxed mice (PTEN/SOCS3fl/fl; n = 118) on a B6/129S background were generated from breeding pairs donated by Dr. Zhigang He, Children’s Hospital, Boston. Cre-reporter ROSAtdT mice (n = 3) contain a floxed stop cassette upstream of the coding sequence for tdT.
Table 1.
Animal Use
| Analysis (n) | Genotype (n) | DRG injection (n) | Injury (n) |
|---|---|---|---|
| Immunofluorescence within the DRG (3) | PTENfl/fl (3) | None | None (3) |
| Western blot of whole DRG lysates for signaling after nerve crush (72) | PTENfl/fl (30) | None | None (5) SNC (25) |
| PTEN/SOCS3fl/fl (42) | None | None (7) SNC (35) |
|
| Western blot of whole DRG lysates for signaling after deletion and subsequent nerve crush (96) | PTENfl/fl (43) | None | None (4) |
| AAV-GFP | SNC (3) | ||
| AAV-Cre (36) | None (12) SNC (24) |
||
| PTEN/SOCS3fl/fl (53) | None | None (8) | |
| AAV-GFP | SNC (9) | ||
| AAV-Cre (36) | None (12) SNC (24) |
||
| Immunofluorescence within the sciatic nerve (12) | PTENfl/fl (9) | Sham | SNC (3) |
| AAV-GFP | SNC (3) | ||
| AAV-Cre | SNC (3) | ||
| PTEN/SOCS3™ (3) | AAV-Cre | SNC (3) | |
| Behavioral recovery (43) | PTENfl/fl (23) | Sham | SNC (5) |
| AAV-GFP | SNC (7) | ||
| AAV-Cre | SNC (11) | ||
| Sham | SNC (6) | ||
| PTEN/SOCS3fl/fl (20) | AAV-GFP | SNC (4) | |
| AAV-Cre | SNC (10) | ||
| Total N = 226 | |||
SNC = sciatic nerve crush
Animals were group housed with littermates in a temperature controlled vivarium on a 12 hour light-dark cycle. All procedures were approved by the University of California Irvine Institutional Animal Care and Use Committee and performed in accordance with the National Institutes of Health Guide for the Care and Use of Laboratory Animals (8th edition, 2011).
Surgical procedures
Sciatic nerve crushes were performed under ketamine/xylazine anesthesia (10 and 1 mg/kg, respectively) administered intraperitoneally (i.p.). A dorsal incision was made on the left side from hip to knee so the biceps femoris and gluteus superficialis could be split by blunt dissection, exposing the left sciatic nerve. The sciatic nerve was separated from the surrounding muscle up to the medial junction of the biceps femoris and gluteus superficialis, where the sciatic nerve turns away from midline. The nerve was crushed twice at this location for 15 seconds each at 90 degree angles relative to one another to reduce the possibility of sparing. Following sciatic nerve crush, the overlying muscles were closed with a single cat gut suture and the overlying skin was closed with staples.
Mice used to determine the effect of PTEN or PTEN/SOCS3 co-deletion received direct injections of AAV vectors into the fourth and fifth lumbar dorsal root ganglia (L4/5 DRG) two weeks prior to sciatic nerve crush. Following a midline incision over the L2 to S2 vertebrae, the left L4/5 DRG were exposed by hemi-laminectomy. A volume of 1 μL of AAV-Cre (1 × 10⁹ infectious units / μL) was injected into each of the DRG using a Hamilton syringe attached to a 35 ga. beveled needle. Vector controls received the same volume of AAV-GFP and sham controls underwent hemi-laminectomy alone. Fast Green dye was added to both AAV-Cre and AAV-GFP solutions (final concentration of 0.1%) to allow confirmation of successful intraganglionic injection. Following injections, the surrounding erector spinae muscles were closed with two cat gut sutures and the overlying skin was closed with staples.
Behavioral testing
Four groups of mice were used for behavioral experiments (n = 10-11 per group, Table 1). Sham surgery and AAV-GFP vector control groups included both PTENfl/fl and PTEN/SOCS3fl/fl mice. Mice were handled daily for one week and trained for two weeks prior to data collection. Baseline measurements were recorded two weeks prior to DRG injections or sham surgeries. An additional baseline was recorded four hours prior to sciatic nerve crush to determine if DRG injections affected behavior. Following sciatic nerve crush, measurements were recorded weekly for eight weeks by a blinded observer.
Noxious thermosensation was measured using a Hargreave’s apparatus (#390G, IITC). Mice were placed into individual plexiglass compartments with opaque dividers over a glass base plate. The base plate was heated to 33 °C to prevent the base from acting as a heat sink. Mice were acclimated for 20 minutes prior to testing. The active intensity of the light source was set at 53 % to achieve a baseline withdrawal latency near 5 sec. The maximum stimulation time was set at 15 sec (3× baseline) to avoid damaging the hind paw. The light source was focused on the lateral surface of the hind paw behind the hypothenar foot pad to avoid stimulation of the medial regions of the hind paw innervated by the saphenous nerve. Reported measurements are the average of three trials separated by at least 5 min.
Mechanosensation was measured using graded von Frey filaments. Mice were tested in the same plexiglass compartments used for testing with the Hargreave’s apparatus on top of an anodized metal mesh platform with 1/4” waffle holes that allow access to the plantar surface of the paw (#410, IITC Life Science, Woodland Hills, CA). Mice were allowed to acclimate for 20 minutes prior to testing. Filaments in the range of 3.22, 3.61, 3.84, 4.08, 4.31, and 4.56 log units (mean distance = 0.238) were applied to the center of the left hind paw between the foot pads beginning with the 3.84 filament. Fifty per cent paw withdrawal threshold was calculated using the up-down method (Chaplan et al., 1994). Mice that did not respond to any filaments following sciatic nerve crush were assigned a paw withdrawal threshold of 4.5 g.
Motor function was assessed using an automated catwalk system equipped with CatWalk XT 8.1 software (Noldus Information Technology, Wageningen, Netherlands). Mice were placed in a dark box with Froot Loops® cereal at one end of the catwalk for 3 min prior to testing. Mice were then removed from the box and placed at the opposite end of the catwalk. Paw print length and width were averaged over three successful runs separated by 2 min to maintain the positive reinforcement of the dark box. These measurements were used to calculate sciatic function index using a modified equation from Inserra and colleagues (Inserra et al., 1998).
Western blots
The time course of PI3K and Jak/Stat activation following sciatic nerve crush was assessed by Western blot of tissue from both PTENfl/fl and PTEN/SOCS3fl/fl mice. At 0 (uninjured control), 1, 3, 7, 15, and 30 days following sciatic nerve crush, mice (n = 12 per time point for 72 total; 30 PTENfl/fl and 42 PTEN/SOCS3fl/fl) were euthanized by i.p. injection of 0.1 mL Fatal-Plus (sodium pentobarbital). Mice were transcardially perfused with ice cold 0.1 M PBS with 0.1 % protease (04693124001, Roche, Basel, Switzerland) and phosphatase inhibitors (04906837001, Roche). Left L4/5 DRG were quickly extracted, placed in HCl lysis buffer with 1 % phosphatase and protease inhibitors on dry ice, and stored at −80 °C until homogenization. At the time of homogenization, the left L4/5 DRG of four animals within the same time point were pooled to have sufficient material to perform Western blots, resulting in three samples per time point. These DRG pools were randomly generated from age-matched mice within the same time point irrespective of genetic background. A total of 5 μg of protein per pool was run in Mini-PROTEAN TGX gels (456-1095, Bio-Rad, Hercules, CA). Gels were run as sets that contained one sample from each treatment group and transferred onto individual PVDF membranes (926-31098, Li-Cor, Lincoln, NE). Membranes (926-31098, Li-Cor, Lincoln, NE) were blocked (927-40000, Li-Cor) and stained with combinations of primary antibodies listed in Table 2. Combinations of the secondary antibodies IRDye 800CW goat anti-rabbit (1:15,000; 926-32211, Li-Cor) and IRDye 680RD goat anti-mouse (1:15,000; 926-68070, Li-Cor) were applied for visualization. Western blots were analyzed for fluorescence levels using a Li-Cor Odyssey FC Imaging System equipped with Image Studio version 3.1.
Table 2.
Primary antibodies
| Antigen | Immunogen | Manufacturer (Cat. No.), RRID, host sp., clonality | IF dilution | WB dilution |
|---|---|---|---|---|
| PTEN | Synthetic peptide DSDPENEPFDEDQ HTQITKV corresponding to residues 384-403 of human PTEN. | Cell Signaling Technology (CST; 9188S) RRID: AB_2253290, rb mAb | 1:200 | 1:2000 |
| p-S6 | Synthetic phosphopeptide RRLssLRA STSKSES (s = p-Ser) corresponding to residues 232-246 of human rpS6 | CST (4858S), RRID: AB_916156, rb mAb | 1:200 | 1:2000 |
| Stat3 | Synthetic peptide RPESQEHPEAD corresponding to residues 688-698 of human Stat3 | CST (9139S), RRID: AB_10694804, ms mAb | 1:2000 | |
| p-Stat3 | Synthetic phosphopeptide ADPGSAAP yLKTKFI (y = p-Tyr) corresponding to residues 697-711 of mouse Stat3 | CST (9145S), RRID: AB_561305, rb mAb | 1:2000 | |
| SOCS3 | Synthetic peptide conjugated to KLH derived from residues 200 to the C- terminus of human SOCS3 | Abcam (ab16030), RRID: AB_443287, rb pAb | 1:2000 | |
| β-actin | Slightly modified β-cytoplasmic actin N- terminal peptide, Ac-DDDIAALVIDN GSGK, conjugated to KLH | Sigma-Aldrich (A5441), RRID: AB_476744, ms mAb | 1:10000 | |
| SCG10 (STMN2) | Synthetic peptide corresponding to residues 150-190 of mouse STMN2 conjugated to an immunogenic carrier | Abcam (ab104560), RRID: AB_10710769, rb pAb | 1:500 |
A separate group of mice was used to determine the effect of PTEN deletion alone or PTEN/SOCS3 co-deletion on PI3K and Jak/Stat activation following nerve crush. Mice received AAV-Cre (n = 36 per strain) or AAV-GFP (n = 12; 3 PTENfl/fl and 9 PTEN/SOCS3fl/fl) injections as described under Surgical Procedures. Additional mice (n = 12; 4 PTENfl/fl and 8 PTEN/SOCS3fl/fl) served as naïve (uninjected/uninjured) controls. Two weeks after injection, mice underwent sciatic nerve crush (n = 60) or were processed for Western blot (0 day, n = 24, 12 per strain) as described above. Mice that underwent sciatic nerve crush were euthanized 3 or 7 days later and processed for Western blot as above. DRG pools from naïve and AAV-GFP vector control groups were randomly generated from age-matched mice irrespective of genetic background. AAV-Cre injected DRG pools were randomly generated from age-matched mice with respect to their genetic background.
Immunofluorescence
Mice used for immunofluorescent studies (n = 15) were euthanized by i.p. injection of 0.1 mL Fatal-Plus® and transcardially perfused with 4 % paraformaldehyde. L4 DRG were extracted at 0 (uninjured control), 1, 3, 7, 15, and 30 days following sciatic nerve crush (n = 3 per time point). Sciatic nerves were extracted 3 days after sciatic nerve crush (n = 12; 9 PTENfl/fl and 3 PTEN/SOCS3fl/fl). All tissue was post-fixed for an additional 6 hours before being transferred to 27 % sucrose. DRG or sciatic nerves were longitudinally cryo-sectioned at 20 μm and direct-mounted on slides. Slide-mounted sections were incubated in primary antibodies listed in Table 2 followed by donkey anti-rabbit 488 (1:400; A-21206, Life Technologies, Carlsbad, CA) or goat anti-rabbit 594 (1:400; A-11037, Life Technologies) and then coverslipped in VectaShield mounting medium (H-1000, Vector Laboratories, Burlingame, CA).
Antibody characterization
PTEN
The antibody against PTEN recognized a single band at 55 kDa from whole cell lysates of DRG analyzed by Western blot in our study (Figures 2 & 3; predicted molecular weight of 47 kDa). The manufacturer reports a single band at 54 kDa in HeLa, NIH/3T3, C6, and COS-7 cells, but not the PTEN-mutated PC3 and LNCap prostate cancer cell lines. No band appears in whole cell lysates from the human breast cancer cell line MDA-MB 415 harboring a PTEN mutation (Forster et al., 2011).
Figure 2. Activation of PI3K signaling following sciatic nerve crush.
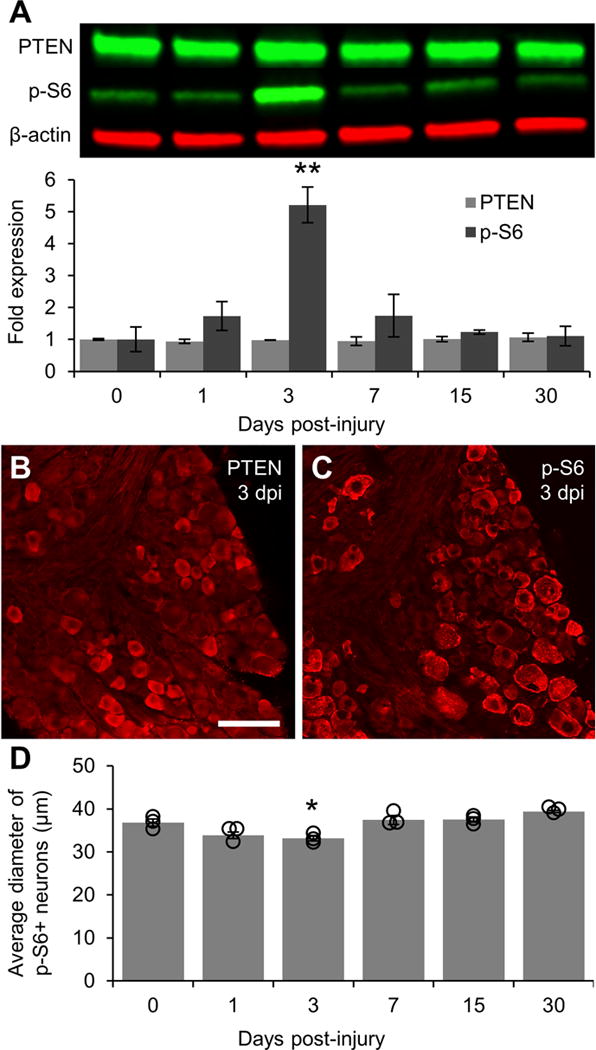
A: Representative Western blot images of PTEN and p-S6 staining from L4/5 DRG lysates with graphical representation of data normalized to 0 day uninjured controls (n = 3 DRG pools per time point). β-actin was used as a loading control. PI3K signaling is greatly elevated at 3 days post-injury as shown by a five-fold increase in the level of p-S6 as compared to controls. p-S6 levels in DRG lysates returned to baseline within 7 days of injury. B: Representative image of PTEN expression in DRG 3 days post-injury showing that injury does not alter the localization of PTEN in small diameter neurons. C: Representative image of p-S6 in DRG 3 days post-injury showing sustained phosphorylation of S6 in large diameter neurons and increased S6 phosphorylation in smaller diameter neurons. D: Graphical representation of the average diameter of neurons positively stained for p-S6 (n = 3 per time point). Individual data points are indicated by hollow circles. ** p < 0.01 vs 0 day uninjured controls in A. * p < 0.05 vs 0 day uninjured controls and 7, 15, and 30 days post-injury in B. Scale bar = 100 μm.
Figure 3. Activation of Jak/Stat signaling following sciatic nerve crush.
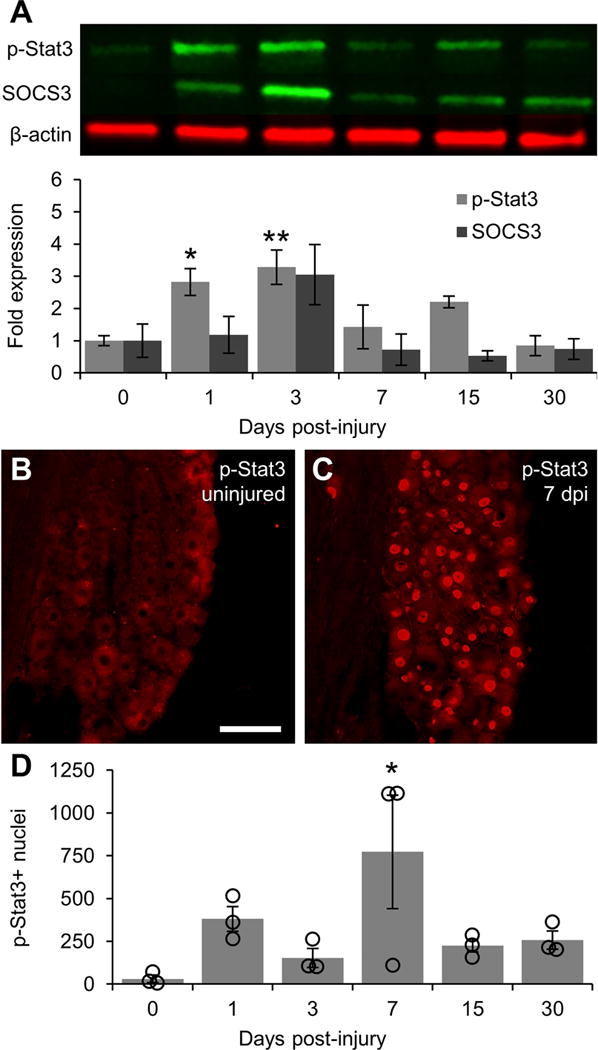
A: Representative Western blot images of p-Stat3 and SOCS3 from L4/5 DRG lysates with graphical representation of data normalized to 0 day uninjured controls (n = 3 DRG pools per time point). β-actin was used as a loading control. Jak/Stat signaling is activated at early time points after injury as shown by elevated p-Stat3 levels at 1 and 3 days post-injury. As with PI3K signaling, Jak/Stat signaling returns to baseline within 7 days of injury following an upward trend in SOCS3 expression that does not reach significance. B: Representative image of p-Stat3 expression in 0 day uninjured control DRG showing a lack of p-Stat3-positive nuclei. C: Representative image of p-Stat3 expression 7 days post-injury showing a large number of p-Stat3-positive nuclei in both small and large diameter neurons. D: Graphical representation of the number of p-Stat3-positive nuclei quantified in every 6th section throughout the whole DRG (n = 3 per time point). Individual data points are indicated by hollow circles. * p < 0.05, ** p < 0.01 vs 0 day uninjured controls. Scale bar = 100 μm.
p-S6
The antibody against p-S6 recognized a single band at 32 kDa in Western blots of DRG lysates (Figures 2 & 3; predicted molecular weight of 29 kDa). Staining is abolished in endometrial cancer cell lines in the presence of the mTOR inhibitor temsirolimus (Yang et al., 2011). Further documentation that immunostaining reflects phosphorylation comes from studies demonstrating robust increases in immunostaining in situations known to induce S6 phosphorylation, for example in dentate granule cells following induction of perforant path LTP (Salgado et al., 2016).
p-Stat3
The antibody against p-Stat3 recognizes two bands at 86 (Stat3α) and 79 kDa (Stat3β) in Western blots of HeLa cells only after treatment with IFNγ (manufacturer information). In Western blots from our DRG lysates, the antibody recognized the 86 kDa band as well as an additional band near 40 kDa (Figures 2 & 3); the intensity of this band fluctuated with the band at 86 kDa. In DRG sections, the expected nuclear staining pattern was observed only after injury.
SOCS3
The antibody against SOCS3 recognizes a single band at 27 kDA in Western blots of IFNγ-treated HeLa cells (manufacturer information). In Western blots from our DRG lysates, the antibody against SOCS3 recognized this same band as well as an additional non-specific band near 80 kDa (Figure 2).
β-actin
The antibody against β-actin recognized a single band at 42 kDa in our study. This antibody does not recognize the α form of actin as shown by negative staining from Western blots of cardiac tissue (Kawaja et al., 2011).
Superior cervical ganglion-10 (SCG10)
SCG10 (also known as stathmin-2) is a known regulator of microtubule stability and was used as a marker of regenerating axons in the sciatic nerve. In our study, no SCG10 staining was observed in uninjured sciatic nerves. Following injury, the expected pattern of staining—axons extending short distances beyond the injury site and ending in growth cones—was observed, consistent with previous reports for this marker (Shin et al., 2014).
Imaging and analysis
Stained sections were imaged using an Olympus AX80 equipped with cellSens Standard imaging software. Both the DRG and sciatic nerves were imaged at 20× magnification. Stitched images of individual sections were generated using cellSens Standard before image analysis, ensuring that all objects of interest in each section were analyzed only once.
The diameters of neuronal profiles expressing proteins of interest were quantified using ImageJ software (NIH). Analysis for each staining was performed in every sixth section throughout the L4 DRG. The diameter was recorded along the long-axis of every neuronal profile that displayed a clear nuclear shadow. Data represent the mean of the total number of positive cells quantified for each animal.
To quantify regeneration of SCG10-expressing axons in stitched images of the sciatic nerve, images were imported into ImageJ; a line was placed along the proximal boundary of the crush lesion perpendicular to the nerve axis and at every 250 μm relative to this reference. The number of labeled axons that crossed these lines was quantified by a blind observer in every sixth section.
Statistics
Western blot and cell count data were analyzed by one-way ANOVA with Dunnett’s multiple comparison test for significance. Regeneration data were analyzed by two-way repeated measures ANOVA with Fisher’s LSD. Behavioral data were analyzed by two-way repeated measures ANOVA with Bonferroni correction for multiple comparisons. Differences were considered significant at p < 0.05. Data are presented as mean ± SEM.
Results
PTEN and p-S6 in uninjured dorsal root ganglia
PI3K is canonically activated by ligand binding to receptor tyrosine kinase. Active PI3K catalyzes the conversion of phosphatidylinositol bisphosphate (PIP2) to phosphatidylinositol triphosphate (PIP3), which leads to sequential activation of Akt and mammalian target of rapamycin (mTOR) to ultimately phosphorylate ribosomal protein S6 (p-S6). PTEN is a negative regulator of this pathway as it mediates the reverse reaction of PI3K, converting PIP3 to PIP2. To determine the distribution of PTEN and p-S6 in uninjured dorsal root ganglia (DRG), the L4 DRG of uninjured mice were processed for PTEN and p-S6 immunofluorescence. PTEN was expressed in small neurons with a majority of profile diameters falling between 20 and 30 μm (Fig. 1A & C). Conversely, immunostaining for p-S6 was primarily in large neurons with profile diameters greater than 30 μm (Fig 1B & C).
Figure 1. Immunohistochemical analysis of PTEN and p-S6 in uninjured DRG.
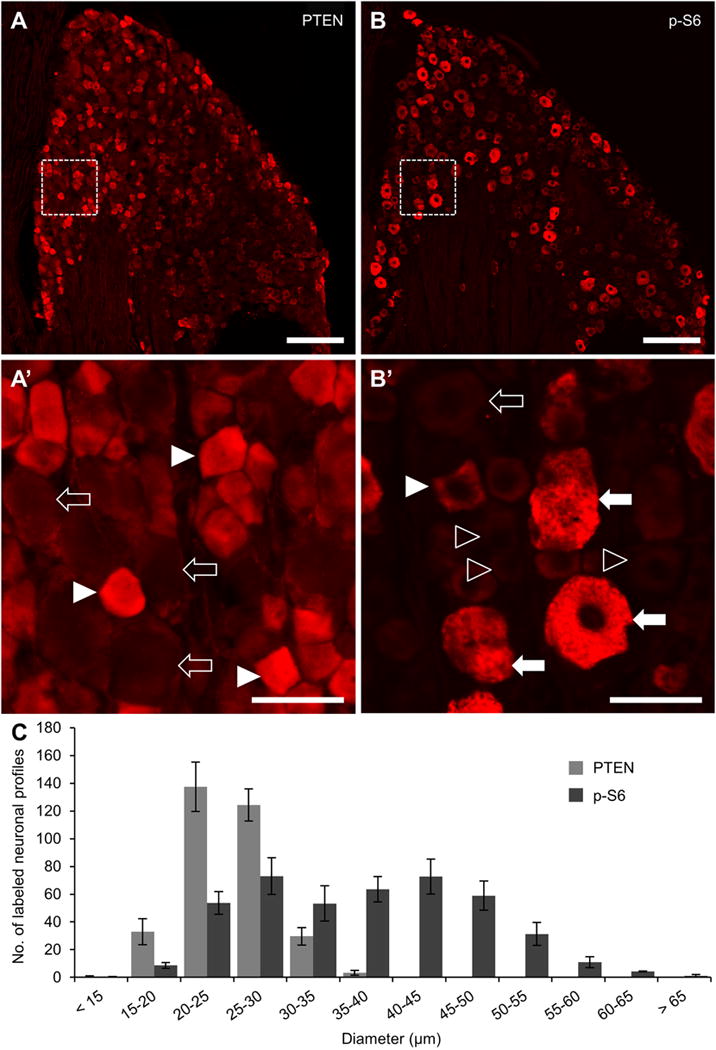
A-B: Representative 20x stitched images of phosphatase and tensin homolog (PTEN, A) and phosphorylated ribosomal protein S6 (p-S6, B) expression in the L4 dorsal root ganglia. Area in dashed box within A is shown in A’ to further demonstrate the localization of PTEN in small diameter neuronal profiles (arrowheads) and a lack of expression in large neuronal shadows (hollow arrows). Area in dashed box within B is shown in B’ to demonstrate localization of p-S6 primarily in large-diameter neuronal profiles (arrows) and not in small diameter profiles (hollow arrowheads). Examples of the less frequent small diameter profiles containing p-S6 (arrowhead) and large diameter profiles with low p-S6 expression (hollow arrow) are also shown. C: Quantification of PTEN and p-S6 neuronal profiles in every 6th section throughout the whole DRG (n = 3). Only profiles containing a nuclear shadow were quantified and ordered in 5 μm bins according to the diameter of the cell body along its long axis. The distribution patterns of these two proteins indicate that they are expressed in two separate neuronal sub-populations, PTEN in small diameter C-type neurons and p-S6 in large diameter A-type neurons. The mutual exclusion of these two proteins is consistent with the role of PTEN as an inhibitor of PI3K signaling upstream of mTOR activation and subsequent S6 phosphorylation. Scale bar = 200 μm in A and B. Scale bar = 50 μm in A’ and B’.
Activation of PI3K and Jak/Stat signaling in the dorsal root ganglia following sciatic nerve crush
To determine the time course of activation for PI3K signaling after injury, the L4/5 DRG were processed for Western blot analysis of PTEN and p-S6 at 1, 3, 7, 15, and 30 days after sciatic nerve crush. There were no significant changes in PTEN protein levels at any of the time points investigated (Fig 2A). Assessment of PTEN by immunofluorescence also revealed no changes after crush (Fig 2B). Conversely, Western blot analysis revealed a sharp peak in p-S6 levels 3 days after crush (5.21 ± 0.56 fold increase vs 0 day uninjured controls, p < 0.01; Fig 2A; data normalized to the average value from uninjured ganglia run on the same set of Western blots) with a return to baseline within 7 days of crush (1.74 ± 0.67 fold difference vs 0 day, NS). Assessment of p-S6 by immunofluorescence revealed an increased number of small diameter neurons containing p-S6 3 days after crush, resulting in a decrease in the average diameter of p-S6-expressing neurons at this time point (33.18 ± 0.63 μm vs 36.84 ± 0.83 μm in 0 day controls, p < 0.05; Fig 2C–D).
Because PTEN/SOCS3 co-deletion has been shown to have additive effects on regeneration (Sun et al., 2011), we also assessed levels of p-Stat3 and SOCS3 following injury by Western blot. Levels of p-Stat3 in L4/5 DRG were significantly elevated within 1 day of sciatic nerve crush (2.83 ± 0.42 fold increase vs 0 day, p < 0.05; Fig 3A). p-Stat3 levels remained elevated 3 days after crush (3.28 ± 0.54 fold increase vs 0 day, p < 0.01). As with p-S6, p-Stat3 levels returned to baseline within 7 days (1.43 ± 0.68 fold difference vs 0 day, NS). This decline in p-Stat3 was preceded by a trend towards increased SOCS3 expression 3 days after crush that did not reach significance (3.05 ± 0.94 fold increase vs 0 day, p = 0.1640).
Assessment of p-Stat3 by immunofluorescence revealed very few p-Stat3-positive nuclei in uninjured DRG (30.7 ± 21.9, Fig 3B, D). The number of p-Stat3-positive nuclei in the DRG increased by greater than 10-fold by 1 day post-injury (380.1 ± 73.1, Fig 3D) Although Western blot data indicated that p-Stat3 levels were greatest at 3 days post-injury, the number of positive nuclei was highest at 7 days after injury (772.3 ± 330.7 vs 30.7 ± 21.9 in 0 day controls, p < 0.05; Fig 3C–D), although the DRG from one of the three mice had relatively few positive nuclei.
Effect of PTEN and PTEN/SOCS3 co-deletion on activation of PI3K and Jak/Stat pathways
In the central nervous system, the pro-regenerative effects of PTEN and SOCS3 deletion are dependent upon activation of mTOR and Stat3, respectively (Park et al., 2008; Sun et al., 2011). However, unlike axons of the CNS, peripheral axons originating in the DRG are capable of regeneration without experimental manipulation. Therefore, it is possible that mTOR and Stat3 are maximally activated in the DRG following nerve injury; in which case, deletion would have no further impact. Prior to determining the effect of PTEN and PTEN/SOCS3 co-deletion on PI3K and Jak/Stat signaling in the DRG after crush, we began by examining the effectiveness of direct injections of AAV-Cre into the DRG of adult mice (see Materials & Methods for full description). Using Cre-reporter mice containing a floxed stop cassette upstream of the coding sequence for tdTomato, we determined that approximately 35% of neurons in the injected DRG were successfully transfected around an injection center (Fig 4A). In PTENfl/fl and PTEN/SOCS3fl/fl mice, injection centers were observed by a lack of PTEN expression in neurons (Fig 4B), demonstrating the feasibility of the method. It should be noted that SOCS3 is not expressed in DRG neurons at detectable levels prior to injury and is only transiently upregulated after injury, so showing SOCS3 deletion in the same manner as PTEN deletion is not feasible. However, Cre expression in amounts sufficient to delete PTEN will also delete SOCS3 in PTEN/SOCS3fl/fl mice.
Figure 4. Effect of PTEN and PTEN/SOCS3 co-deletion on activation of PI3K and Jak/Stat signaling.
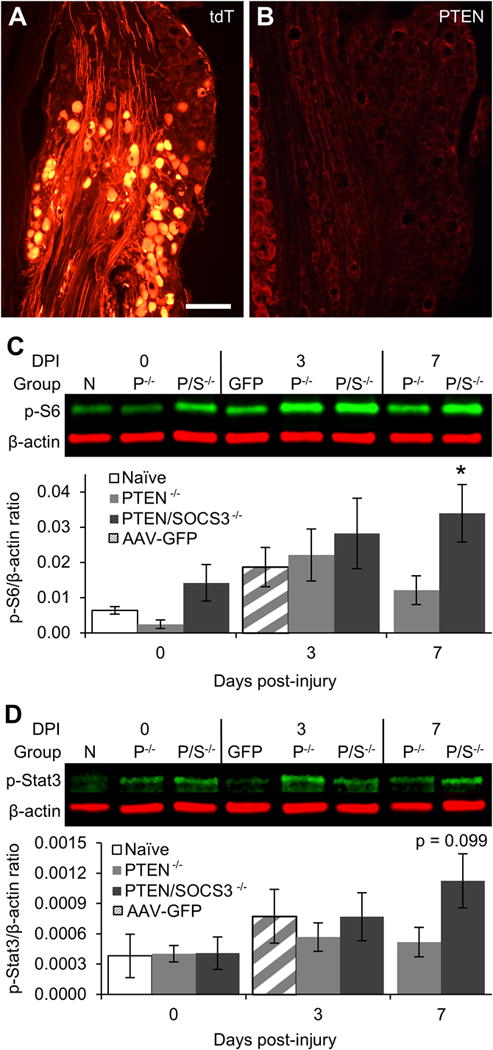
A: Representative image of tdT expression in DRG two weeks after injection of AAV-Cre directly into the L4 DRG of a Cre-reporter mouse. The image shows tdT-positive neurons within the injection center (bottom 2/3 of image) and tdT-negative neurons that were not successfully transfected (top 1/3). Overall, injections resulted in the successful transfection of approximately 35% of neurons within injected DRG. B: Representative image of PTEN expression following direct injection of AAV-Cre into the L4 DRG of a PTENfl/fl mouse showing a lack of PTEN immunoreactivity in neurons within the injection center with sustained PTEN expression in small diameter neurons outside the injection center (far left of image). C: Representative Western blot images of p-S6 staining from L4/5 DRG lysates at 0, 3, or 7 days post-injury (DPI) with graphical representation of data shown as ratio of p-S6 over β-actin loading control. Naïve DRG (N) were both uninjected and uninjured. For PTEN−/− (P−/−) and PTEN/SOCS3−/− (P/S−/−) groups, mice received direct injections of AAV-Cre into the L4/5 DRG two weeks prior to sacrifice (0 day) or sciatic nerve crush (3 and 7 days) to allow for run-down of protein present at the time of injury. Vector control mice (GFP) received AAV-GFP injections two weeks prior to sciatic nerve crush and sacrifice 3 DPI. D: Representative Western blot images of p-Stat3 from L4/5 DRG lysates presented as in C. Intraganglionic injections of both AAV-Cre and AAV-GFP appear to dampen the level of p-S6 and p-Stat3 at 3 DPI, the previously observed peak activation time point. However, PTEN/SOCS3 co-deletion leads to activate signaling in the PI3K pathway as shown by significantly elevated levels of p-S6 to at least 7 days post-injury (C). PTEN/SOCS3 co-deletion also displayed a trend towards increased p-Stat3 levels at this time point (D). * p < 0.05 vs 0 day naïve controls. Scale bar = 200 μm.
To determine whether PTEN or PTEN/SOCS3 co-deletion in the DRG further activates mTOR and Stat3 following nerve injury, the left L4/5 DRG of adult PTENfl/fl and PTEN/SOCS3fl/fl mice were injected with AAV-Cre. Two weeks later, one group of mice was sacrificed and the left L4/5 DRG were prepared for Western blot analysis of p-S6 and p-Stat3 (0 day). Another group underwent left sciatic nerve crush and were allowed to recover before the L4/5 DRG were prepared for Western blot analysis at 3 or 7 days after crush, corresponding to peak activation and return to baseline for both pathways as determined by the previous experiment (Fig 2–3). An additional group of injection controls received AAV-GFP in the left L4/5 DRG, which were extracted 3 days after crush.
Two weeks after AAV-Cre injection, p-S6 levels in DRG were lower in PTENfl/fl mice and higher in PTEN/SOCS3fl/fl mice as compared to naïve (uninjected/uninjured) controls, but neither difference was statistically significant (Fig 4C). Decreases in p-S6 following PTEN deletion alone is contrary to previous reports of strong activation of S6 phosphorylation following PTEN deletion in the sensorimotor cortex (Lewandowski and Steward, 2014; Liu et al., 2010; Zukor et al., 2013). Potential reasons for this discrepancy are addressed in the Discussion section.
As seen in the prior experiment without AAV injection, Western blot analysis revealed non-significant increases in p-S6 in L4/5 DRG 3 days after crush with PTEN deletion or PTEN/SOCS3 co-deletion (3.45 ± 1.15 and 4.21 ± 1.60 fold differences vs naïve controls, respectively, NS; Fig 4C). There were similar increases in p-S6 levels at 3 days post-injury in AAV-GFP injected DRGs (2.91 ± 0.87 fold difference vs naïve controls, NS). For all groups, increases were not as great as observed in the previous experiment involving uninjected ganglia. Taken together, these data suggest that prior intraganglionic injection may diminish mTOR activation following subsequent sciatic nerve crush, possibly due to damage associated with injection. If so, there may be a heterogenous response to injury within different subsets of neurons contained in our whole DRG preps with increased activation in transfected neurons being masked by diminished activation in others.
As seen without AAV injection, p-S6 levels returned to near baseline levels by 7 days post-injury with PTEN deletion alone (1.89 ± 0.63 fold difference vs 0 day naïve controls, NS). However, p-S6 remained elevated 7 days post-injury with PTEN/SOCS3 co-deletion (5.30 ± 1.27 fold increase vs 0 day naïve controls, p < 0.05). Thus, PTEN deletion did not enhance or extend activation of mTOR beyond injury alone. PTEN/SOCS3 co-deletion also failed to enhance mTOR activation at 3 days but did maintain activation to at least 7 days post-injury.
In contrast to p-S6, p-Stat3 levels were comparable to naïve controls in uninjured DRG following AAV-Cre injections for PTEN or PTEN/SOCS3 co-deletion. This finding is intuitive given that the SOCS3 gene is not actively transcribed under physiologically normal conditions and, therefore, SOCS3 deletion should not alter the phosphorylation state of Stat3 without injury. As with p-S6, all intraganglionic injections dampened the 3 days post-injury increase in p-Stat3 levels that was predicted by the results of the previous experiment. The lack of p-Stat3 elevation at 3 days post-injury is particularly surprising after PTEN/SOCS3 co-deletion group given the role of SOCS3 as a negative feedback regulator of Jak/Stat signaling (Fig 4D). With p-Stat3 levels also lower in AAV-GFP injected ganglia at 3 days post-injury (Fig 4D), these data suggest that prior intraganglionic injection may diminish early Jak/Stat activation with the same caveat regarding heterogenous neuronal responses within the DRG as stated above.
At 7 days after crush when p-Stat3 levels had returned to baseline in uninjected DRG, p-Stat3 levels with PTEN deletion alone remained near that of naïve controls (Fig 4D). At this time point in DRG with PTEN/SOCS3 co-deletion, p-Stat3 levels trended to their highest level in this group (2.96 ± 0.70 fold difference vs 0 day naïve controls, p = 0.0987).
Taken together, the Western blot data suggest (1) that injection with either AAV-Cre or AAV-GFP blunts phosphorylation of both S6 and Stat3 normally observed after crush, possibly due to damage associated with the injection (2) that neither PTEN deletion nor PTEN/SOCS3 co-deletion enhances S6 or Stat3 phosphorylation following nerve crush, and (3) that PTEN/SOCS3 co-deletion may prolong activation of these pathways following injury. Further interpretation of these results and their caveats are included in the Discussion section.
Effect of PTEN and PTEN/SOCS3 co-deletion on regeneration of sensory axons in the sciatic nerve following nerve crush
To determine the effects of PTEN and PTEN/SOCS3 co-deletion on axonal regeneration in peripheral nerves, the number of regenerating sensory axons in the sciatic nerve was quantified three days after crush. This time point was chosen for anatomical quantification of axonal regeneration because regeneration progressed beyond an accurately measurable distance within seven days of injury within all groups. To identify regenerating axons, sectioned nerves were stained for SCG10 (also known as stathmin-2), a known regulator of microtubule stability that is upregulated in regenerating sensory axons (Shin et al., 2014). Sciatic nerves from all groups contained large numbers of SCG10-expressing axons regenerating beyond the crush site (Fig 5A-D). For the most part, regenerating axons extended together, creating the look of a large front of axons ending in growth cone enlargements with a few leading axons extending farther. In sciatic nerves from both PTEN and PTEN/SOCS3 co-deleted animals, the primary front of regenerating axons appeared to be further distal to the injury site compared to control conditions.
Figure 5. Effect of PTEN and PTEN/SOCS3 co-deletion on regeneration of sensory axons in the sciatic nerve following nerve crush.
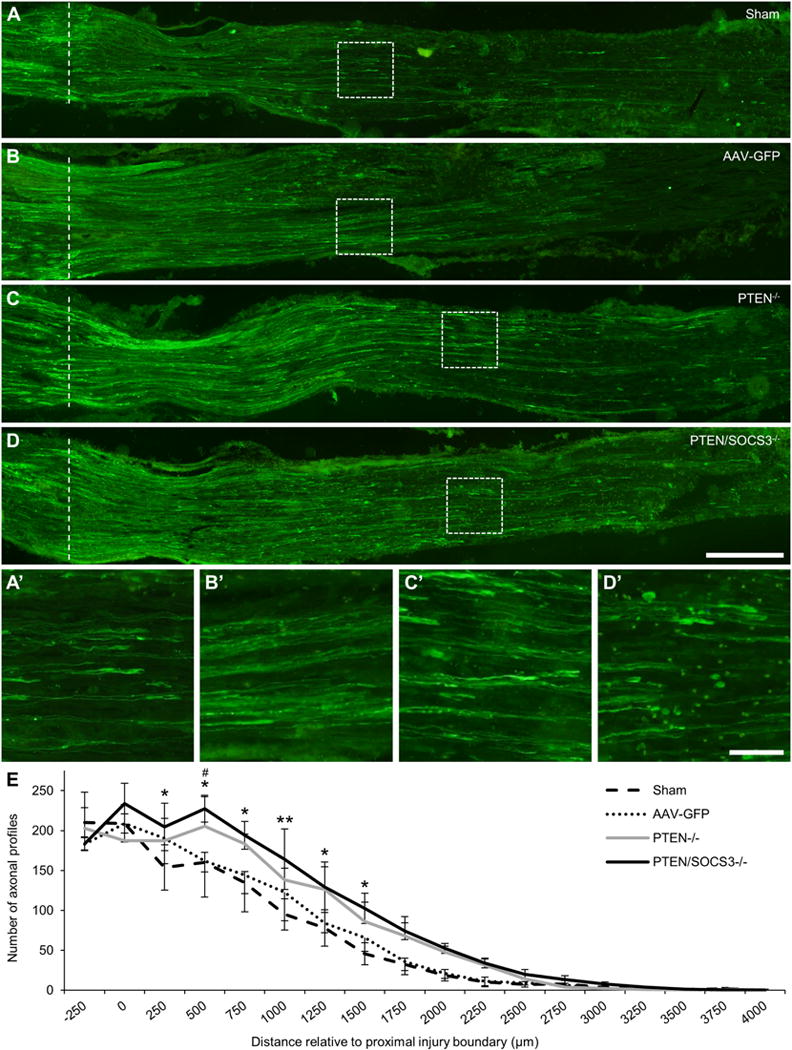
A-D: Representative 20x stitched images of SCG10-expressing regenerating sensory axons in sciatic nerves 3 days after sciatic nerve crush from sham (A), AAV-GFP (B), PTEN−/− (C), and PTEN/SOCS3−/− mice (D). The proximal boundary of the injury site is marked with a dotted line. Areas within dashed boxes are shown in A’-D’ to show regenerating axons and growth cone-like swellings near the primary front of axonal regeneration in each case. E: Graph of axon counts performed in every 6th section at 250 μm intervals relative to the proximal injury boundary (labeled as 0; n = 3 per group). For clarity, SEM is shown in only the up direction for PTEN−/− and the down direction for AAV-GFP. While both PTEN deletion alone and PTEN/SOCS3 co-deletion significantly enhanced total axonal regeneration (p < 0.001 PTEN/SOCS3−/− vs sham and AAV-GFP; p < 0.01 PTEN−/− vs sham; p < 0.05 vs AAV-GFP), PTEN/SOCS3 co-deletion increased the number of regenerating axons at the distances indicated. * p < 0.05, ** p < 0.01 PTEN/SOCS3−/− vs sham, # p < 0.05 PTEN/SOCS3−/− vs AAV-GFP. Scale bar = 250 μm in A-D; scale bar = 50 μm in A’-D’.
Quantification revealed a statistically similar number of labeled axons proximal to the boundary of the crush site between all groups (Fig 5E). Matched sets one-way ANOVA revealed a significant overall difference between PTEN/SOCS3 co-deletion and the sham control group (p < 0.001). Post-hoc comparisons revealed significantly higher numbers of labeled axons beginning at 250 μm and continuing through 1500 μm distal to the proximal boundary of the crush site in the PTEN/SOCS3 co-deletion group as compared to sham controls (Fig 5A, D–E; p < 0.05 at 250, 500, 750, 1250, and 1500 μm distances, p < 0.01 at 1000 μm). There was also a significant overall difference between PTEN/SOCS3 co-deletion and AAV-GFP injected controls (p < 0.001); however, post-hoc comparisons revealed statistically significant differences only at 500 μm (227.3 ± 16.7 axons PTEN/SOCS3−/− vs 162.0 ± 45.4 axons AAV-GFP, p < 0.05).
Similarly, matched sets one-way ANOVA revealed a significant overall difference between PTEN deletion alone and both control groups (Fig 5C & E, p < 0.01 PTEN−/− vs Sham, p < 0.05 PTEN−/− vs AAV-GFP); despite the overall difference, however, there were no significant differences between the PTEN deletion and either control group at any of the individually examined distances. Overall, the quantitative analyses support the conclusion that deletion of PTEN alone and PTEN/SOCS3 co-deletion enhances the distance of regeneration at 3 days post-injury.
Effect of PTEN and PTEN/SOCS3 co-deletion on functional recovery following nerve crush
To determine if the effects of deletion on axonal regeneration extended to improved functional recovery, behavioral measures of sensation were recorded prior to nerve crush and at weekly intervals thereafter. Testing 4 hrs prior to injury (day 0 on graphs) revealed that the intraganglionic injections did not significantly alter sensory thresholds for either thermosensation or mechanosensation.
All groups initially lost noxious thermosensation following sciatic nerve crush, as shown by increased latency to respond to focused light applied using a Hargreave’s apparatus (Fig 6A; no overall treatment effect, significant interaction between treatment and time (p < 0.05) in two-way RM ANOVA). Latency periods in mice with PTEN deletion alone overlapped with those from the control groups at all time points. In contrast, mice with PTEN/SOCS3 co-deletion had a shorter latency to respond to thermal stimulation at 14 days after crush as compared to sham (10.56 ± 0.96 sec PTEN/SOCS3−/− vs 12.23 ± 0.41 sec Sham, p < 0.05) and AAV-GFP injected controls (12.81 ± 0.78 sec, p < 0.001). This separation was no longer present at 21 days after crush, where all groups were nearing the same plateau in functional recovery that left them hyperalgesic as compared to pre-injury baseline.
Figure 6. Effect of PTEN and PTEN/SOCS3 co-deletion on functional recovery following nerve crush.
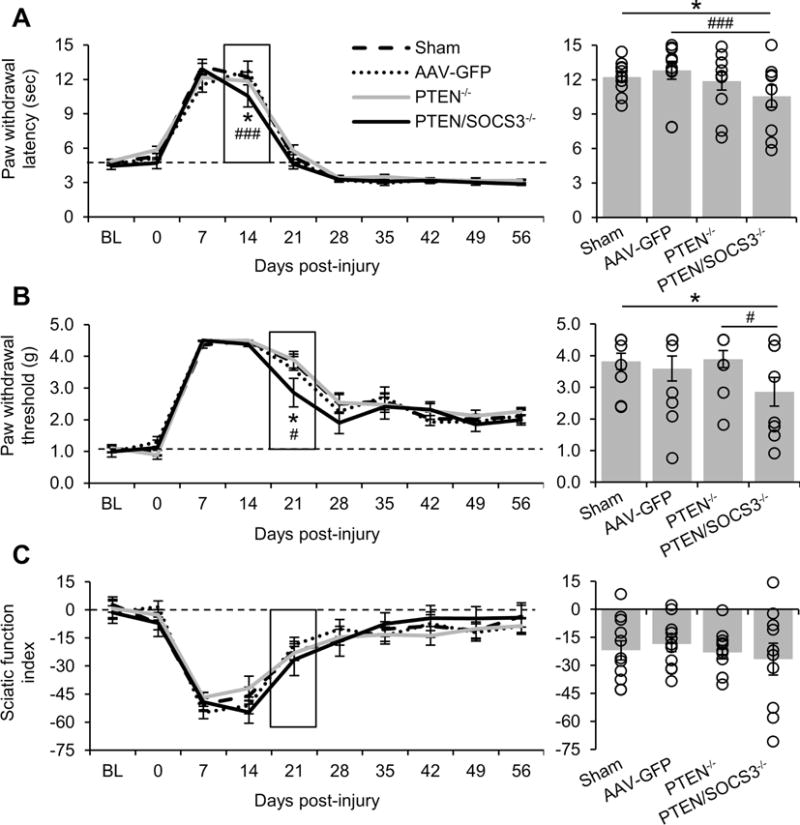
A-C: Graphical representation of functional recovery of noxious thermosensation (A), mechanosensation (B), and motor function (C). Measurements were taken two weeks prior to DRG injections or sham surgery (baseline, BL), 4 hours prior to crush (0), and at eight weekly time points after crush injury. To highlight the significant differences between the responses of PTEN/SOCS−/− mice and other groups, the lower standard error bars for PTEN−/− in A and for AAV-GFP in B have been omitted. The bar graphs to the right show the data for the boxed time point with individual data points represented by hollow circles. PTEN/SOCS3 co-deletion in DRG neurons accelerated functional recovery as shown by separation of this group from other groups at 14 days for noxious thermosensation and 21 days post-injury for mechanosensation. * p < 0.05 PTEN/SOCS3−/− vs sham, ### p < 0.001 PTEN/SOCS3−/− vs AAV-GFP in A. * p < 0.05 PTEN/SOCS3−/− vs sham, # p < 0.001 PTEN/SOCS3−/− vs PTEN −/− in B.
Similarly, all groups initially lost mechanosensation following sciatic nerve crush, as shown by a lack of responsiveness to stimulation with von Frey filaments at 7 and 14 days after crush (Fig 6B; no overall treatment effect or interaction between treatment and time). Response thresholds in mice with PTEN deletion alone overlapped with those from the control groups at all time points. In contrast, mice with PTEN/SOCS3 co-deletion appeared to have modestly improved mechanosensation during the recovery phase (no overall treatment effect or interaction between treatment and time in two-way RM ANOVA). At 21 days after crush, animals with PTEN/SOCS3 co-deletion had a significantly lower threshold to mechanical stimulation as compared to sham controls (2.86 ± 0.45 g PTEN/SOCS3−/− vs 3.82 ± 0.25 g Sham, p < 0.05) and PTEN deletion alone (3.89 ± 0.27 g PTEN−/−, p < 0.05). At later time points, there were no differences across groups and all remained hyposensitive to mechanical stimuli as compared to pre-injury baseline.
To determine if the effect of deletion on functional recovery was intrinsic or extended to non-deleted motor axons growing alongside deleted sensory axons, we assessed motor recovery by calculating sciatic function index (SFI; Fig 6C). As AAV-Cre was injected directly into the L4/5 dorsal root ganglia of PTENfl/fl and PTEN/SOCS3fl/fl mice, regeneration of motor axons originating in the ventral horn of the spinal cord should not be altered if the effect of deletion is cell-intrinsic.
Following injury, SFI showed a pattern of deficit and recovery very similar to mechanosensation with severe deficits at 7 and 14 days after crush and then recovery to a plateau at 28 days. Statistical analysis revealed no effect of treatment or time between any groups.
Discussion
The goal of this study was to determine whether PTEN deletion alone or PTEN/SOCS3 co-deletion would enhance regeneration of peripheral nerve axons that already have a capacity for regeneration. Our data confirm previous findings that both signaling pathways are transiently activated following nerve crush. Deletion of PTEN, a negative regulator of the PI3K pathway, in lumbar dorsal root ganglia did not lead to detectable enhancement of activation of the signaling pathways by Western blot, but still increased the distance of sensory axon regeneration within the sciatic nerve at 3 days post-injury. Co-deletion of PTEN and SOCS3, a negative feedback regulator of Jak/Stat signaling, did lead to detectable enhancement of Stat3 phosphorlyation until at least 7 days post-injury and led to increases in the distance of axonal regeneration at 3 days post-injury that were comparable to what occurred with PTEN deletion alone. Additionally, co-deletion of PTEN/SOCS3 led to more rapid recovery of noxious thermosensation and mechanosensation at 14 and 21 day time points, respectively, after which all groups reached the same functional plateau. Together, these findings indicate that deletion of PTEN alone and co-deletion of PTEN and SOCS3 lead to modest but measureable enhancements in regeneration of DRG sensory axons in the periphery. The potential caveats and limitations of these results are discussed below.
Relationship between PTEN expression and S6 phosphorylation in uninjured dorsal root ganglia
Our immunohistochemical analysis shows that PTEN is more strongly expressed in small diameter neurons within the dorsal root ganglia relative to large diameter neurons, consistent with the findings of others (Christie et al., 2010). Conversely, immunostaining for p-S6 is higher in large diameter neurons. This reciprocal pattern is consistent with the relationships between PTEN and PI3K; high expression of PTEN will canonically inhibit PI3K activation, which would be reflected by decreased S6 phosphorylation. It is noteworthy that previous studies indicate that p70S6K, which phosphorylates S6 in response to PI3K/mTOR activation, is more highly expressed in small diameter neurons, similar to the pattern of PTEN expression shown here (Xu et al., 2010). In the absence of PTEN expression in large diameter neurons, relatively little activation of the PI3K pathway may be sufficient to maintain S6 phosphorylation. It may also be that the phosphorylation of S6 at Ser 235/236 is mediated by MAPK signaling in these neurons (Roux et al., 2007).
Activation of PI3K and Jak/Stat signaling in the dorsal root ganglia following sciatic nerve crush
In the present study, activation of the PI3K pathway following injury was reflected by an increase in S6 phosphorylation three days after sciatic nerve crush. This finding is consistent with previous studies reporting early and transient increases in S6 and Akt phosphorylation within the DRG following sciatic nerve ligation or transection (Abe et al., 2010; Saijilafu et al., 2013) and mTOR phosphorylation within the proximal segment of the sciatic nerve following crush (Sun et al., 2013). Upregulation of neurotrophic factors in the distal portion of the injured sciatic nerve is crucial for the support of regenerating axons (Boyd and Gordon, 2003; Terenghi, 1999), and may contribute to activation of AKT/mTOR at the level of the cell body.
The importance of the PI3K pathway for neuronal survival and growth after peripheral nerve injury has been previously demonstrated (Namikawa et al., 2000; Saijilafu et al., 2013); however, the role of mTOR activation for regeneration of peripheral axons is unknown. While it seems clear that mTOR activation is important for CNS regeneration within regenerative animal models (Byrne et al., 2014; Diekmann et al., 2015) or after PTEN deletion in the mouse (Park et al., 2008; Sun et al., 2011), the role of mTOR versus other downstream targets of PI3K such as GSK3β is disputed with regards to peripheral axon regeneration. Abe and colleagues (2010) reported that activation of mTOR via congenital deletion of the direct upstream inhibitor TSC2 enhanced regeneration of DRG neurons, whereas Christie et al (2010) reported that enhanced regeneration seen with pharmacological inhibition of PTEN was independent of mTOR. It is possible that multiple targets of Akt are beneficial for regeneration.
Activation of the Jak/Stat pathway was observed as a transient increase in p-Stat3 levels in Western blots at one and three days after sciatic nerve crush, consistent with findings from the dorsal root ganglia (Lee et al., 2004; Qiu et al., 2005) and sciatic nerve (Sheu et al., 2000) following sciatic nerve transection. Immunostaining for p-Stat3 revealed the expected pattern of nuclear labeling within both large and small diameter neurons after crush. However, these data do not readily align with Western blot data. This may indicate that Stat3 is phosphorylated to a great extent in neurons immediately damaged by the crush injury, leading to increased p-Stat3 in Western blot. By seven days, uninjured neurons may contain low levels of p-Stat3 due to cytokine signaling from adjacent injured neurons, leading to the increased number of p-Stat3-expressing neurons even as the overall level of p-Stat3 is declining.
The Jak/Stat pathway also has a documented role in regeneration. Following injury, neuropoietic cytokines are released from a number of cellular sources to signal through gp130 receptors (Bauer et al., 2007; Cafferty et al., 2001; Murphy et al., 1995; Sendtner et al., 1997; Zigmond, 2011). Following the initial phosphorylation of Stat3 within damaged axons near the site of injury, p-Stat3 is retrogradely transported to the cell bodies within the dorsal root ganglia (Lee et al., 2004; Sheu et al., 2000). Blocking Jak/Stat signaling attenuates the regenerative effects of a conditioning lesion both in vitro and in vivo (Liu and Snider, 2001; Qiu et al., 2005). In the central nervous system, the regenerative effects of SOCS3 deletion are dependent upon gp130 and Stat3 (Smith et al., 2009; Sun et al., 2011).
Alterations in expression with intra-ganglionic injections of AAV/Cre
With direct injection of AAV-Cre into the DRG, approximately 35% of the neurons within the ganglia are transfected in our model based on results from tdTomato-reporter mice. This has important implications for interpretation. Western blot analysis quantifies total pS6 levels in the ganglion, which are a combination of levels in all cells, and do not accurately reflect changes in expression in the population of neurons that were transfected. Thus, complete deletion of PTEN and SOCS3 in 35% of the neurons would be expected to lead to only about a 35% decrease in total protein levels as measured by Western blots of ganglia. Western blot data could be further compromised if there are increases in protein levels in the 65% of non-transected neurons and complete deletion in 35%. The same applies to Western blot analyses of pS6 and pStat. In contrast, immunocytochemistry provides a data on the consequences of AAV-Cre mediated recombination on a single cell basis. These considerations provide the framework for our interpretation.
Phosphorylation of S6 is a marker of activation of AKT/mTOR, and previous studies document strong activation of S6 phosphorylation with PTEN deletion in the retina and cortex as revealed by immunocytochemistry (Park et al., 2008, Lewandowski and Steward, 2014; Liu et al., 2010b; Zukor et al., 2013). It is unknown whether this would be detectable by Western blot, however. AAV-Cre injections into uninjured ganglia in PTENfl/fl or PTEN/SOCS3fl/fl mice did not lead to increases in overall levels of p-S6 in the DRG as measured by Western blot, which may be attributable to the limitations of Western blots discussed above or to the fact that S6 is already phosphorylated in a subpopulation of adult sensory neurons as shown in our immunostaining results, leading to a ceiling effect that occludes additional activation.
PTEN deletion also did not significantly enhance overall levels of S6 phosphorylation following sciatic nerve crush as measured by Western blot. Indeed, if anything, levels of pS6 observed by Western blot were lower in AAV-injected vs. uninjected ganglia. Again, this may reflect the limitations of Western blot analyses or that PI3K is maximally activated at early time points following injury so that removing negative regulation would not lead to further activation.
PTEN/SOCS3 co-deletion activates Jak/Stat signaling for at least 7 days following sciatic nerve crush
PTEN/SOCS3 co-deletion did not lead to increases in phosphorylation of S6 or Stat3 in Western blots at three days after sciatic nerve crush, but did lead to increased phosphorylation seven days after crush. The effect of PTEN/SOCS3 co-deletion on S6 phosphorylation is surprising given the lack of an effect of PTEN deletion alone. This finding suggests cross-talk between PI3K and Jak/Stat pathways that could generate a positive feedback loop in the absence of inhibition. Crosstalk between these two pathways has been previously suggested in studies of cultured DRG neurons (Quarta et al., 2014) as well as following PTEN/SOCS3 co-deletion in the optic nerve (Sun et al., 2011). Sun and colleagues demonstrated that regeneration after PTEN deletion is independent of gp130 and Stat3 and that regeneration after SOCS3 deletion is independent of mTOR. Yet, in this optic nerve model, the pro-regenerative effect of PTEN/SOCS3 co-deletion are more than additive. Furthermore, PTEN/SOCS3 co-deletion increases transcription of Rheb and IGF-1—two positive regulators of PI3K signaling—beyond either deletion alone (Sun et al., 2011). Combined with other pathways that link activation of Jak to phosphorylation of PI3K (Burfoot et al., 1997; Takahashi-Tezuka et al., 1998) and activation of mTOR to phosphorylation of Stat3 at Ser727 (Yokogami et al., 2000), there are many potential points for positive feedback between these two pathways that will require further investigation.
PTEN deletion and PTEN/SOCS3 co-deletion increase the distance of axonal regeneration at 3 days post-injury
We quantified regeneration by immunostaining sciatic nerves for superior cervical ganglion-10 (SCG10, also known as stathmin-2), a known regulator of microtubule stability (Riederer et al., 1997). Recent work has highlighted the usefulness of SCG10 immunostaining for quantifying regeneration from DRG neurons as it is only in the proximal portion of regenerating sensory axons as early as one hour post injury (Shin et al., 2014). These qualities are ideal for quantifying regeneration in the sciatic nerve three days after a crush injury, a model which allows regeneration under control conditions. In interpreting the anatomical results, it is important to recall that presumably about 35% of the regenerating axons come from transfected neurons and the rest come from neurons with intact PTEN and SOCS3 expression. SCG10 will be present in all regenerating sensory axons.
Even with the amount of successful regeneration seen in control groups, there is an overall effect of PTEN deletion on regeneration beyond the crush site three days after injury. Counts equate to an average regeneration rate of 434 ± 9 μm/day in PTEN deleted animals versus 311 ± 45 μm/day in sham controls, an increase of approximately 40%. However, axon counts from the PTEN deleted group did not statistically separate from control groups at any of the individual distances measured.
Where previous findings from the optic nerve indicate that PTEN/SOCS3 co-deletion dramatically enhances axon regeneration as compared to PTEN deletion alone (Sun et al., 2011), PTEN/SOCS3 co-deletion in the DRG had only modest effects on DRG axon regeneration, and did not increase regeneration beyond what was seen with PTEN deletion alone. This effect is apparent anatomically, where SCG10-expressing axons extend further distances in PTEN/SOCS3 co-deleted nerves as compared to both sham and AAV-GFP control groups. These counts equate to an average regeneration rate of 438 ± 37 μm/day in PTEN/SOCS3 co-deleted animals versus 311 ± 45 μm/day in sham controls, an increase of greater than 40 %. Again, this calculation may underestimate the overall pro-regenerative effect of deletion as only about 35% of the neurons are transfected while all regenerating sensory axons are quantified using SCG10.
PTEN/SOCS3 co-deletion leads to increased cutaneous sensitivity at discrete points during recovery
Both PTEN deletion alone and PTEN/SOCS3 co-deletion enhanced early axon regeneration, but differences in functional recovery were only seen following PTEN/SOCS3 co-deletion. Relatively small increases in noxious thermosensation and mechanosensation were observed at 14 and 21 days post-injury, respectively. Thermo- and mechanosensitivity as measured here are canonically mediated by small to medium diameter neurons. Our immunohistochemical analysis demonstrates that many small neurons express PTEN normally, but it remains to be directly determined whether the neurons that mediate the sensations measured here are PTEN positive. If not, this would explain a lack of effect of PTEN deletion.
Because PTEN deletion does not enhance or prolong S6 phosphorylation in the dorsal root ganglia, removing PTEN inhibition may provide only a modest boost to regeneration at early stages following injury—when PI3K activation is high—but this effect may decline along with endogenous PI3K signaling at later stages. This would prevent further separation of regenerating PTEN−/− axons from normally regenerating axons as they travel the length of the sciatic nerve, thus arriving at peripheral targets in a time frame that is indistinguishable by the weekly measurements performed here. This interpretation is compatible with other works that found a pro-regenerative effect of other methods of PTEN inhibition or TSC2 knockout (Abe et al., 2010; Christie et al., 2010). Most measurements within these studies were performed after brief 18-24 hour periods in vitro. In vivo measurements were performed 12-24 hours after crush injury or 7 days after a severe transection injury that presented significant obstacles for regeneration.
While PTEN/SOCS3 co-deletion resulted in improved noxious thermosensation and mechanosensation at 14 and 21 days post-injury, respectively, all groups eventually reached the same functional plateau for both modes of sensation. Enhanced recovery at these time points could be attributable to the fact that PI3K and Jak/Stat signaling are elevated for at least 7 days following PTEN/SOCS3 co-deletion, but not PTEN deletion alone. In this case, regeneration could be enhanced for a period sufficient to lead to earlier recovery of sensation. The lack of an effect on the sciatic function index, which is a measure of motor function, supports the conclusion that enhancement of regeneration is cell autologous, affecting axons from sensory neurons that were transfected but not motor axons originating in the spinal cord.
The behavioral recovery observed in the present study is consistent with regeneration rather than sprouting of spared axons from the saphenous nerve. The regeneration rates calculated from our axon counts indicate that axons could reach the hind paw within 14 days and our timelines are consistent with previous reports (Dinh et al., 2009; Hoang et al., 2012). Furthermore, stimulation of spared projections from the saphenous nerve results in tactile allodynia (Decosterd and Woolf, 2000), which was not observed at any time point during our study. The observation that noxious thermosensation recovers faster than mechanosensation could be due to the nature of the behavioral tests; the Hargreave’s apparatus focuses a beam of light on a larger area of the hind paw than the von Frey filaments. This larger focus could be stimulating a larger number of regenerated projections. The different timelines could also be attributed to the relatively simple combination of free nerve endings and unmyelinated axons that relay noxious heat signals. Sensory neurons conveying mechanosensory information must reinnervate specialized sensory organs and be remyelinated to regain normal function (Chen et al., 2007; Tong et al., 2015).
Conclusion
Overall, the findings here support previous work indicating that manipulations of the PI3K and Jak/Stat pathways in conjunction enhance axon regeneration. However, the regeneration-enhancing effects were modest, which may reflect the fact that DRG axons already have a robust regenerative capacity. It remains to be seen whether pro-regenerative effects would be more pronounced with more severe injuries that provide a more significant barrier for regeneration and recovery.
Highlights.
PI3K and Jak/Stat activation in the DRG is early and transient after nerve crush.
PTEN/SOCS3 co-deletion maintains PI3K activation to at least 7 days post-injury.
PTEN deletion increases regeneration distance 3 days after sciatic nerve crush.
PTEN/SOCS3 co-deletion increases regeneration and results in earlier recovery.
Acknowledgments
Supported by NIH grant NS047718 (O.S.). Postdoctoral support provided by a Craig H. Neilsen Foundation postdoctoral fellowship (Z.G.). We gratefully acknowledge generous donations from Cure Medical and Research for Cure. Thanks to Dr. Catherine Cahill for sharing equipment used to measure functional recovery and Walter Guerrero for his assistance in sciatic nerve processing and axon quantification.
Footnotes
Publisher's Disclaimer: This is a PDF file of an unedited manuscript that has been accepted for publication. As a service to our customers we are providing this early version of the manuscript. The manuscript will undergo copyediting, typesetting, and review of the resulting proof before it is published in its final citable form. Please note that during the production process errors may be discovered which could affect the content, and all legal disclaimers that apply to the journal pertain.
Commercial Interest
Oswald Steward has financial interests in the company Axonis, which holds options on patents related to PTEN deletion and regeneration.
References
- Abe N, Borson SH, Gambello MJ, Wang F, Cavalli V. Mammalian Target of Rapamycin (mTOR) Activation Increases Axonal Growth Capacity of Injured Peripheral Nerves. J Biol Chem. 2010;285:28034–28043. doi: 10.1074/jbc.M110.125336. [DOI] [PMC free article] [PubMed] [Google Scholar]
- Bauer S, Kerr BJ, Patterson PH. The neuropoietic cytokine family in development, plasticity, disease and injury. Nat Rev Neurosci. 2007;8:221–232. doi: 10.1038/nrn2054. [DOI] [PubMed] [Google Scholar]
- Boyd JG, Gordon T. Neurotrophic factors and their receptors in axonal regeneration and functional recovery after peripheral nerve injury. Mol Neurobiol. 2003;27:277–323. doi: 10.1385/MN:27:3:277. [DOI] [PubMed] [Google Scholar]
- Burfoot MS, Rogers NC, Watling D, Smith JM, Pons S, Paonessaw G, Pellegrini S, White MF, Kerr IM. Janus Kinase-dependent Activation of Insulin Receptor Substrate 1 in Response to Interleukin-4, Oncostatin M, and the Interferons. J Biol Chem. 1997;272:24183–24190. doi: 10.1074/jbc.272.39.24183. [DOI] [PubMed] [Google Scholar]
- Byrne AB, Walradt T, Gardner KE, Hubbert A, Reinke V, Hammarlund M. Insulin/IGF1 Signaling Inhibits Age-Dependent Axon Regeneration. Neuron. 2014;81:561–573. doi: 10.1016/j.neuron.2013.11.019. [DOI] [PMC free article] [PubMed] [Google Scholar]
- Cafferty WB, Gardiner NJ, Gavazzi I, Powell J, McMahon SB, Heath JK, Munson J, Cohen J, Thompson SW. Leukemia inhibitory factor determines the growth status of injured adult sensory neurons. J Neurosci Off J Soc Neurosci. 2001;21:7161–7170. doi: 10.1523/JNEUROSCI.21-18-07161.2001. [DOI] [PMC free article] [PubMed] [Google Scholar]
- Chaplan SR, Bach FW, Pogrel JW, Chung JM, Yaksh TL. Quantitative assessment of tactile allodynia in the rat paw. J Neurosci Methods. 1994;53:55–63. doi: 10.1016/0165-0270(94)90144-9. [DOI] [PubMed] [Google Scholar]
- Chen ZL, Yu WM, Strickland S. Peripheral Regeneration. Annu Rev Neurosci. 2007;30:209–233. doi: 10.1146/annurev.neuro.30.051606.094337. [DOI] [PubMed] [Google Scholar]
- Christie KJ, Webber CA, Martinez JA, Singh B, Zochodne DW. PTEN Inhibition to Facilitate Intrinsic Regenerative Outgrowth of Adult Peripheral Axons. J Neurosci. 2010;30:9306–9315. doi: 10.1523/JNEUROSCI.6271-09.2010. [DOI] [PMC free article] [PubMed] [Google Scholar]
- Danilov CA, Steward O. Conditional genetic deletion of PTEN after a spinal cord injury enhances regenerative growth of CST axons and motor function recovery in mice. Exp Neurol. 2015;266:147–160. doi: 10.1016/j.expneurol.2015.02.012. [DOI] [PMC free article] [PubMed] [Google Scholar]
- Decosterd I, Woolf CJ. Spared nerve injury: an animal model of persistent peripheral neuropathic pain. Pain. 2000;87:149–158. doi: 10.1016/S0304-3959(00)00276-1. [DOI] [PubMed] [Google Scholar]
- de Ruiter GCW, Malessy MJA, Alaid AO, Spinner RJ, Engelstad JK, Sorenson EJ, Kaufman KR, Dyck PJ, Windebank AJ. Misdirection of regenerating motor axons after nerve injury and repair in the rat sciatic nerve model. Exp Neurol. 2008;211:339–350. doi: 10.1016/j.expneurol.2007.12.023. [DOI] [PMC free article] [PubMed] [Google Scholar]
- Diekmann H, Kalbhen P, Fischer D. Active mechanistic target of rapamycin plays an ancillary rather than essential role in zebrafish CNS axon regeneration. Front Cell Neurosci. 2015;9 doi: 10.3389/fncel.2015.00251. [DOI] [PMC free article] [PubMed] [Google Scholar]
- Dinh P, Hazel A, Palispis W, Suryadevara S, Gupta R. Functional assessment after sciatic nerve injury in a rat model. Microsurgery. 2009;29:644–649. doi: 10.1002/micr.20685. [DOI] [PubMed] [Google Scholar]
- Forster MD, Dedes KJ, Sandhu S, Frentzas S, Kristeleit R, Ashworth A, Poole CJ, Weigelt B, Kaye SB, Molife LR. Treatment with olaparib in a patient with PTEN-deficient endometrioid endometrial cancer. Nat Rev Clin Oncol. 2011;8:302–306. doi: 10.1038/nrclinonc.2011.42. [DOI] [PubMed] [Google Scholar]
- Fu SY, Gordon T. Contributing factors to poor functional recovery after delayed nerve repair: prolonged axotomy. J Neurosci. 1995;15:3876–3885. doi: 10.1523/JNEUROSCI.15-05-03876.1995. [DOI] [PMC free article] [PubMed] [Google Scholar]
- Hoang NS, Sar C, Valmier J, Sieso V, Scamps F. Electro-acupuncture on functional peripheral nerve regeneration in mice: a behavioural study. BMC Complement Altern Med. 2012;12:141. doi: 10.1186/1472-6882-12-141. [DOI] [PMC free article] [PubMed] [Google Scholar]
- Inserra MM, Bloch DA, Terris DJ. Functional indices for sciatic, peroneal, and posterior tibial nerve lesions in the mouse. Microsurgery. 1998;18:119–124. doi: 10.1002/(sici)1098-2752(1998)18:2<119::aid-micr10>3.0.co;2-0. [DOI] [PubMed] [Google Scholar]
- Kawaja MD, Smithson LJ, Elliott J, Trinh G, Crotty AM, Michalski B, Fahnestock M. Nerve Growth Factor Promoter Activity Revealed in Mice Expressing Enhanced Green Fluorescent Protein. J Comp Neurol. 2011;519:2522–2545. doi: 10.1002/cne.22629. [DOI] [PMC free article] [PubMed] [Google Scholar]
- Lee N, Neitzel KL, Devlin BK, MacLennan AJ. STAT3 phosphorylation in injured axons before sensory and motor neuron nuclei: Potential role for STAT3 as a retrograde signaling transcription factor. J Comp Neurol. 2004;474:535–545. doi: 10.1002/cne.20140. [DOI] [PubMed] [Google Scholar]
- Lewandowski G, Steward O. AAVshRNA-Mediated Suppression of PTEN in Adult Rats in Combination with Salmon Fibrin Administration Enables Regenerative Growth of Corticospinal Axons and Enhances Recovery of Voluntary Motor Function after Cervical Spinal Cord Injury. J Neurosci. 2014;34:9951–9962. doi: 10.1523/JNEUROSCI.1996-14.2014. [DOI] [PMC free article] [PubMed] [Google Scholar]
- Liu K, Lu Y, Lee JK, Samara R, Willenberg R, Sears-Kraxberger I, Tedeschi A, Park KK, Jin D, Cai B, Xu B, Connolly L, Steward O, Zheng B, He Z. PTEN deletion enhances the regenerative ability of adult corticospinal neurons. Nat Neurosci. 2010;13:1075–1081. doi: 10.1038/nn.2603. [DOI] [PMC free article] [PubMed] [Google Scholar]
- Liu RY, Snider WD. Different Signaling Pathways Mediate Regenerative versus Developmental Sensory Axon Growth. J Neurosci. 2001;21:RC164–RC164. doi: 10.1523/JNEUROSCI.21-17-j0003.2001. [DOI] [PMC free article] [PubMed] [Google Scholar]
- Murphy PG, Grondin J, Altares M, Richardson PM. Induction of interleukin-6 in axotomized sensory neurons. J Neurosci Off J Soc Neurosci. 1995;15:5130–5138. doi: 10.1523/JNEUROSCI.15-07-05130.1995. [DOI] [PMC free article] [PubMed] [Google Scholar]
- Namikawa K, Honma M, Abe K, Takeda M, Mansur K, Obata T, Miwa A, Okado H, Kiyama H. Akt/Protein Kinase B Prevents Injury-Induced Motoneuron Death and Accelerates Axonal Regeneration. J Neurosci. 2000;20:2875–2886. doi: 10.1523/JNEUROSCI.20-08-02875.2000. [DOI] [PMC free article] [PubMed] [Google Scholar]
- National Hospital Ambulatory Medical Care Survey. 2011 n.d. NAMCS/NHAMCS - Web Tables [WWW Document]. URL http://www.cdc.gov/nchs/ahcd/web_tables.htm#2011 (accessed 9.8.15).
- Navarro X, Vivó M, Valero-Cabré A. Neural plasticity after peripheral nerve injury and regeneration. Prog Neurobiol. 2007;82:163–201. doi: 10.1016/j.pneurobio.2007.06.005. [DOI] [PubMed] [Google Scholar]
- Noble J, Munro CA, Prasad VS, Midha R. Analysis of upper and lower extremity peripheral nerve injuries in a population of patients with multiple injuries. J Trauma. 1998;45:116–122. doi: 10.1097/00005373-199807000-00025. [DOI] [PubMed] [Google Scholar]
- Park KK, Liu K, Hu Y, Smith PD, Wang C, Cai B, Xu B, Connolly L, Kramvis I, Sahin M, He Z. Promoting Axon Regeneration in the Adult CNS by Modulation of the PTEN/mTOR Pathway. Science. 2008;322:963–966. doi: 10.1126/science.1161566. [DOI] [PMC free article] [PubMed] [Google Scholar]
- Qiu J, Cafferty WBJ, McMahon SB, Thompson SWN. Conditioning Injury-Induced Spinal Axon Regeneration Requires Signal Transducer and Activator of Transcription 3 Activation. J Neurosci. 2005;25:1645–1653. doi: 10.1523/JNEUROSCI.3269-04.2005. [DOI] [PMC free article] [PubMed] [Google Scholar]
- Quarta S, Baeumer BE, Scherbakov N, Andratsch M, Rose-John S, Dechant G, Bandtlow CE, Kress M. Peripheral Nerve Regeneration and NGF-Dependent Neurite Outgrowth of Adult Sensory Neurons Converge on STAT3 Phosphorylation Downstream of Neuropoietic Cytokine Receptor gp130. J Neurosci. 2014;34:13222–13233. doi: 10.1523/JNEUROSCI.1209-13.2014. [DOI] [PMC free article] [PubMed] [Google Scholar]
- Riederer BM, Pellier V, Antonsson B, Di Paolo G, Stimpson SA, Lütjens R, Catsicas S, Grenningloh G. Regulation of microtubule dynamics by the neuronal growth-associated protein SCG10. Proc Natl Acad Sci U S A. 1997;94:741–745. doi: 10.1073/pnas.94.2.741. [DOI] [PMC free article] [PubMed] [Google Scholar]
- Roux PP, Shahbazian D, Vu H, Holz MK, Cohen MS, Taunton J, Sonenberg N, Blenis J. RAS/ERK Signaling Promotes Site-specific Ribosomal Protein S6 Phosphorylation via RSK and Stimulates Cap-dependent Translation. J Biol Chem. 2007;282:14056–14064. doi: 10.1074/jbc.M700906200. [DOI] [PMC free article] [PubMed] [Google Scholar]
- Saijilafu, Hur E-M, Liu C-M, Jiao Z, Xu W-L, Zhou F-Q. PI3K–GSK3 signalling regulates mammalian axon regeneration by inducing the expression of Smad1. Nat Commun. 2013;4:2690. doi: 10.1038/ncomms3690. [DOI] [PMC free article] [PubMed] [Google Scholar]
- Sendtner M, Götz R, Holtmann B, Thoenen H. Endogenous ciliary neurotrophic factor is a lesion factor for axotomized motoneurons in adult mice. J Neurosci Off J Soc Neurosci. 1997;17:6999–7006. doi: 10.1523/JNEUROSCI.17-18-06999.1997. [DOI] [PMC free article] [PubMed] [Google Scholar]
- Sheu JY, Kulhanek DJ, Eckenstein FP. Differential Patterns of ERK and STAT3 Phosphorylation after Sciatic Nerve Transection in the Rat. Exp Neurol. 2000;166:392–402. doi: 10.1006/exnr.2000.7508. [DOI] [PubMed] [Google Scholar]
- Shin JE, Geisler S, DiAntonio A. Dynamic regulation of SCG10 in regenerating axons after injury. Exp Neurol. 2014;252:1–11. doi: 10.1016/j.expneurol.2013.11.007. [DOI] [PMC free article] [PubMed] [Google Scholar]
- Smith PD, Sun F, Park KK, Cai B, Wang C, Kuwako K, Martinez-Carrasco I, Connolly L, He Z. SOCS3 Deletion Promotes Optic Nerve Regeneration In Vivo. Neuron. 2009;64:617–623. doi: 10.1016/j.neuron.2009.11.021. [DOI] [PMC free article] [PubMed] [Google Scholar]
- Sun F, Park KK, Belin S, Wang D, Lu T, Chen G, Zhang K, Yeung C, Feng G, Yankner BA, He Z. Sustained axon regeneration induced by co-deletion of PTEN and SOCS3. Nature. 2011;480:372–375. doi: 10.1038/nature10594. [DOI] [PMC free article] [PubMed] [Google Scholar]
- Sun G, Li Z, Wang X, Tang W, Wei Y. Modulation of MAPK and Akt signaling pathways in proximal segment of injured sciatic nerves. Neurosci Lett. 2013;534:205–210. doi: 10.1016/j.neulet.2012.12.019. [DOI] [PubMed] [Google Scholar]
- Takahashi-Tezuka M, Yoshida Y, Fukada T, Ohtani T, Yamanaka Y, Nishida K, Nakajima K, Hibi M, Hirano T. Gab1 Acts as an Adapter Molecule Linking the Cytokine Receptor gp130 to ERK Mitogen-Activated Protein Kinase. Mol Cell Biol. 1998;18:4109–4117. doi: 10.1128/mcb.18.7.4109. [DOI] [PMC free article] [PubMed] [Google Scholar]
- Terenghi G. Peripheral nerve regeneration and neurotrophic factors. J Anat. 1999;194:1–14. doi: 10.1046/j.1469-7580.1999.19410001.x. [DOI] [PMC free article] [PubMed] [Google Scholar]
- Tong LL, Ding YQ, Jing HB, Li XY, Qi JG. Differential motor and sensory functional recovery in male but not female adult rats is associated with remyelination rather than axon regeneration after sciatic nerve crush. Neuroreport. 2015;26:429–437. doi: 10.1097/WNR.0000000000000366. [DOI] [PubMed] [Google Scholar]
- Xu JT, Zhao X, Yaster M, Tao YX. Expression and distribution of mTOR, p70S6K, 4E-BP1, and their phosphorylated counterparts in rat dorsal root ganglion and spinal cord dorsal horn. Brain Res. 2010;1336:46–57. doi: 10.1016/j.brainres.2010.04.010. [DOI] [PMC free article] [PubMed] [Google Scholar]
- Yang S, Xiao X, Meng X, Leslie KK. A Mechanism for Synergy with Combined mTOR and PI3 Kinase Inhibitors. PLoS ONE. 2011;6 doi: 10.1371/journal.pone.0026343. [DOI] [PMC free article] [PubMed] [Google Scholar]
- Zigmond RE. gp130 cytokines are positive signals triggering changes in gene expression and axon outgrowth in peripheral neurons following injury. Front Mol Neurosci. 2011;4:62. doi: 10.3389/fnmol.2011.00062. [DOI] [PMC free article] [PubMed] [Google Scholar]
- Zukor K, Belin S, Wang C, Keelan N, Wang X, He Z. Short Hairpin RNA against PTEN Enhances Regenerative Growth of Corticospinal Tract Axons after Spinal Cord Injury. J Neurosci. 2013;33:15350–15361. doi: 10.1523/JNEUROSCI.2510-13.2013. [DOI] [PMC free article] [PubMed] [Google Scholar]