Abstract
Background
We performed a meta-analysis to investigate the association of serum leptin levels with the pathogenesis of pulmonary tuberculosis (PTB).
Methods
The retrieval of related articles was achieved through searching the electronic databases according to strict inclusion criteria. The STATA version 12.0 statistical software was employed to calculate the standardized mean difference (SMD) and 95% confidence interval (CI) during the statistical analysis.
Results
Twelve case-control studies were enrolled in this meta-analysis. Our finding showed that serum leptin levels of healthy controls were markedly higher than those of PTB patients (SMD =0.70, 95% CI =0.51–0.89, P<0.001). Stratified analysis based on ethnicity presented that lower serum leptin levels were apparently associated with the development of PTB among both Asians and Caucasians (Asians: SMD =0.38, 95% CI =0.15–0.61, P=0.001; Caucasians: SMD =1.54, 95% CI =1.17–1.91, P<0.001). Furthermore, subgroups analysis based on the detecting method also showed that there was an association between the serum leptin levels and the development of PTB in both ELISA subgroup and RIA subgroup (ELISA: SMD =1.03, 95% CI =0.81–1.26, P<0.001; RIA: SMD =−0.41, 95% CI =−0.82 to −0.01, P=0.045).
Conclusions
In conclusion, our present findings suggest that decreased serum leptin levels may be associated with the pathogenesis of PTB.
Keywords: Leptin, pulmonary tuberculosis (PTB), association, risk, meta-analysis
Introduction
Pulmonary tuberculosis (PTB) is the second leading cause of death from infectious disease following those due to HIV infection, emerging as a major public health problem worldwide currently (1). Clinically, PTB may be caused by various strains of mycobacteria, in particular, Mycobacterium tuberculosis, which mainly spread through the air (2). Also, PTB may infect any part of the body, but most commonly occurs in the lungs (3). There are several general signs and symptoms of TB, including fever, chills, night sweats, especially diminished appetite and weight loss (4,5). Under the surveillance and results of the survey conducted by the World Health Organization (WHO) in 2012, the number of new PTB cases worldwide is estimated to be 8.6 million (122/100,000 population); the number of prevalent cases of PTB globally is estimated to be 12 million (169/100,000 population); the number of PTB deaths worldwide is estimated to be 1.3 million (940,000 among HIV-negative people and 320,000 among HIV-positive people) (6-8). The highest PTB rates are found mainly in low-income countries, especially those in Asia (58%) and the African Region (27%) (9). The five countries with the largest number of incident cases in 2012 were as follows: India, China, South Africa, Indonesia and Pakistan (10). It is well-established that there are multiple factors that may elevate the PTB risk, including genetic and environmental factors (11). Some studies show that PTB is associated with poverty (immigration, important social inequalities, overcrowding and malnutrition), diabetes pandemics, HIV infection and drug or alcohol abuse and cigarette smoking (9,12,13). Several intrinsic genetic factors, particularly, leptin, the increase of which may suppress the appetite, causing anorexia and loss of body mass, may be associated with the early immune response to pulmonary PTB, and thus contributing to the risk of PTB (5).
Leptin is one of the most important adipose-derived hormones, which has effect on the brain to regulate food intake and body weight, and is represented mainly in the adipocytes of white adipose tissue (14). Physiologically, through binding to the receptor, leptin plays an indispensable role in suppressing appetite, regulating energy metabolism, and has the function of promoting fat deposition, reproduction, bone formation, as well as neuroendocrine (5,15). To be specific, an increase of fat mass may raise leptin levels, which results in a satiety response, suppressing appetite, decreasing energy intake until weight is lost; however, when fat mass falls, the level of leptin, secreted by adipose tissue, is lowered, appearing to a starvation, improving appetite and food intake until weight is gained (16). Recently, it has been profoundly pointed out that leptin may have significant roles in the modulation of the immune response which may be closely related to the occurrence and progress of PTB (17). It has been indicated that the serum leptin level, expressed in PTB, may be mediated independently by inflammation and weight loss (18). Generally, the host inflammatory response may have large influence on a decrease of leptin production which advances proliferation, differentiation, and activation of hematopoietic cells, leading to the development of PTB (19). In clinical research, it has been found that serum leptin level was attentively low in the PTB due to the loss of body weight, indicating that prolonged inflammation may further suppress leptin production (20). Additionally, experimental evidence revealed that a decreased serum leptin concentration in tuberculosis might suppress cellular immunity which is essential to fight against Mycobacterium tuberculosis and therefore aggravate disease outcome (5). In view of all the mentioned findings, it may be a proper hypothesis that alteration in the serum leptin level may correlate with the accelerated development and the poor prognosis of PTB (18,21). Nevertheless, some opposite evidence demonstrated that altered serum leptin level may has no responsibility for the weight loss and anorexia, and may be not associated with PTB infection (20,22). Consequently, the study conducted a systematic review and meta-analysis to find the possible relationship of serum leptin level with the pathogenesis of PTB.
Methods
Literature search
We performed a comprehensive computer literature search to identify relevant articles. The PubMed database were searched for relevant studies from the inception to October, 2016 by the use of the medical subject headings (MESH) “tuberculosis, Leptin” supplemented by the keywords that we identified as being synonymous with tuberculosis and leptin. Studies selected into this meta-analysis should be case-control studies investigating the association between serum leptin levels and the risk of PTB. Additionally, if the same author published more than one studies based on the same case series, we will select the study of most recent publication or with the largest sample size. Any disagreement was settled by discussion and subsequently consensus with the authors.
Quality assessment
The quality assessment of each study was carried out independently by two authors. Quality appraisal of quantitative and qualitative studies was carried out using Critical Appraisal Skills Programme (CASP) scale. The checklists from the CASP were used to assess and assign a quality score (http://www.casp-uk.net/). Any disagreement regarding the quality of the study were resolved after discussion, and referred to a third author, if necessary.
Statistical analysis
The STATA version 12.0 statistical software (Stata Corp, College Station, TX, USA) was employed to deal with quantitative data. A fixed or random effect model was used to measure the standardized mean difference (SMD) and its 95% confidence intervals (CIs). The significance of the pooled estimate was made using the Z test. Cochran’s Q-statistic was applied to estimate the degree of heterogeneity among studies, and if P<0.05, is considered to be statistical significant (23). The I2 test was also used to quantify the heterogeneity (range from 0 to 100%) (24). Random-effect model (DerSimonian Laird method) was used when a significant Q-test with P<0.05 or I2>50%. Fixed-effects model (Mantel-Haenszel method) was adopted when there was no statistical heterogeneity. Subgroup analyses were performed based on country and detection method in order to explore the potential sources of heterogeneity. To evaluate the influence of individual study on overall estimate, we performed a sensitivity analysis by omitting each study in turn. Funnel plot were constructed to evaluate whether publication bias might influence the validity of the estimates. The symmetry of the Funnel plot was further investigated by Egger’s linear regression test (25). All tests were two-sided and a P value of <0.05 was considered statistically significant.
Results
Baseline characteristics of included studies
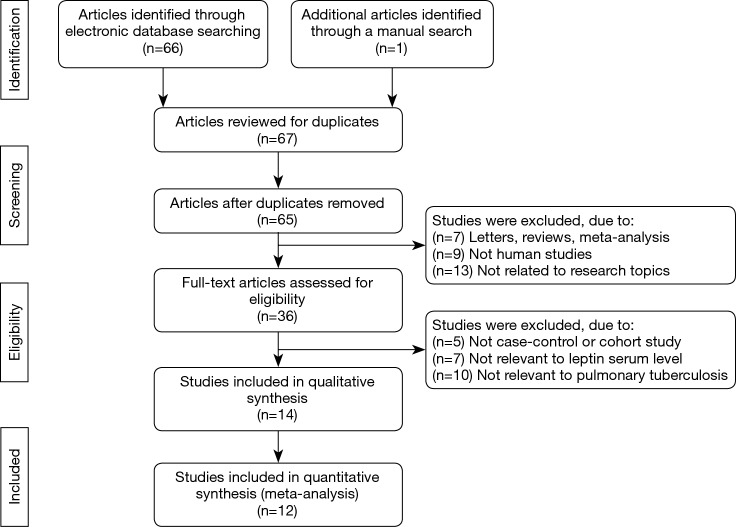
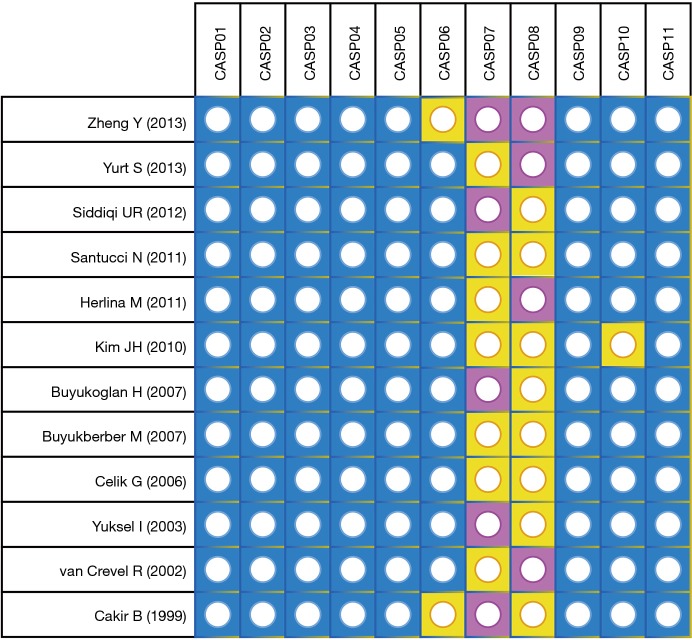
The PRISMA flow diagram of study selection for this meta-analysis was shown in Figure 1. A total of 67 articles associated with the searched keywords were identified at first. Of these articles, 31 were excluded based on the titles and key words; the full text of 36 was obtained and another 24 papers were eliminated after reviewing the abstract and full text. Eventually, 12 studies met our inclusion criteria were enrolled in this meta-analysis (5,18,20-22,26-32). These 12 case-control studies included 332 PTB patients and 292 healthy controls. Overall, 9 studies were conducted among Asians, and the remaining 3 studies were performed among Caucasians. Enzyme-linked immunosorbent assay (ELISA) and radioimmunoassay (RIA) methods were implemented for the detection of serum leptin levels. Table 1 showed the baseline characteristics of all eligible studies, and the quality assessment of all eligible studies was illustrated in Figure 2. In the figure, the blue color means the study was accorded with the criterion; the yellow color indicates that the study does not conform to the criterion; and the red color represents unclear.
Figure 1.
The PRISMA flow diagram of study selection for this meta-analysis.
Table 1. Main characteristics of included studies.
| First author | Year | Country | Number | Gender (M/F) | Age (years) | Method | BMI (kg/m2) | Body weight (kg) | ||||||||
|---|---|---|---|---|---|---|---|---|---|---|---|---|---|---|---|---|
| Case | Control | Case | Control | Case | Control | Case | Control | Case | Control | |||||||
| Zheng (26) | 2013 | The Netherlands | 21 | 23 | 17/4 | 20/3 | 50.2±10.9 | 49.4±15.6 | ELISA | 23.0±4.3 | 24.8±3.6 | NR | NR | |||
| Yurt (27) | 2013 | Turkey | 29 | 21 | 21/8 | 10/11 | 47.7±6.7 | 47.5±5.1 | ELISA | 24.1±3.2 | 24.0±1.6 | 65.3±9.4 | 68.1±7.8 | |||
| Siddiqi (29) | 2012 | Japan | 24 | 28 | 23/1 | 19/9 | 37 [20–50] | 36 [21–52] | ELISA | NR | NR | NR | NR | |||
| Santucci (30) | 2011 | Argentina | 53 | 25 | 33/20 | 12/13 | 33 [24–51] | 34 [24–45] | ELISA | 20.7 [19.3–23.4] | 28.4 [24.4–31.9] | NR | NR | |||
| Herlina (5) | 2011 | Indonesia | 13 | 26 | 5/8 | 10/16 | NR | NR | ELISA | 11.7±1.0 | 15.9±1.3 | NR | NR | |||
| Kim (20) | 2010 | Korea | 23 | 23 | 13/10 | 12/11 | 44 [23–88] | 49 [22–78] | ELISA | 20.9±3.1 | 23.5±3.7 | 54.4±11.3 | 63.0±13.0 | |||
| Buyukoglan (21) | 2007 | Turkey | 25 | 18 | 19/6 | 10/8 | 36.0±14.7 | 34.2±12.9 | RIA | 19.4±2.6 | 24.2±3.6 | NR | NR | |||
| Buyukberber (32) | 2007 | Turkey | 12 | 20 | 5/7 | 10/10 | NR | NR | ELISA | 22.4 | 22.7 | NR | NR | |||
| Celik (22) | 2006 | Turkey | 17 | 28 | 17/0 | 20/8 | 31.0±17.5 | 62.3±14.0 | ELISA | 20.4±3.2 | 24.1±3.7 | 61.8±10.1 | 70.2±11.0 | |||
| Yüksel (28) | 2003 | Turkey | 25 | 25 | 18/7 | 16/9 | 47.5±15.4 | 44.6±13.8 | RIA | 22.1±4.3 | 27.3±3.9 | NR | NR | |||
| van Crevel (18) | 2002 | The Netherlands | 60 | 30 | 35/25 | 16/14 | 30 [23–40] | 23 [19–39] | ELISA | 16.8 [16.2–17.4] | 20.0 [19.0–21.0] | 42.2 [40.4–44.1] | 49.6 [47.2–52.0] | |||
| Cakir (31) | 1999 | Turkey | 30 | 25 | 22/8 | 17/8 | 38.3±17.2 | 40.1±13.3 | RIA | 20.2±1.6 | 25.2±2.7 | NR | NR | |||
M, male; F, female; ELISA, enzyme-linked immunosorbent assay; RIA, radioimmunoassay; NR, not reported; BMI, body mass index.
Figure 2.
The quality assessment of all eligible studies according to CASP scale. CASP, Critical Appraisal Skills Programme.
The main results of this meta-analysis
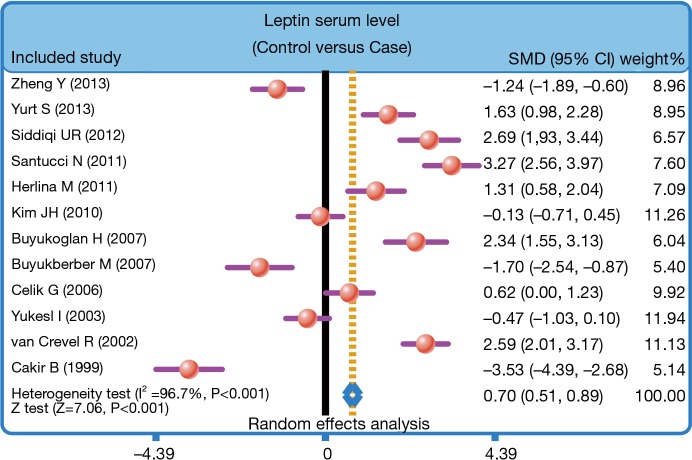
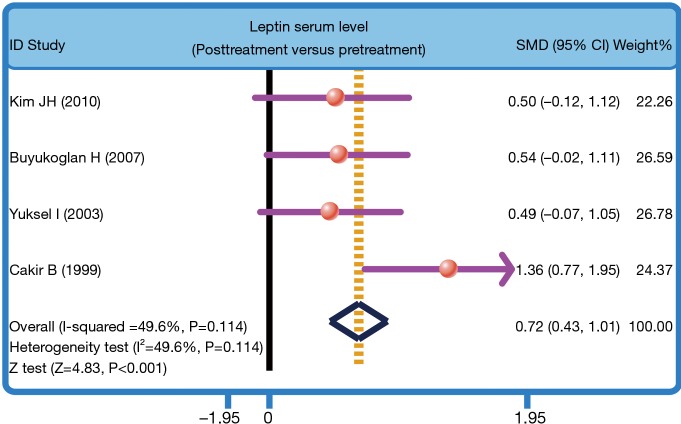
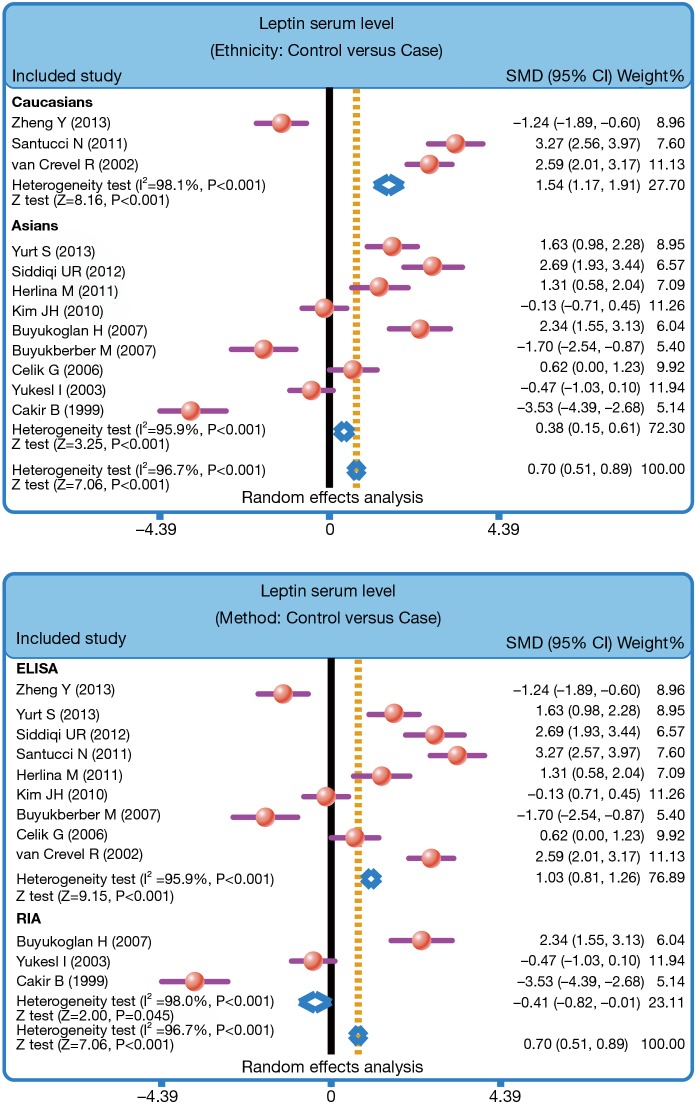
The heterogeneity was significantly observed (I2=96.7%, P<0.001); thereby the random effects model was carried out. The pooled estimate indicated that the serum leptin levels of healthy controls were markedly higher than those of PTB patients (SMD =0.70, 95% CI =0.51–0.89, P<0.001) (Figure 3). After treatment, PTB patients had elevated serum leptin levels (SMD =0.72, 95% CI =0.43–1.01, P<0.001) (Figure 4). Stratified analysis based on ethnicity presented that down-regulated serum leptin levels were significantly associated with the development of PTB among both Asians and Caucasians (Asians: SMD =0.38, 95% CI =0.15–0.61, P=0.001; Caucasians: SMD =1.54, 95% CI =1.17–1.91, P<0.001) (Figure 5). Further, subgroup analysis based on the detecting method showed that there was an association between the serum leptin levels and the development of PTB in both ELISA subgroup and RIA subgroup (ELISA: SMD =1.03, 95% CI =0.81–1.26, P<0.001; RIA: SMD =−0.41, 95% CI =−0.82 to −0.01, P=0.045) (Figure 5).
Figure 3.
Forest plot of the difference in serum leptin levels between pulmonary tuberculosis patients and healthy controls.
Figure 4.
Forest plot of the difference in serum leptin levels between post-treatment and pretreatment in pulmonary tuberculosis patients. SMD, standardized mean difference.
Figure 5.
Stratified analysis for the difference in serum leptin levels between pulmonary tuberculosis patients and healthy controls.
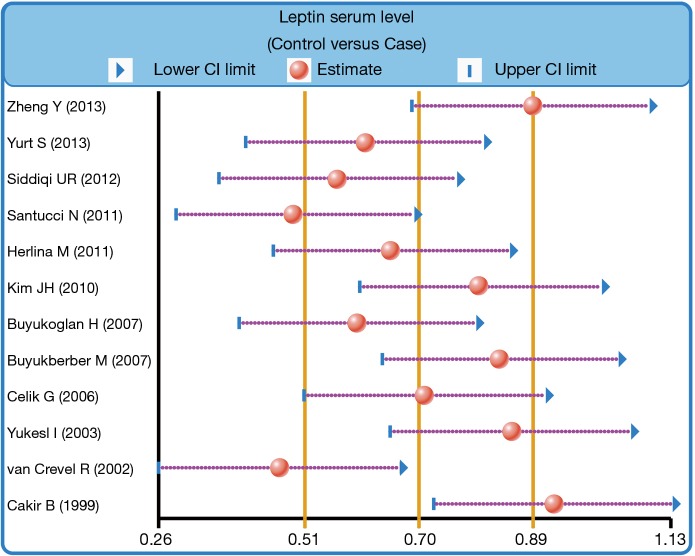
We further carried out sensitivity analysis to evaluate whether the review conclusions were influenced by the choice of an individual study. The finding indicated that no individual study obviously influenced the pooled SMDs in this meta-analysis (Figure 6). Publication bias on the differences of serum leptin levels between PTB patients and healthy controls was also conducted; the funnel plot paralleled a symmetrical, inverted funnel, suggesting the absence of the publication bias (Figure 7). Egger’s regression test also showed no statistical evidence of publication bias (t=−0.58, P=0.577).
Figure 6.
Sensitivity analysis for the difference in serum leptin levels between pulmonary tuberculosis patients and healthy controls.
Figure 7.
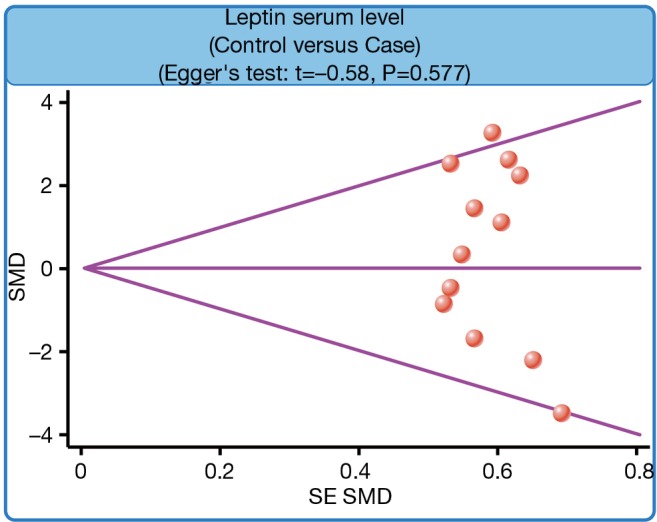
Funnel plot for the difference in serum leptin levels between pulmonary tuberculosis patients and healthy controls.
Discussion
PTB is highly common worldwide disease, and patient with PTB often suffers from the problems of anorexia and malnutrition. Leptin has been reported to be acted as a crucial role in the hormonal control of energy balance for human bodies (33). In the present meta-analysis, we aimed to investigate the associations of serum leptin levels with the pathogenesis of PTB. Our findings revealed that serum level of leptin was significantly lower in PTB patients as compared to the healthy controls, implying that down-regulated serum leptin levels may be implicated in the pathogenesis of PTB. Leptin is an important satiety factor which regulating the body weight by suppressing appetite and stimulating energy metabolism, and serum leptin levels in adipocytes may firmly relate to the proportion of body fat stores (34). Mainly produced by white adipose tissue, serum leptin levels were significantly associated with body fat mass as well as adipocyte size, and serum leptin levels were changed by nutritional status of individuals, decreasing with starvation and increasing with obesity (35). Further, down-regulated serum leptin levels might be one underlying mechanism of the loss of body weight which is induced by acute inflammatory conditions, and also the prolonged inflammation may further restrain the production of leptin (27). As we all known, patients with PTB often suffer from severe weight loss, probably caused by the production of inflammatory mediators in PTB development (26). And also, massive production of inflammatory mediators may lead to the suppression of leptin production in the progression of PTB (36). In this regard, it is reasonably suspected that the patients with tuberculosis infection may be associated with down-regulated serum concentrations of leptin. Santucci et al. have demonstrated that there was a positively correlation between the body mass index and serum leptin levels in PTB patients, and the leptin serum level was decreased with the increasing disease severity of PTB (30). Herlina and his colleagues have found that the PTB patients had lower body mass index and down-regulated circulating leptin levels as compared to the healthy adults, and indicated that down-regulated leptin levels due to the loss of body weight may lead to the reduction of leptin production, which may be correlated with the progression of PTB (5). Yurt et al. have also proved that PTB patients were related to lower leptin levels and also implied that a catabolic/anabolic imbalance may be associated with the down-regulated leptin levels which may induce the development of PTB (27). In this study, we propose that the down-regulated serum leptin levels may be connected with the development of PTB, which corroborates with the results of previous studies on adult PTB development.
We also performed stratified analyses on the basis of ethnicity in order to explore the influence of potential factors on the correlations between serum leptin levels and PTB. Our results showed that lower serum leptin levels were significantly correlated with PTB development among Caucasians and Asian, suggesting that ethnicity differences may not be the potential heterogeneity resource of this outcome. Further, subgroups analysis based on the detecting method showed that there was an association between the serum leptin levels and the progression of PTB in both ELISA subgroup and RIA subgroup. Generally, our results are in line with previous studies and documents that serum leptin levels were significantly down-regulated in PTB patients, revealing that lower serum leptin levels may be associated with in the pathology process of PTB and the occurrence of malnutrition, and may be utilized as a potential biomarker of the nutritional state of PTB patients, and assess the clinical treatment response to patients with PTB.
In conclusion, our present findings suggest that decreased serum leptin levels may be associated with the pathogenesis of PTB. Consequently, serum leptin level could be a key and valuable biomarker for predicting the development and progression of PTB. Nevertheless, due to the small sample size of this study, more researches with larger sample size and more comprehensive data are necessary for the acquirement of a statistical analysis with general applicability.
Acknowledgements
We would like to give our sincere appreciation to the reviewers for their helpful comments on this article.
Footnotes
Conflicts of Interest: The authors have no conflicts of interest to declare.
References
- 1.Van TT, Farrar J. Tuberculous meningitis. J Epidemiol Community Health 2014;68:195-6. 10.1136/jech-2013-202525 [DOI] [PubMed] [Google Scholar]
- 2.Roetzer A, Diel R, Kohl TA, et al. Whole genome sequencing versus traditional genotyping for investigation of a Mycobacterium tuberculosis outbreak: a longitudinal molecular epidemiological study. PLoS Med 2013;10:e1001387. 10.1371/journal.pmed.1001387 [DOI] [PMC free article] [PubMed] [Google Scholar]
- 3.Hunter RL. Pathology of post primary tuberculosis of the lung: an illustrated critical review. Tuberculosis (Edinb) 2011;91:497-509. 10.1016/j.tube.2011.03.007 [DOI] [PMC free article] [PubMed] [Google Scholar]
- 4.Lönnroth K, Corbett E, Golub J, et al. Systematic screening for active tuberculosis: rationale, definitions and key considerations. Int J Tuberc Lung Dis 2013;17:289-98. 10.5588/ijtld.12.0797 [DOI] [PubMed] [Google Scholar]
- 5.Herlina M, Nataprawira HM, Garna H. Association of serum C-reactive protein and leptin levels with wasting in childhood tuberculosis. Singapore Med J 2011;52:446-50. [PubMed] [Google Scholar]
- 6.Chakaya J, Raviglione M. Quality tuberculosis care. All should adopt the new international standards for tuberculosis care. Ann Am Thorac Soc 2014;11:397-8. 10.1513/AnnalsATS.201401-014ED [DOI] [PubMed] [Google Scholar]
- 7.Shrivastava SR, Shrivastava PS, Ramasamy J. Fostering directly observed treatment in tuberculosis: a program manager's perspective. Int J Health Policy Manag 2013;2:51-2. 10.15171/ijhpm.2014.11 [DOI] [PMC free article] [PubMed] [Google Scholar]
- 8.Srivastava S, Peloquin CA, Sotgiu G, et al. Therapeutic drug management: is it the future of multidrug-resistant tuberculosis treatment? Eur Respir J 2013;42:1449-53. 10.1183/09031936.00073213 [DOI] [PubMed] [Google Scholar]
- 9.Millet JP, Moreno A, Fina L, et al. Factors that influence current tuberculosis epidemiology. Eur Spine J 2013;22 Suppl 4:539-48. 10.1007/s00586-012-2334-8 [DOI] [PMC free article] [PubMed] [Google Scholar]
- 10.Glaziou P, Falzon D, Floyd K, et al. Global epidemiology of tuberculosis. Semin Respir Crit Care Med 2013;34:3-16. 10.1055/s-0032-1333467 [DOI] [PubMed] [Google Scholar]
- 11.Stein CM. Genetic epidemiology of tuberculosis susceptibility: impact of study design. PLoS Pathog 2011;7:e1001189. 10.1371/journal.ppat.1001189 [DOI] [PMC free article] [PubMed] [Google Scholar]
- 12.Bonacci RA, Cruz-Hervert LP, Garcia-Garcia L, et al. Impact of cigarette smoking on rates and clinical prognosis of pulmonary tuberculosis in Southern Mexico. J Infect 2013;66:303-12. 10.1016/j.jinf.2012.09.005 [DOI] [PMC free article] [PubMed] [Google Scholar]
- 13.O'Connell R, Chishinga N, Kinyanda E, et al. Prevalence and correlates of alcohol dependence disorder among TB and HIV infected patients in Zambia. PLoS One 2013;8:e74406. 10.1371/journal.pone.0074406 [DOI] [PMC free article] [PubMed] [Google Scholar]
- 14.Ahima RS, Flier JS. Leptin. Annu Rev Physiol 2000;62:413-37. 10.1146/annurev.physiol.62.1.413 [DOI] [PubMed] [Google Scholar]
- 15.Zieba DA, Amstalden M, Williams GL. Regulatory roles of leptin in reproduction and metabolism: a comparative review. Domest Anim Endocrinol 2005;29:166-85. 10.1016/j.domaniend.2005.02.019 [DOI] [PubMed] [Google Scholar]
- 16.Farooqi IS, O'Rahilly S. Leptin: a pivotal regulator of human energy homeostasis. Am J Clin Nutr 2009;89:980S-4S. 10.3945/ajcn.2008.26788C [DOI] [PubMed] [Google Scholar]
- 17.Maciver NJ, Jacobs SR, Wieman HL, et al. Glucose metabolism in lymphocytes is a regulated process with significant effects on immune cell function and survival. J Leukoc Biol 2008;84:949-57. 10.1189/jlb.0108024 [DOI] [PMC free article] [PubMed] [Google Scholar]
- 18.van Crevel R, Karyadi E, Netea MG, et al. Decreased plasma leptin concentrations in tuberculosis patients are associated with wasting and inflammation. J Clin Endocrinol Metab 2002;87:758-63. 10.1210/jcem.87.2.8228 [DOI] [PubMed] [Google Scholar]
- 19.Chan ED, Iseman MD. Slender, older women appear to be more susceptible to nontuberculous mycobacterial lung disease. Gend Med 2010;7:5-18. 10.1016/j.genm.2010.01.005 [DOI] [PubMed] [Google Scholar]
- 20.Kim JH, Lee CT, Yoon HI, et al. Relation of ghrelin, leptin and inflammatory markers to nutritional status in active pulmonary tuberculosis. Clin Nutr 2010;29:512-8. 10.1016/j.clnu.2010.01.008 [DOI] [PubMed] [Google Scholar]
- 21.Buyukoglan H, Gulmez I, Kelestimur F, et al. Leptin levels in various manifestations of pulmonary tuberculosis. Mediators Inflamm 2007;2007:64859. 10.1155/2007/64859 [DOI] [PMC free article] [PubMed] [Google Scholar]
- 22.Celik G, Kaya A, Poyraz B, et al. Diagnostic value of leptin in tuberculous pleural effusions. Int J Clin Pract 2006;60:1437-42. 10.1111/j.1742-1241.2006.00831.x [DOI] [PubMed] [Google Scholar]
- 23.Jackson D, White IR, Riley RD. Quantifying the impact of between-study heterogeneity in multivariate meta-analyses. Stat Med 2012;31:3805-20. 10.1002/sim.5453 [DOI] [PMC free article] [PubMed] [Google Scholar]
- 24.Peters JL, Sutton AJ, Jones DR, et al. Comparison of two methods to detect publication bias in meta-analysis. JAMA 2006;295:676-80. 10.1001/jama.295.6.676 [DOI] [PubMed] [Google Scholar]
- 25.Zintzaras E, Ioannidis JP. HEGESMA: genome search meta-analysis and heterogeneity testing. Bioinformatics 2005;21:3672-3. 10.1093/bioinformatics/bti536 [DOI] [PubMed] [Google Scholar]
- 26.Zheng Y, Ma A, Wang Q, et al. Relation of leptin, ghrelin and inflammatory cytokines with body mass index in pulmonary tuberculosis patients with and without type 2 diabetes mellitus. PLoS One 2013;8:e80122. 10.1371/journal.pone.0080122 [DOI] [PMC free article] [PubMed] [Google Scholar]
- 27.Yurt S, Erman H, Korkmaz GG, et al. The role of feed regulating peptides on weight loss in patients with pulmonary tuberculosis. Clin Biochem 2013;46:40-4. 10.1016/j.clinbiochem.2012.09.008 [DOI] [PubMed] [Google Scholar]
- 28.Yüksel I, Sencan M, Dokmetas HS, et al. The relation between serum leptin levels and body fat mass in patients with active lung tuberculosis. Endocr Res 2003;29:257-64. 10.1081/ERC-120025033 [DOI] [PubMed] [Google Scholar]
- 29.Siddiqi UR, Punpunich W, Chuchottaworn C, et al. Elevated anti-tuberculous glycolipid antibody titres in healthy adults and tuberculosis patients in Thailand. Int J Tuberc Lung Dis 2012;16:532-8. 10.5588/ijtld.10.0764 [DOI] [PubMed] [Google Scholar]
- 30.Santucci N, D'Attilio L, Kovalevski L, et al. A multifaceted analysis of immune-endocrine-metabolic alterations in patients with pulmonary tuberculosis. PLoS One 2011;6:e26363. 10.1371/journal.pone.0026363 [DOI] [PMC free article] [PubMed] [Google Scholar]
- 31.Cakir B, Yonem A, Guler S, et al. Relation of leptin and tumor necrosis factor alpha to body weight changes in patients with pulmonary tuberculosis. Horm Res 1999;52:279-83. [DOI] [PubMed] [Google Scholar]
- 32.Buyukberber M, Koruk M, Savas MC, et al. Leptin levels in the differential diagnosis between benign and malignant ascites. World J Gastroenterol 2007;13:398-402. 10.3748/wjg.v13.i3.398 [DOI] [PMC free article] [PubMed] [Google Scholar]
- 33.Davis JF, Choi DL, Schurdak JD, et al. Leptin regulates energy balance and motivation through action at distinct neural circuits. Biol Psychiatry 2011;69:668-74. 10.1016/j.biopsych.2010.08.028 [DOI] [PMC free article] [PubMed] [Google Scholar]
- 34.Stofkova A. Leptin and adiponectin: from energy and metabolic dysbalance to inflammation and autoimmunity. Endocr Regul 2009;43:157-68. [PubMed] [Google Scholar]
- 35.Keicho N, Matsushita I, Tanaka T, et al. Circulating levels of adiponectin, leptin, fetuin-A and retinol-binding protein in patients with tuberculosis: markers of metabolism and inflammation. PLoS One 2012;7:e38703. 10.1371/journal.pone.0038703 [DOI] [PMC free article] [PubMed] [Google Scholar]
- 36.Iikuni N, Lam QL, Lu L, et al. Leptin and Inflammation. Curr Immunol Rev 2008;4:70-9. 10.2174/157339508784325046 [DOI] [PMC free article] [PubMed] [Google Scholar]


