

ABSTRACT
Urinary tract infections (UTIs) are a major infection of humans, particularly affecting women. Recurrent UTIs can cause significant discomfort and expose patients to high levels of antibiotic use, which in turn contributes to the development of higher antibiotic resistance rates. Most UTIs are caused by uropathogenic Escherichia coli, which is able to form intracellular collections (termed intracellular bacterial communities [IBCs]) within the epithelial cells lining the bladder lumen. IBCs are seen in both infected mice and humans and are a potential cause of recurrent UTI. Genetic and molecular studies of IBCs have been hampered both by the low number of bacteria in IBCs relative to the number extracellular bacteria and by population bottlenecks that occur during IBC formation. We now report the development of a simple and rapid technique for isolating pure IBCs from experimentally infected mice. We verified the specificity and purity of the isolated IBCs via microscopy, gene expression, and culture-based methods. Our results further demonstrated that our isolation technique practically enables specific molecular studies of IBCs. In the first such direct measurement, we determined that a single epithelial cell containing an early IBC typically contains 103 viable bacteria. Our isolation technique complements recent progress in low-input, single-cell genomics to enable future genomic studies of the formation of IBCs and their activation pathways during recurrent UTI, which may lead to novel strategies to eliminate them from the bladder.
KEYWORDS: intracellular bacterial communities, urinary tract infection, uropathogenic Escherichia coli
INTRODUCTION
Urinary tract infections (UTIs) are very common infections in humans, affecting over half of all women (1). UTIs can affect any part of the urinary tract but are most commonly found in the bladder (an infection more specifically termed cystitis). Infections are most frequently caused by some strains of Escherichia coli (thus uropathogenic E. coli [UPEC]) (2). While antibiotic treatment is effective in most patients, 25% of patients experience recurrent infection, often with the same strain, within 6 months (3). A smaller fraction (approximately 3%) of patients suffers chronically from recurrent UTIs, which in some cases can last many years (4–6). The high number of UTIs overall, in addition to the high intensity of antibiotic treatment for those suffering from chronic recurrent UTI, accounts for a significant fraction of antibiotic prescriptions in the community, further leading to potential public health concerns with respect to driving higher antibiotic resistance rates (7, 8).
Much research has therefore been dedicated to understanding the mechanisms by which UPEC causes UTI and in particular how it cause recurrent UTI. A mouse model of infection has been widely used to understand both host and bacterial characteristics leading to disease (9, 10). Of note, this murine model enables direct studies of bacterial strains, without modification, isolated from human patients, assaying infection through an analogous ascending inoculation route into the same organ and resulting in host immune responses that are generally similar to those seen in humans (11, 12). Using this model, intracellular infection of bladder epithelial cells by UPEC has been proposed as a hypothesis that can explain many features of human recurrent UTI (8, 13). UPEC binds to glycosylated surface proteins (uroplakins) present on the intact bladder epithelium using extracellular type 1 fimbriae (14–25). This binding leads to invasion of the epithelial cell, from which UPEC can escape into the cytoplasm and proliferate to form large, dense, intracellular aggregates of bacteria termed intracellular bacterial communities (IBCs). IBCs are estimated to contain up to 106 bacteria each and have been described as a type of intracellular biofilm (13, 26, 27). Each IBC is the progeny of a single invasive founder, enabling high amplification of successful invasion events (28). IBCs are resistant to antibiotic treatment and host clearance, leading to persistence and subsequent reemergence to cause subsequent rounds of infection and IBC formation (16, 18, 29). Upon bacterial emergence (“fluxing”) from the enclosing epithelial cell, the host immune response induces the SOS response in UPEC, leading to the inhibition of cell division and the formation of long filaments, which resist killing by host neutrophils (18, 27, 30, 31).
Besides IBCs, UPEC can form at least one other distinct type of intracellular structure, the quiescent intracellular reservoir (QIR). QIRs are small collections of UPEC bacteria (up to 12 bacteria) that are very slowly (or not) growing and present within membrane-bound LAMP1+ (lysosomal-associated membrane protein 1) vesicles. QIRs are known to persist for weeks to months and can also subsequently reactivate to cause recurrent UTI (32). Research from the murine model of UTI argues that intracellular infections (both IBCs and QIRs) are mechanistically plausible pathways for chronic recurrent UTI despite appropriate antibiotic usage and an intact host immune system (13).
Are intracellular bacteria important for UTI in humans? Structures that are morphologically indistinguishable from IBCs generated in experimental mouse infections have been observed in the urine sediment of acutely infected humans, based on extensive histological, microscopic, and ultrastructural characterization, in addition to the recapitulation of IBC formation by the human-infecting strain in an experimental murine UTI model (33). Several additional studies of intracellular bacteria in both pediatric and adult UTI patients have been reported (34–36). Other studies of same-strain versus different-strain recurrence of UTI in humans have shown that some patients suffer from multiple recurrences caused by indistinguishable strains (for example, see references 37–40), consistent with IBCs being a contributor to recurrent UTI (41). However, intracellular bacteria are not specifically targeted by any current therapies. Basic research in the service of finding new mechanistic pathways to target for UTI prevention and treatment has focused on individual host and bacterial pathways but has had a limited ability to directly probe intracellular populations using high-throughput molecular assays. For example, single-gene studies have identified genetic requirements for IBC formation (for examples, see references 11, 13, 42–44, and 45), and microscopic studies have demonstrated the presence of a polysaccharide matrix and the expression of capsule, antigen 43, and type 1 pili within IBCs (26, 46, 47). Unfortunately, direct molecular studies of IBCs have been complicated by the fact that intracellular bacteria can be a minority of the total bacterial population during acute stages of infection (16), while high-throughput genetic approaches have been hampered by the strong population bottleneck imposed by IBC formation (28, 48).
Recent advances in genomics have led to several applications of genome-wide transcriptional profiling of bacteria in infected mouse bladder tissue and urine as well as in infected human urine (49–53). Those studies have all performed analyses on the bulk infecting population, including both intracellular and extracellular bacteria. One notable study used laser capture microdissection to directly isolate RNA from IBCs from frozen tissue sections (54). That study found that bacteria within IBCs had high expression levels of iron acquisition systems, which is consistent with the known host response to limit iron availability to infecting bacteria; however, iron starvation is also a feature of extracellular bacteria present in urine (50, 51, 55) and is therefore not specific to IBCs. That laser capture study also showed that bacteria within IBCs are under aerobic conditions based on the relative expression levels of two genes, cyoB and frdA; in contrast, bacteria in human and mouse urine generally do not utilize aerobic metabolism (49, 50, 54, 56). However, the authors of that study were unable to obtain enough RNA to perform genome-wide studies of bacterial gene expression. Furthermore, this technique requires specialized laser capture microdissection equipment, making it technically demanding and laborious.
To facilitate the study of intracellular stages of UTI, we developed a simple and rapid method for the isolation of individual infected bladder epithelial cells from laboratory mice. This technique requires a dissecting microscope capable of fluorescence imaging and less than US$50 of standard laboratory materials. We are able to isolate hundreds of IBCs in a single session using our micropipetting technique. The isolated cells carry bona fide IBCs containing viable bacteria based on morphology, gene expression, and culture. In the first such direct measurement, we demonstrate that early IBCs (6 h postinfection [hpi]) typically contain approximately 103 bacteria. This technique is applicable to any mouse strain and most UPEC strains and therefore should facilitate further molecular and genomic studies of intracellular stages of UTI.
RESULTS
Traditional micropipetting can be used to isolate IBCs.
Micropipetting with glass capillaries has been used to isolate single eukaryotic cells for several decades (57–59). While the size of superficial bladder epithelial cells (50 to 120 μm) (60) precludes their isolation from fluorescence-activated cell sorter (FACS) machines (typical nylon filters for FACS analysis exclude particles larger than 40 to 50 μm), the larger size should actually be a benefit for manual isolation. We performed transurethral infection of the bladders of 7- to 9-week-old female C57BL/6 mice using UTI89 (a cystitis isolate) expressing vsfGFP (v-superfolder green fluorescent protein) (61, 62). At 6 hpi, when IBC numbers are typically maximal (13, 27, 28, 53, 63), mice were sacrificed and their bladders were aseptically removed (Fig. 1A). IBCs form in the epithelial cells lining the luminal surface of the bladder; therefore, inversion of the bladder enabled direct visualization of GFP-expressing IBCs under a fluorescence dissecting microscope (Fig. 1B). IBCs, along with uninfected epithelial cells and other cells in the bladder, were then released by gentle scraping with forceps (Fig. 1C). With this suspension of cells, standard micropipetting using hand-pulled glass capillaries was used to isolate individual GFP-positive epithelial cells (Fig. 1D).
FIG 1.
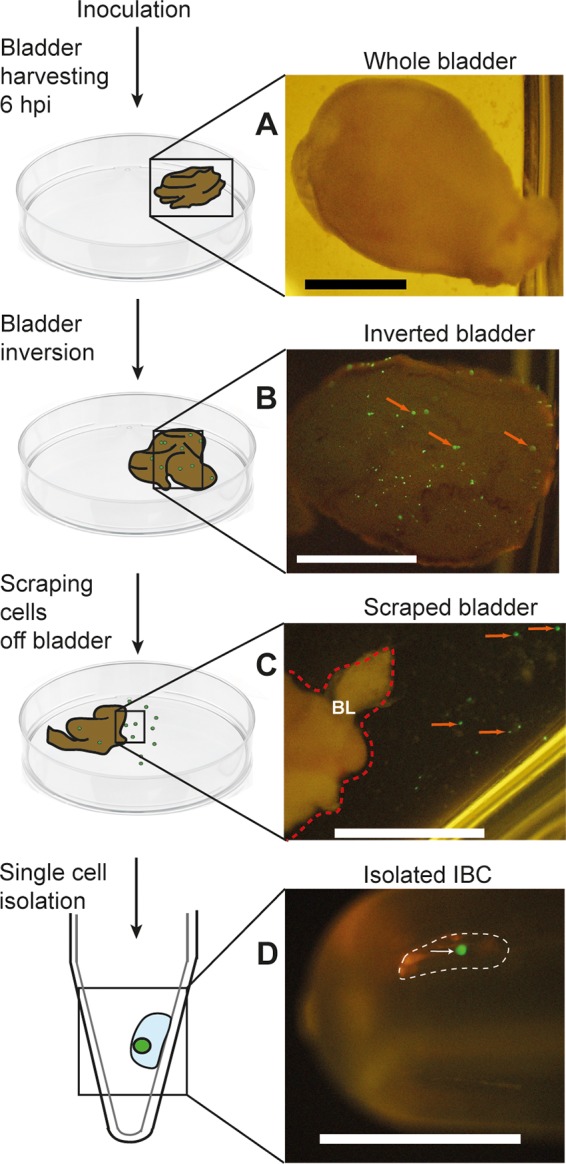
Schematic diagrams and associated photographs of the steps involved in micropipetting individual IBCs from infected mouse bladders. Shown are a harvested whole bladder (A), an inverted whole bladder exposing GFP-expressing IBCs (B), a closeup of the edge of a scraped bladder showing individual IBCs in suspension in the adjacent buffer (C), and a single isolated IBC pipetted into a tube (D). Red arrows in panel B indicate examples of GFP-positive IBCs on the luminal surface of the bladder. The red dotted line in panel C indicates the right border of the inverted bladder (indicated as “BL”); red arrows in panel C indicate apparently individual GFP-positive epithelial cells that have been scraped off the bladder surface. The white dotted line in panel D indicates a micropipetted submicroliter droplet containing an isolated IBC, which is indicated by a white arrow. Bars, 2 mm.
We first verified by microscopy that the expected cell populations were present among the scraped cells. As shown in Fig. 2A, the total scraped cell population contained cells of various sizes, ranging from 10 to 150 μm in diameter. The larger cells stained with an antiuroplakin antibody, and many appeared to have multiple nuclei (Fig. 2A, white arrows), as expected for superficial bladder epithelial cells. There were also smaller cells (∼20 μm) (Fig. 2A, green arrows) that stained positively for uroplakin and were likely underlying transitional epithelial cells. Among the uroplakin-positive cells, some were also seen to stain with an anti-E. coli antibody (Fig. 2A, yellow arrows). Besides epithelial cells, we expected that, based on previous studies, some immune cells might also be present; these cells should stain for CD45. However, in many of our samples, we saw very few cells staining positively for CD45. We first verified that our CD45 staining protocol was able to stain both RAW macrophage cells (see Fig. S1 in the supplemental material) as well as immune cells isolated from the bone marrow (BM) of infected mice (Fig. S2). We also verified that CD45 staining was not somehow inhibited in the context of the scraped cells by staining a mixed sample of scraped bladder cells and bone marrow-derived immune cells (Fig. S3). As additional controls, we also verified that our anti-E. coli and antiuroplakin stainings were specific for E. coli and bladder cells, respectively, by staining cultured RAW cells, bone marrow aspirates, scraped bladder cells (Fig. S4), and in vitro-cultured E. coli (data not shown). Based on these controls, we concluded that the scraped bladder samples indeed had very few immune cells. The relative paucity of immune cells is perhaps partially because they are eliminated when the urine of sacrificed mice is expressed with gentle pressure prior to euthanasia and partially because, at 6 hpi, immune cells such as neutrophils are only beginning to enter the bladder and its lumen (27).
FIG 2.

Confocal microscopy of IBC-containing cells. (A and B) Images of scraped bladder cells (unpurified, prior to micropipetting) stained with antiuroplakin and anti-E. coli antibodies (A) and with anti-CD45 and anti-E. coli antibodies (B). White arrows indicate superficial epithelial cells containing two nuclei, green arrows indicate transitional epithelial cells with single nuclei, yellow arrows indicate E. coli-containing cells, and red arrows indicate immune cells. (C and D) Images of individual micropipetted GFP-positive cells stained with antiuroplakin and anti-E. coli antibodies (C) and with anti-CD45 and anti-E. coli antibodies (D). Low-magnification images of individual channels are shown on the left, with high-magnification merged images on the right. Bars are indicated in the merged images. DNA is stained with DAPI and represented in the blue channel. Anti-E. coli is stained with a secondary antibody conjugated to fluorescein isothiocyanate and represented in the green channel. Antiuroplakin (A and C) and anti-CD45 (B and D) are stained with a secondary antibody conjugated to tetramethylrhodamine isothiocyanate (TRITC) and represented in the red channel.
We then characterized the putative IBCs isolated by micropipetting. We found that GFP-positive cells all stained with antiuroplakin and anti-E. coli, as expected (a representative image is shown in Fig. 2B). Isolated cells that were positive for E. coli staining were uniformly negative for CD45 staining and often contained more than one nucleus (Fig. 2C). From these staining experiments, we estimated that our putative isolated IBCs were >90% pure (i.e., 2/24 [8%] 4′,6-diamidino-2-phenylindole [DAPI]- or uroplakin-positive cells had no E. coli staining).
Isolated IBCs contain aerobic UPEC.
The primary goal of IBC isolation is to be able to perform downstream, intracellular niche-specific studies, including gene expression in particular. One potential issue is that gene expression can change within minutes (64–66). Our isolation procedure takes approximately 10 min from mouse sacrifice to the collection of the first IBC; this time is comparable with practical limits on how soon human urine, for example, can be preserved for transcriptional studies (50, 52). However, our isolation procedure results in the exposure of the bladder lumen to ambient temperature, atmospheric oxygen, phosphate-buffered saline (PBS), and physical shear forces from scraping with forceps. To provide some assurance that these conditions do not drastically alter gene expression in the time frame required for isolation, we examined the expression levels of the cyoB (cytochrome oxidase B) and frdA (fumarate reductase subunit A) genes, both of which were previously quantified specifically in IBCs (54).
We anticipated that an individual isolated IBC would contain a small amount of bacterial mRNA. We therefore first characterized the sensitivity of our quantitative reverse transcription-PCR (qRT-PCR) assays using serial dilutions of UTI89 genomic DNA (see Fig. S5 in the supplemental material). Based on results from negative-control samples and examinations of amplification curves and melting temperatures, we determined that our qRT-PCR assays were reliable for CT (threshold cycle) values below 30 for the 16S gene and below 34 for the cyoB and frdA genes. To further ensure reliable quantification, for all subsequent experiments, we considered samples to have detectable gene expression only if the CT values were below these thresholds, the melting temperatures were identical to those of the corresponding positive controls, and the amplification curves passed manual screening for quality (based on the baseline, curve shape, and fluorescence intensity range).
We next replicated previously reported results showing that cyoB and frdA expression levels can differentiate between E. coli bacteria cultured in vitro under aerobic conditions and those cultured under anaerobic conditions (Fig. 3). We obtained CT values of <30 for all qRT-PCR targets for these in vitro mRNA samples (Fig. S6). We indeed saw that the expression level (expressed as a fold change normalized against the last [stationary-phase] anaerobic sample, labeled “An3”) of cyoB (>100-fold) was much higher than that of frdA (approximately 10-fold) under aerobic conditions for the first two time points, while the cyoB expression level (<10-fold) was lower than that of frdA (10- to 100-fold) under anaerobic conditions for the first two time points. These results closely mirrored previously reported results (54).
FIG 3.
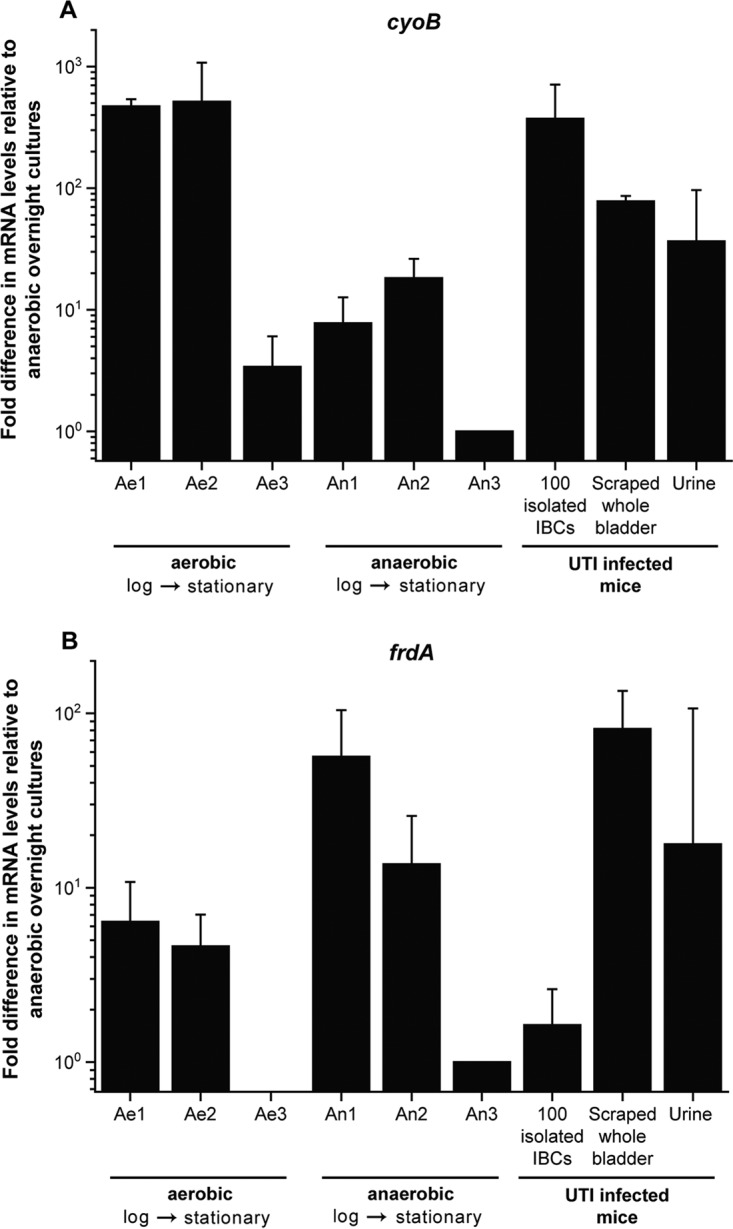
qRT-PCR expression profiles of cyoB and frdA in bacterial UTI89 cultures grown aerobically (Ae1 to Ae3) and anaerobically (An1 to An3), 100 isolated IBCs, cells scraped from whole bladder, and urine from mice with UTI. The expression level of each gene is normalized against the last (stationary-phase) anaerobic sample, labeled “An3.” The RNA samples for the in vitro cultures were extracted at an OD600 of 0.5 (Ae1 and An1), at an OD600 of 0.9 (Ae2 and An2), and at the overnight time point (OD600 of >2) (Ae3 and An3), for 100 isolated IBCs from 100 individually isolated and pooled IBCs, unpurified cells scraped from a UTI-infected inverted whole bladder, and urine from ∼200 μl of pooled urine collected at 6 hpi, prior to sacrifice. Error bars represent standard deviations from 4 independent experiments for aerobic (Ae1 to Ae3) and anaerobic (An1 to An3) bacterial cultures and 100 isolated IBCs and from 3 sets of independent experiments for scraped whole bladder and urine.
We then tested our ability to detect mRNA expression in isolated IBCs. We performed the same qRT-PCR assays on samples containing 5 to 100 individually isolated, pooled IBCs (Fig. S7). Based on CT, melting temperature, and amplification curve analyses, we saw detectable amounts of 16S, cyoB, and frdA RNAs even in samples containing only 5 isolated and pooled IBCs. We further verified the specificity of our qRT-PCR assay by testing 100 isolated and pooled IBCs, unpurified cells scraped from an infected bladder, and urine from infected mice, collected just prior to sacrifice (Fig. 3). We also tested a series of samples that should not contain bacteria: 100 pooled GFP-negative epithelial cells isolated from the bladders of the same infected mice, unpurified cells scraped from PBS-treated, mock-infected bladders, and urine from mice, collected prior to infection (Fig. S8). As expected, all of the samples containing bacteria gave detectable levels of 16S, cyoB, and frdA RNAs, while all of the samples that should not contain bacteria had CT values above our previously determined cutoff, in addition to different melting temperatures.
Finally, we compared the relative expression levels of cyoB and frdA in isolated IBCs to those in in vitro-cultured aerobic and anaerobic bacteria. We verified that only the sample containing isolated IBCs appeared to be aerobic, with high normalized cyoB (>100-fold) and low frdA (<10-fold) expression levels, while bulk scraped infected bladders and urine from infected bladders showed an expression pattern more similar to that of anaerobically grown E. coli (Fig. 3).
Direct quantification of bacteria within single IBCs.
Previous estimates of the number of bacteria within individual IBCs were made by using volume calculations based on IBC size, as measured microscopically (30). With our isolation technique, we can now directly measure the number of viable bacteria per IBC. The determination of titers in serial dilutions of individual IBCs led to a wide range (∼3 logs) of values for bacterial quantification, with a median value of 2.2 ± 0.91 log10 CFU/IBC (Fig. 4A).
FIG 4.

CFU and qPCR validation of successful isolation of IBCs. (A) Enumeration of bacterial CFU in individually isolated IBCs processed immediately or after 10 or 30 min of incubation in 0.1% Triton X. Data are combined for IBCs isolated from 3 separate experiments. The limit of detection was 0.7 log10 CFU/IBC. Red dots plotted at the limit of detection indicate samples for which no colonies were recovered. All IBC-containing samples are not significantly different (P > 0.05 by a Mann-Whitney test); the data for uninfected epithelial cells are significantly different from the IBC (10 min) data (P < 0.001 by a Mann-Whitney test). (B) Comparison of bacterial quantification using titer determination for bacterial cultures versus qPCR for genome equivalents with or without 10 min of incubation in 0.1% Triton X. Lines connect data for the same sample. There is no significant difference between the groups (P > 0.4 by a Wilcoxon signed-rank test). (C) Comparison of bacterial titers measured in urine of infected mice at 6 hpi with and without incubation for 10 min in 0.1% Triton X. Each point represents data for a sample of pooled urine from 5 mice; data are combined across 3 separate experiments. Lines connect data for the same sample. The limit of detection was 2 log10 CFU/ml of urine. There is no significant difference between the groups (P > 0.5 by a Wilcoxon signed-rank test). (D) Quantification of bacteria using qPCR on individual IBCs and uninfected epithelial cells following a 10-min incubation in 0.1% Triton X (*, P < 0.0001 by a Mann-Whitney test; n = 4). The limit of detection is 1.18 log10 bacterial genome equivalents/IBC. Red dots indicate samples for which no colonies were recovered upon titer determination in panel A.
Since their identification, IBCs have been described as biofilm-like structures; one possibility for the wide variation in IBC titers is that bacteria tend to remain stuck to each other (due to being enclosed within an epithelial cell membrane or within a biofilm-like matrix) during serial dilutions. To explore this, we first incubated individual isolated IBCs in PBS with 0.1% Triton X (to lyse the enclosing epithelial cell) for 10 or 30 min. We indeed saw a slight decrease in variability between IBCs but no significant change in the median (2.5 ± 0.83 log10 CFU/IBC after 10 min and 2.3 ± 0.6 log10 CFU/IBC after 30 min) (Fig. 4A). Importantly, Triton treatment had no effect on bacterial viability for cells cultured in vitro (Fig. 4B) or for bacteria isolated from the urine of infected mice (Fig. 4C). Furthermore, uninfected epithelial cells isolated from the same infected mouse bladders and treated for 10 min with Triton X nearly always (29/32 isolated cells [91%]) had CFU at the limit of detection (Fig. 4A, right lane).
As an alternative test that should not be affected by a potential biofilm matrix, we performed quantitative PCR (qPCR) to quantify bacterial genomic DNA from aliquots of the same serial dilutions that we used determine titers in individual IBCs (Fig. 4D). We again found high inter-IBC variation (range, >2.5 logs). The median number of bacteria (measured as log10 genome equivalents [GE]) was 3.04 ± 0.5 log10 GE/IBC, about 3 to 6 times higher than the values obtained by the direct determination of titers. A similar assay on isolated uninfected epithelial cells gave consistently low numbers (1.18 ± 0.3 log10 GE/IBC). These results further validated that we were able to reliably isolate both IBC-containing and uninfected epithelial cells. These findings also argue that extracellular bacteria attached to epithelial cells are a quantitatively small if not negligible problem (most values for uninfected epithelial cells are at the limit of detection). Finally, the higher values obtained by qPCR for genome equivalents could indicate either that some nonviable cells or viable but nonculturable cells are present in IBCs or that bacteria in IBCs indeed tend to stay aggregated despite the lysis of their enclosing epithelial cell and incubation in PBS, perhaps due to the enclosing biofilm matrix.
DISCUSSION
We have developed a simple and direct method for isolating infected bladder epithelial cells seen during acute experimental UTI. Gene expression levels within isolated IBCs match previously reported data, arguing that experimental manipulation, to the extent that we can currently measure, has no gross effect on this population. Our procedure can be applied to any mouse strain and any IBC-producing UPEC strain and in principle can be performed at any time point during infection. The primary limitation is the requirement for a fluorescent marker to aid in the identification of infected cells, which precludes the direct application of our technique to human infections. However, for studies of experimental infections, recently improved tools for engineering fluorescent UPEC strains provide high brightness with no measurable defects in infection phenotypes (61, 67), which would complement this isolation technique.
IBCs and other intracellular bacteria have been hypothesized to be the key populations contributing to UPEC persistence and UTI recurrence in humans, based on data from extensive studies in mouse infection models (13, 16, 26–28, 53) and a growing number of morphological studies in humans (33–36). Substantial effort has been expended on investigating the mechanism by which UPEC establishes, maintains, and emerges from these reservoirs. Recently, dramatic improvements in genomics techniques have led to direct genomics studies of acute UTI (42, 51, 52). The formation of IBCs and other intracellular structures, however, presents unique challenges to standard genetic and genomic approaches; two critical hurdles are the numerical dominance of extracellular bacteria during acute UTI (16) and the strong population bottleneck that occurs during the establishment of intracellular infection (28). The fact that intracellular bacteria are a quantitatively minor population during acute stages of UTI (16) means that genomics studies of whole urine from mice (49) and humans (51, 52) or of whole mouse bladders (53) are likely largely measuring extracellular bacterial gene expression. In addition, the presence of a strong population bottleneck limits the feasibility of powerful genetic approaches, such as signature-tagged mutagenesis (48, 49) and transposon insertion sequencing (Tn-Seq) (68), for probing intracellular infection in animal models. While such studies have certainly provided novel insights into specific bacterial genes and host-mediated selection pressures in the urinary tract, we have specific molecular information only for individual genes or proteins in IBCs (26, 30, 47, 54, 69–71). Therefore, a conceptual gap remains in our global understanding of the intracellular population of UPEC during acute UTI. We propose that, combined with advances in low-input genomics technologies, such as transcriptome sequencing (RNA-seq) or proteomics, our isolation technique will now enable niche-specific studies of the genetics and regulation utilized by UPEC for forming IBCs, thereby facilitating an understanding of chronic and recurrent UTIs. Specifically, single-cell RNA-seq is now routine (with enrichment for mRNA transcripts) for eukaryotic cells, which are estimated to have 100- to 1,000-fold more total RNA than a single bacterium (72). Given our estimate that each IBC contains approximately 103 bacteria, we speculate that RNA-seq for both host and bacterial gene expression might eventually be performed on single isolated IBCs, perhaps once ribosomal depletion strategies have been optimized.
Early studies of IBCs focused on morphological mapping of the developmental cascade through which UPEC progresses during infection (16, 26, 27). By using an elegant ex vivo system, microscopic images were used to estimate the volume of typical IBCs and their constituent bacteria, leading by calculation to an estimate of up to 106 UPEC bacteria per mature IBC (13, 27). Combined with the subsequent proof that individual IBCs arise from the invasion of a single UPEC cell into an epithelial cell (28), a rapid doubling time of 30 to 35 min was estimated for UPEC during the initial 8 h of infection (27), suggesting that nutrient availability was very high. This was further supported by the observation that UPEC bacteria within IBCs showed evidence of aerobic metabolism (54). We have now quantified, using two methods, the number of UPEC bacteria within individual IBCs at 6 hpi, arriving at a median of 103 UPEC bacteria/IBC by measuring genomic DNA. We also observed that isolated IBCs are aerobic and calculated a similar estimated doubling time of approximately 35 min during the first 6 h of infection, assuming that each IBC arises from a single founder bacterium. The growth rate may very well vary as UPEC bacteria become more numerous within a single epithelial cell; furthermore, the time that it takes for an individual UPEC cell to invade an individual epithelial cell is not accounted for in this estimate. However, our results are in excellent agreement with previously reported observations of IBCs.
Regarding the nearly 1,000-fold difference in our estimates of the number of bacteria per IBC, we note that previously reported estimates appear to have calculated the maximal number of bacteria that could be contained in observed IBCs, based on size, across all time points stretching out to 24 hpi (13, 27). In contrast, we have reported the median CFU measured and have focused on the 6-hpi time point. Together, these two differences might account for much of the discrepancy. Furthermore, while IBC formation is a common feature of experimental UTI in mice, there are notable variations in the numbers, sizes, and kinetics of formation of IBCs depending on the mouse and bacterial strains used (63). Differences in experimental infection protocols as well as time points studied also certainly would impact IBC size and bacterial numbers, in addition to the quantitative contribution of IBCs and other intracellular bacteria to overall infection (previous studies reported that intracellular bacteria account for as little as 3% to as much as 80% of the total amount of bacteria in the bladder at 6 hpi) (16, 53, 70). The isolation technique that we report here now provides the technical capability to explore these quantitative differences, which may provide further insight into relevant host and pathogen pathways impacting IBC formation and UTI in general.
We note that culture-based quantification yielded approximately 3-fold-lower estimates of the numbers of CFU per IBC. While not approaching an order of magnitude, this may have some implications for the experimental quantification of bacterial loads during in vivo infections. Typically, mouse bladders are homogenized prior to bacterial quantification (in the presence of Triton X in some reports); this is presumed to disrupt the epithelial cells enclosing any intracellular bacteria and furthermore to separate individual CFU within IBCs. Biofilms can be quite recalcitrant to disruption, however, and there has been no way to assess whether UPEC bacteria within IBCs are fully separated during homogenization. For our measurements, it was impractical to use a homogenizer on individual IBCs; therefore, we estimate that the 3- to 6-fold difference between CFU measured by titer determination and genome equivalents measured by qPCR is a maximal difference. Besides an incomplete separation of aggregated bacteria, another possibility is that some of the bacteria within the IBC are either dead or viable but nonculturable. We did not systematically explore either of these possibilities. However, our data suggest that the current standard of homogenization of bladders is generally effective for quantifying overall bacterial loads, both intracellular and extracellular, with a maximal error of only 3- to 6-fold (which is relatively minor given that most researchers measure bladder CFU on a logarithmic scale).
In summary, we have developed a simple and rapid method for the direct isolation of IBCs from experimentally infected mouse bladders. We can verify that these are bona fide IBCs based on microscopic and gene expression analyses. We can also verify that “contaminating” extracellular bacteria are very nearly undetectable. This technique scales well enough to isolate hundreds of IBCs with good purity (>90%); this is sufficient for numerous types of downstream microbiological and molecular studies. We anticipate that our technique will enable further specific genomic studies of the intracellular stages of UTI aimed at discovering novel strategies for preventing recurrent UTI.
MATERIALS AND METHODS
Bacterial strains.
The wild-type (wt) E. coli UTI89 cystitis strain was used as a standard for in vitro RNA expression experiments. Strain SLC-638 (UTI89 carrying a vsfGFP-9-expressing plasmid conferring kanamycin and ampicillin resistance) was used for all in vivo infections (61).
Cell cultures.
The murine macrophage cell line RAW264.7 (ATCC TIB-71; ATCC, Singapore) was cultured in Dulbecco's modified Eagle's medium (DMEM) (catalog no. 11965-092; Gibco, Life Technologies, Singapore) supplemented with 10% fetal bovine serum (FBS) (catalog no. SV30160.03; HyClone, Singapore) together with 1% penicillin-streptomycin (catalog no. 10378-016; Gibco, Life Technologies, Singapore). All cultures were maintained at 37°C in a humidified atmosphere containing 5% (vol/vol) CO2, cultured in sterile 25-cm2 flasks (Corning), and subcultivated (1:4) three times a week; the medium was replaced every 48 h. Subconfluent monolayers were dissociated with 0.01% trypsin (catalog no. 15400-054; Gibco, Life Technologies, Singapore) and washed with 1× PBS three times before being transferred to a Cytofunnel (EZ single Cytofunnel, catalog no. A78710003; Thermo Scientific, Singapore).
Mouse infections.
All studies involving mice were approved by the A*STAR Institutional Animal Care and Use Committee (IACUC), under IACUC protocol no. 130853 and 161148. Infections were performed as previously described (9). Briefly, bacteria were grown under type 1 fimbria-inducing conditions by two consecutive 24-h periods of static culture in LB broth bacterial culture medium (catalog no. Bio-4000; 1st BASE, Singapore), with a 1:1,000 dilution into fresh medium after the first 24 h. Seven- to nine-week-old female C57BL/6J mice (In Vivos, Singapore) were anesthetized with isoflurane (IsoThesis, catalog no. 900-8931; Henry Schein, Singapore) and inoculated with a 50-μl suspension containing 1 × 10⁷ to 2 × 10⁷ CFU/ml of the bacterial isolate in 1× PBS (prepared from 10× PBS) (catalog no. BUF-2040; 1st BASE, Singapore) via a transurethral catheter (Intramedic Clay Adams tubing [catalog no. 427401; BD, Singapore] and a 30-gauge precision-glide needle, [catalog no. 305107; BD, Singapore]).
Harvesting of bone marrow cells.
Bone marrow cells were harvested from the femurs of euthanized mice. In brief, femurs were taken from mice and cut open on both ends by using surgical scissors. BM cells were then flushed from the cut bone with 5 ml of PBS, using a syringe fitted with a 30-gauge needle (same as the catheter needle). The mixture was then centrifuged at 1,200 rpm (253 relative centrifugal force [rcf]), and the cell pellet was resuspended in 1 ml of ACK (ammonium chloride-potassium) lysis buffer (catalog no. A1049201; ThermoFisher Scientific, Singapore) for 2 min on ice to lyse red blood cells. ACK buffer was then neutralized with 9 ml of PBS, and the mixture was centrifuged to remove the liquid. Cell pellets were then resuspended in PBS and either added to a petri dish containing scraped bladder cells or transferred directly into a Cytofunnel as appropriate.
Isolation of individual IBCs by micropipetting.
At 6 hpi, urine was expressed and collected from mice by the application of gentle pressure to the suprapubic area. Mice were then euthanized by anesthesia with isoflurane, followed by cervical dislocation. Bladders were aseptically removed, inverted by using two pairs of fine forceps, and placed into 1 ml of PBS in a petri dish. Each bladder was visualized by fluorescence microscopy (magnification, ×2 to ×6.5) (MVX10; Olympus, Singapore) to check for foci of GFP fluorescence. The bladder was then held with one pair of fine forceps while the areas containing GFP fluorescence were gently scraped with the curved back edge of a second closed pair of fine forceps (so that no sharp edges or points came into contact with the bladder). Individual cells (either GFP fluorescent or not) were then manually aspirated by using microcapillary pipettes attached to an aspirator tube assembly (aspirator tube assemblies for calibrated microcapillary pipettes) (catalog no. A5177; Sigma-Aldrich, Singapore) and ejected as needed into individual tubes, sterile PBS, or other sample storage devices as appropriate.
Microscopy.
The primary antibodies (and their corresponding dilutions) used were rabbit anti-uroplakin III antibody (catalog no. ab157801; Abcam, Singapore) (1:800 dilution), rat anti-CD45 antibody (catalog no. ab23910; Abcam, Singapore) (1:500), and goat anti-E. coli antibody (catalog no. ab25823; Abcam, Singapore) (1:500). Secondary antibodies were donkey anti-rabbit (Alexa Fluor 594, catalog no. A21207; Invitrogen), donkey anti-rat (Alexa Fluor 594, catalog no. A21209; Invitrogen), and donkey anti-goat (Alexa Fluor 488, catalog no. A11055; Invitrogen) antibodies from Molecular Probes, Singapore, all at 1:500 dilutions. For nonisolated (bulk) cell populations, 750 μl of the cell suspension in PBS was transferred into Cytofunnels and spun onto polylysine-coated glass slides (Polysine slides, catalog no. J2800AMNZ; Thermo Scientific, Singapore) or silane-coated slides (catalog no. 0810000; Marienfeld, Germany) by using a cytospin machine (Shandon Cytospin 4, catalog no. A78300101; Thermo Scientific, UK). The cytospun glass slides were removed from the funnel and allowed to air dry for 5 min. Individually isolated cells were pipetted directly onto the glass slides immediately after isolation and allowed to air dry in a laminar flow hood.
Cells on the slides were then fixed with 3% PFA (paraformaldehyde) (catalog no. 15,812-7; Sigma-Aldrich, Singapore) in PBS for 15 min. Glass slides were then washed 3 times with PBS (2 min each time) by repeated immersion using a slide staining rack and dish setup (catalog no. H444-D-GY-X; PST, Singapore). Fixed cells were blocked for 30 min at room temperature with blocking buffer (1% BSA [bovine serum albumin] [catalog no. A2153; Sigma-Aldrich, Singapore] in PBS-T [prepared in-house from PBS and Tween 20] [catalog no. 20605; USB Corp., USA]). The cells were then incubated with the primary antibody (or antibodies for dual staining) diluted in blocking buffer for 2 h at room temperature. Slides were washed for 2 min in deionized (DI) water (using a slide staining rack and dish setup), after which they were immersed in TBS-T (prepared in-house from 20× Tris-buffered saline [TBS] [catalog no. 3030; 1st BASE, Singapore] and Tween 20) and placed onto a Bellydancer instrument (catalog no. 20177; Stovall Life Science Inc., USA) at 50 rpm for 5 min. The slides were then incubated with the secondary antibody (or antibodies) diluted in blocking buffer for 30 min at room temperature in a dark room. The slides were washed again in DI water (2 min), immersed in TBS-T, placed onto a Bellydancer instrument at 50 rpm for 5 min, and allowed to air dry. The slides were then counterstained with 1,000× DAPI in PBS (catalog no. D9542; Sigma-Aldrich, Singapore) for 5 min and washed with PBS (immersed in PBS and shaken on a Bellydancer instrument at 50 rpm for 5 min).
The slides were then dried, 2 μl of mounting medium (Calbiochem FluorSave reagent, catalog no. 345789; Merck, Singapore) was placed onto the stained cells, and the cells were covered by using coverslips (High Precision Deckglaser; Marienfeld, Germany). Confocal images were obtained by using an Olympus FluoView FV1000 laser scanning confocal microscope (Olympus, Japan), using a 20×/0.7 or a 60×/1.0 water objective with argon ion (488-nm) and HeNe (543-nm) lasers as the excitation source. All confocal images in a single experiment were captured by using the same image acquisition parameters for all slides at the same magnification. Raw data were collected as 12-bit images; these images were downsampled linearly to an 8-bit grayscale color space by using FV10-ASW 1.7 software and then processed by resizing without further modification of brightness, contrast, or gamma correction using Adobe Illustrator.
RT-qPCR quantification of gene expression.
A culture from a single colony of wt UTI89 bacteria grown overnight was subcultured in LB broth at a 1:1,000 dilution under aerobic and anaerobic conditions. Aerobic cultures were grown at 37°C with vigorous agitation; samples were taken at 4 h (optical density at 600 nm [OD600] of ∼0.5), 6 h (OD600 of ∼0.9), and 24 h (OD600 of >2, the overnight time point). Anaerobic cultures were grown without agitation at 37°C under a thick layer of mineral oil (catalog no. 163-2129; Bio-Rad, Singapore); both aerobic and anaerobic cultures were set up simultaneously, and samples from anaerobic cultures were aliquoted at the same time as the aerobic samples.
At each time point, a 500-μl aliquot of the respective culture was pipetted into 1 ml of RNAprotect bacterial reagent (catalog no. 1018380; Qiagen, Singapore) and then mixed thoroughly by vortexing. Individually isolated IBCs or isolated GFP-negative epithelial cells were pooled directly after isolation in a 1.5-ml Eppendorf tube and stabilized with 200 μl of RNAprotect. RNA from samples stabilized in RNAprotect was extracted by using the RNeasy minikit (catalog no. 74104; Qiagen, Singapore). DNA was removed by the addition of 4 μl of DNase I for 4 μg of the RNA extracted in a final volume of 20 μl (using RNase-free water) according to the manufacturer's protocol (Ambion DNase I [RNase free], catalog no. AM2222; Life Technologies, Singapore). For cDNA synthesis, the Superscript II kit was used, with 0.42 μl of random hexamers added to 500 ng of purified RNA in a final volume of 20 μl (using RNase-free water), according to the manufacturer's protocol (Superscript II reverse transcriptase, catalog no. 1821032; Invitrogen, Singapore).
Each quantitative PCR was performed with a total volume of 10 μl: 5 μl 2× Kapa master mix (Kapa SYBR Fast universal qPCR kit; Kapa Biosystems, Singapore), 0.2 μl each of forward and reverse primers (10 μM each), 1.5 μl cDNA, and 3.1 μl of RNase-free water. The following primers were used: AACGCGAAGAACCTTAC (V6) and CCTTTGAGTTCCCGGCC (R2) for 16S rRNA, 5′-ATGCCTTTCGTTATCGGTCTGAT-3′ and 5′-CAACGGTAAACCAGAAGCTTAAGTT-3′ for cyoB, and 5′-CGTCGATCCGGTTAAAGAA-3′ and 5′-CAGACCTTTAATGCGGGTTTCA-3′ for frdA (54). For a single biological replicate, RT-qPCRs were run in triplicate on a LightCycler 480 instrument (Roche, Singapore) with the following protocol: 95°C for 5 min followed by 40 cycles of 95°C for 30 s and 60°C for 30 s. A melting curve was run immediately afterwards with the following protocol: 95°C for 5 s, 65°C for 1 min, and a continuous acquisition step to 97°C with 20 acquisitions/°C. Each experiment was performed with at least three biological replicates.
Based on examinations of CT values, melting temperatures, and amplification curves using serial dilutions of purified genomic DNA, maximum CT values of 30 for the 16S rRNA gene and 34 for the cyoB and frdA genes were set as the limits of detection. All data analyzed for expression levels not only passed this CT value threshold but also were verified to have the correct melting temperature and a reasonable amplification curve profile (based on manual examination of the baseline, curve shape, and fluorescence intensity range). Samples with detectable RNA expression for all measured genes based on these criteria were then analyzed by normalizing the cyoB and frdA expression levels to the 16S rRNA expression level. Fold changes for cyoB and frdA expression levels were then calculated (as 2−ΔΔCT) relative to the overnight time point for the in vitro anaerobic culture, as reported previously (54).
Quantification of E. coli bacteria from isolated epithelial cells. (i) Uninfected and infected epithelial cell samples.
Fifty microliters of 0.1% Triton X was added to a tube containing a single isolated epithelial cell, and the tube was then vigorously vortexed at maximum speed for 15 s and incubated for the indicated times (0 to 30 min). The sample was then centrifuged at maximum speed (Capsulefuge, catalog no. PMC-860; Fisher Scientific, Singapore), and the supernatant was removed. The pellet was then processed as required for either serial dilution and titration or qPCR.
For titration, 100 μl of PBS was added, and titers were determined by using 10-fold serial dilutions in PBS on LB plates containing kanamycin sulfate (50 μg/ml) (catalog no. 420311; Merck, Singapore) by spotting 10 μl from each dilution in duplicate.
For preparation of the qPCR template, 12 μl of PBS was added to the pellet, which was then heat boiled at 95°C for 20 min to release DNA, followed by cooling to 12°C.
(ii) Preparation of urine samples.
A 50-μl aliquot of mouse urine (typically pooled from 1 to 5 mice) was centrifuged, and the supernatant was removed. Fifty microliters of 0.1% Triton X in PBS was added, and the mixture was incubated for 0 or 10 min. The sample was then centrifuged, and the titer was determined as described above for individual epithelial cells.
(iii) Preparation of bacterial cultures.
An individual colony of SLC-638 was inoculated into 2 ml LB broth with kanamycin and incubated at 37°C with agitation until the mid-log phase was reached (OD600 of 0.5). Aliquots of this culture were then diluted 1,000-fold and 10,000-fold with PBS to yield bacterial samples for controls. The control samples were then diluted 10-fold with PBS, and the titer was determined as described above following the addition of Triton (0 and 10 min). Aliquots (50 μl) of the control samples were heat boiled as described above for qPCR preparation.
(iv) qPCR protocol.
A bacterial culture of UTI89 (fresh mid-log-phase culture) was serially diluted to 1 × 10² CFU, heat boiled at 95°C for 20 min, cooled down to room temperature, and centrifuged at maximum speed for 5 min to pellet the cells. The supernatant was transferred to a fresh tube. qPCRs were done by using the following recipe (final volume of 20 μl): 10 μl 2× Kapa master mix, 0.4 μl Rox low dye (50×), 4 μl primer mix from 16S rRNA (V6 and R2 [mentioned above]) (1 μM each), 2 μl DNA template, and 3.6 μl water. Reactions were run on a 7500Fast system (Applied Biosystems, Singapore) under the following conditions: 95°C for 3 min, 40 cycles of 95°C for 10 s and 60°C for 10 s, and then a final extension step at 60°C for 30 s.
(v) Statistical analyses.
All qRT-PCR and bacterial titer data were plotted on a log scale. Bacterial titers were summarized using the median and compared between samples by using a 2-tailed Mann-Whitney U test. For qRT-PCR assays, within each experiment, the mean of data from triplicate technical replicates was used as the value for the single biological replicate for that sample. A fold change value was calculated for each biological replicate and then summarized using the mean across biological replicates and compared by using 2-tailed Student's t test.
Supplementary Material
ACKNOWLEDGMENTS
We thank Majid Eshaghi, Kurosh Mehershahi, and Shazmina Rafee for general technical advice and assistance. We thank the Advanced Molecular Pathology Laboratory at IMCB, Debabrata Biswas, Sheryl Justice, and Indira Mysorekar for technical advice on microscopy.
This research was supported by the National Research Foundation, Prime Minister's Office, Singapore, under its NRF Research Fellowship Scheme (NRF award no. NRF-RF2010-10); the Singapore Ministry of Health's National Medical Research Council (NMRC/CIRG/1358/2013); and the Genome Institute of Singapore (GIS)/Agency for Science, Technology, and Research (A*STAR).
Footnotes
Supplemental material for this article may be found at https://doi.org/10.1128/IAI.00740-17.
REFERENCES
- 1.Foxman B. 2002. Epidemiology of urinary tract infections: incidence, morbidity, and economic costs. Am J Med 113(Suppl 1A):5S–13S. [DOI] [PubMed] [Google Scholar]
- 2.Flores-Mireles AL, Walker JN, Caparon M, Hultgren SJ. 2015. Urinary tract infections: epidemiology, mechanisms of infection and treatment options. Nat Rev Microbiol 13:269–284. doi: 10.1038/nrmicro3432. [DOI] [PMC free article] [PubMed] [Google Scholar]
- 3.Foxman B. 1990. Recurring urinary tract infection: incidence and risk factors. Am J Public Health 80:331–333. doi: 10.2105/AJPH.80.3.331. [DOI] [PMC free article] [PubMed] [Google Scholar]
- 4.Brumbaugh AR, Mobley HL. 2012. Preventing urinary tract infection: progress toward an effective Escherichia coli vaccine. Expert Rev Vaccines 11:663–676. doi: 10.1586/erv.12.36. [DOI] [PMC free article] [PubMed] [Google Scholar]
- 5.Kodner CM, Gupton EKT. 2010. Recurrent urinary tract infections in women: diagnosis and management. Am Fam Physician 82:638–643. [PubMed] [Google Scholar]
- 6.Scholes D, Hooton TM, Roberts PL, Stapleton AE, Gupta K, Stamm WE. 2000. Risk factors for recurrent urinary tract infection in young women. J Infect Dis 182:1177–1182. doi: 10.1086/315827. [DOI] [PubMed] [Google Scholar]
- 7.Zowawi HM, Harris PNA, Roberts MJ, Tambyah PA, Schembri MA, Pezzani MD, Williamson DA, Paterson DL. 2015. The emerging threat of multidrug-resistant Gram-negative bacteria in urology. Nat Rev Urol 12:570–584. doi: 10.1038/nrurol.2015.199. [DOI] [PubMed] [Google Scholar]
- 8.Silverman JA, Schreiber HL IV, Hooton TM, Hultgren SJ. 2013. From physiology to pharmacy: developments in the pathogenesis and treatment of recurrent urinary tract infections. Curr Urol Rep 14:448–456. doi: 10.1007/s11934-013-0354-5. [DOI] [PMC free article] [PubMed] [Google Scholar]
- 9.Hung C-S, Dodson KW, Hultgren SJ. 2009. A murine model of urinary tract infection. Nat Protoc 4:1230–1243. doi: 10.1038/nprot.2009.116. [DOI] [PMC free article] [PubMed] [Google Scholar]
- 10.Hagberg L, Engberg I, Freter R, Lam J, Olling S, Svanborg Edén C. 1983. Ascending, unobstructed urinary tract infection in mice caused by pyelonephritogenic Escherichia coli of human origin. Infect Immun 40:273–283. [DOI] [PMC free article] [PubMed] [Google Scholar]
- 11.Carey AJ, Tan CK, Ipe DS, Sullivan MJ, Cripps AW, Schembri MA, Ulett GC. 2016. Urinary tract infection of mice to model human disease: practicalities, implications and limitations. Crit Rev Microbiol 42:780–799. doi: 10.3109/1040841X.2015.1028885. [DOI] [PubMed] [Google Scholar]
- 12.Sivick KE, Mobley HLT. 2010. Waging war against uropathogenic Escherichia coli: winning back the urinary tract. Infect Immun 78:568–585. doi: 10.1128/IAI.01000-09. [DOI] [PMC free article] [PubMed] [Google Scholar]
- 13.Hunstad DA, Justice SS. 2010. Intracellular lifestyles and immune evasion strategies of uropathogenic Escherichia coli. Annu Rev Microbiol 64:203–221. doi: 10.1146/annurev.micro.112408.134258. [DOI] [PubMed] [Google Scholar]
- 14.McTaggart LA, Rigby RC, Elliott TSJ. 1990. The pathogenesis of urinary tract infections associated with Escherichia coli, Staphylococcus saprophyticus and S. epidermidis. J Med Microbiol 32:135–141. doi: 10.1099/00222615-32-2-135. [DOI] [PubMed] [Google Scholar]
- 15.Jones CH, Pinkner JS, Rotht R, Heusert J, Nicholes AV, Abraham SN, Hultgren SJ. 1995. FimH adhesin of type 1 pili is assembled into a fibrillar tip structure in the Enterobacteriaceae. Proc Natl Acad Sci U S A 92:2081–2085. [DOI] [PMC free article] [PubMed] [Google Scholar]
- 16.Mulvey MA, Lopez-Boado YS, Wilson CL, Roth R, Parks WC, Heuser J, Hultgren SJ. 1998. Induction and evasion of host defenses by type 1-piliated uropathogenic Escherichia coli. Science 282:1494–1497. doi: 10.1126/science.282.5393.1494. [DOI] [PubMed] [Google Scholar]
- 17.Martinez JJ, Mulvey MA, Schilling JD, Pinkner JS, Hultgren SJ. 2000. Type 1 pilus-mediated bacterial invasion of bladder epithelial cells. EMBO J 19:2803–2812. doi: 10.1093/emboj/19.12.2803. [DOI] [PMC free article] [PubMed] [Google Scholar]
- 18.Mulvey MA, Schilling JD, Hultgren SJ. 2001. Establishment of a persistent Escherichia coli reservoir during the acute phase of a bladder infection. Infect Immun 69:4572–4579. doi: 10.1128/IAI.69.7.4572-4579.2001. [DOI] [PMC free article] [PubMed] [Google Scholar]
- 19.Min G, Stolz M, Zhou G, Liang F, Sebbel P, Stoffler D, Glockshuber R, Sun T-T, Aebi U, Kong X-P. 2002. Localization of uroplakin Ia, the urothelial receptor for bacterial adhesin FimH, on the six inner domains of the 16 nm urothelial plaque particle. J Mol Biol 317:697–706. doi: 10.1006/jmbi.2002.5442. [DOI] [PubMed] [Google Scholar]
- 20.Zhou G, Mo W-J, Sebbel P, Min G, Neubert TA, Glockshuber R, Wu X-R, Sun T-T, Kong X-P. 2001. Uroplakin Ia is the urothelial receptor for uropathogenic Escherichia coli: evidence from in vitro FimH binding. J Cell Sci 114:4095–4103. [DOI] [PubMed] [Google Scholar]
- 21.Deng F-M, Liang F-X, Tu L, Resing KA, Hu P, Supin M, Hu C-CA, Zhou G, Ding M, Kreibich G, Sun T-T. 2002. Uroplakin IIIb, a urothelial differentiation marker, dimerizes with uroplakin Ib as an early step of urothelial plaque assembly. J Cell Biol 159:685–694. doi: 10.1083/jcb.200204102. [DOI] [PMC free article] [PubMed] [Google Scholar]
- 22.Hung C-S, Bouckaert J, Hung D, Pinkner J, Widberg C, DeFusco A, Auguste CG, Strouse R, Langermann S, Waksman G, Hultgren SJ. 2002. Structural basis of tropism of Escherichia coli to the bladder during urinary tract infection. Mol Microbiol 44:903–915. doi: 10.1046/j.1365-2958.2002.02915.x. [DOI] [PubMed] [Google Scholar]
- 23.Cavallone D, Malagolini N, Monti A, Wu X-R, Serafini-Cessi F. 2004. Variation of high mannose chains of Tamm-Horsfall glycoprotein confers differential binding to type 1-fimbriated Escherichia coli. J Biol Chem 279:216–222. doi: 10.1074/jbc.M308821200. [DOI] [PubMed] [Google Scholar]
- 24.Xie B, Zhou G, Chan S-Y, Shapiro E, Kong X-P, Wu X-R, Sun T-T, Costello CE. 2006. Distinct glycan structures of uroplakins Ia and Ib: structural basis for the selective binding of FimH adhesin to uroplakin Ia. J Biol Chem 281:14644–14653. doi: 10.1074/jbc.M600877200. [DOI] [PubMed] [Google Scholar]
- 25.Connell I, Agace W, Klemm P, Schembri M, Mărild S, Svanborg C. 1996. Type 1 fimbrial expression enhances Escherichia coli virulence for the urinary tract. Proc Natl Acad Sci U S A 93:9827–9832. [DOI] [PMC free article] [PubMed] [Google Scholar]
- 26.Anderson GG, Palermo JJ, Schilling JD, Roth R, Heuser J, Hultgren SJ. 2003. Intracellular bacterial biofilm-like pods in urinary tract infections. Science 301:105–107. doi: 10.1126/science.1084550. [DOI] [PubMed] [Google Scholar]
- 27.Justice SS, Hung C, Theriot JA, Fletcher DA, Anderson GG, Footer MJ, Hultgren SJ. 2004. Differentiation and developmental pathways of uropathogenic Escherichia coli in urinary tract pathogenesis. Proc Natl Acad Sci U S A 101:1333–1338. doi: 10.1073/pnas.0308125100. [DOI] [PMC free article] [PubMed] [Google Scholar]
- 28.Schwartz DJ, Chen SL, Hultgren SJ, Seed PC. 2011. Population dynamics and niche distribution of uropathogenic Escherichia coli during acute and chronic urinary tract infection. Infect Immun 79:4250–4259. doi: 10.1128/IAI.05339-11. [DOI] [PMC free article] [PubMed] [Google Scholar]
- 29.Schilling JD, Lorenz RG, Hultgren SJ. 2002. Effect of trimethoprim-sulfamethoxazole on recurrent bacteriuria and bacterial persistence in mice infected with uropathogenic Escherichia coli. Infect Immun 70:7042–7049. doi: 10.1128/IAI.70.12.7042-7049.2002. [DOI] [PMC free article] [PubMed] [Google Scholar]
- 30.Justice SS, Hunstad DA, Seed PC, Hultgren SJ. 2006. Filamentation by Escherichia coli subverts innate defenses during urinary tract infection. Proc Natl Acad Sci U S A 103:19884–19889. doi: 10.1073/pnas.0606329104. [DOI] [PMC free article] [PubMed] [Google Scholar]
- 31.Khandige S, Asferg CA, Rasmussen KJ, Larsen MJ, Overgaard M, Andersen TE, Møller-Jensen J. 2016. DamX controls reversible cell morphology switching in uropathogenic Escherichia coli. mBio 7:e00642-16. doi: 10.1128/mBio.00642-16. [DOI] [PMC free article] [PubMed] [Google Scholar]
- 32.Mysorekar IU, Hultgren SJ. 2006. Mechanisms of uropathogenic Escherichia coli persistence and eradication from the urinary tract. Proc Natl Acad Sci U S A 103:14170–14175. doi: 10.1073/pnas.0602136103. [DOI] [PMC free article] [PubMed] [Google Scholar]
- 33.Rosen DA, Hooton TM, Stamm WE, Humphrey PA, Hultgren SJ. 2007. Detection of intracellular bacterial communities in human urinary tract infection. PLoS Med 4:e329. doi: 10.1371/journal.pmed.0040329. [DOI] [PMC free article] [PubMed] [Google Scholar]
- 34.Robino L, Scavone P, Araujo L, Algorta G, Zunino P, Vignoli R. 2013. Detection of intracellular bacterial communities in a child with Escherichia coli recurrent urinary tract infections. Pathog Dis 68:78–81. doi: 10.1111/2049-632X.12047. [DOI] [PubMed] [Google Scholar]
- 35.Robino L, Scavone P, Araujo L, Algorta G, Zunino P, Pírez MC, Vignoli R. 2014. Intracellular bacteria in the pathogenesis of Escherichia coli urinary tract infection in children. Clin Infect Dis 59:e158–e164. doi: 10.1093/cid/ciu634. [DOI] [PMC free article] [PubMed] [Google Scholar]
- 36.Cheng Y, Chen Z, Gawthorne JA, Mukerjee C, Varettas K, Mansfield KJ, Schembri MA, Moore KH. 2016. Detection of intracellular bacteria in exfoliated urothelial cells from women with urge incontinence. Pathog Dis 74:ftw067. doi: 10.1093/femspd/ftw067. [DOI] [PubMed] [Google Scholar]
- 37.Foxman B, Zhang L, Tallman P, Palin K, Rode C, Bloch C, Gillespie B, Marrs CF. 1995. Virulence characteristics of Escherichia coli causing first urinary tract infection predict risk of second infection. J Infect Dis 172:1536–1541. doi: 10.1093/infdis/172.6.1536. [DOI] [PubMed] [Google Scholar]
- 38.Russo TA, Stapleton A, Wenderoth S, Hooton TM, Stamm WE. 1995. Chromosomal restriction fragment length polymorphism analysis of Escherichia coli strains causing recurrent urinary tract infections in young women. J Infect Dis 172:440–445. doi: 10.1093/infdis/172.2.440. [DOI] [PubMed] [Google Scholar]
- 39.Czaja CA, Stamm WE, Stapleton AE, Roberts PL, Hawn TR, Scholes D, Samadpour M, Hultgren SJ, Hooton TM. 2009. Prospective cohort study of microbial and inflammatory events immediately preceding Escherichia coli recurrent urinary tract infection in women. J Infect Dis 200:528–536. doi: 10.1086/600385. [DOI] [PMC free article] [PubMed] [Google Scholar]
- 40.Luo Y, Ma Y, Zhao Q, Wang L, Guo L, Ye L, Zhang Y, Yang J. 2012. Similarity and divergence of phylogenies, antimicrobial susceptibilities, and virulence factor profiles of Escherichia coli isolates causing recurrent urinary tract infections that persist or result from reinfection. J Clin Microbiol 50:4002–4007. doi: 10.1128/JCM.02086-12. [DOI] [PMC free article] [PubMed] [Google Scholar]
- 41.Chen SL, Wu M, Henderson JP, Hooton TM, Hibbing ME, Hultgren SJ, Gordon JI. 2013. Genomic diversity and fitness of E. coli strains recovered from the intestinal and urinary tracts of women with recurrent urinary tract infection. Sci Transl Med 5:184ra60. doi: 10.1126/scitranslmed.3005497. [DOI] [PMC free article] [PubMed] [Google Scholar]
- 42.Subashchandrabose S, Mobley HLT. 2015. Virulence and fitness determinants of uropathogenic Escherichia coli. Microbiol Spectr 3:UTI-0015-2012. doi: 10.1128/microbiolspec.UTI-0015-2012. [DOI] [PMC free article] [PubMed] [Google Scholar]
- 43.Nielubowicz GR, Mobley HLT. 2010. Host-pathogen interactions in urinary tract infection. Nat Rev Urol 7:430–441. doi: 10.1038/nrurol.2010.101. [DOI] [PubMed] [Google Scholar]
- 44.Ulett GC, Totsika M, Schaale K, Carey AJ, Sweet MJ, Schembri MA. 2013. Uropathogenic Escherichia coli virulence and innate immune responses during urinary tract infection. Curr Opin Microbiol 16:100–107. doi: 10.1016/j.mib.2013.01.005. [DOI] [PubMed] [Google Scholar]
- 45.Floyd KA, Meyer AE, Nelson G, Hadjifrangiskou M. 2015. The yin-yang driving urinary tract infection and how proteomics can enhance research, diagnostics, and treatment. Proteomics Clin Appl 9:990–1002. doi: 10.1002/prca.201500018. [DOI] [PubMed] [Google Scholar]
- 46.Wright KJ, Seed PC, Hultgren SJ. 2007. Development of intracellular bacterial communities of uropathogenic Escherichia coli depends on type 1 pili. Cell Microbiol 9:2230–2241. doi: 10.1111/j.1462-5822.2007.00952.x. [DOI] [PubMed] [Google Scholar]
- 47.Anderson GG, Goller CC, Justice S, Hultgren SJ, Seed PC. 2010. Polysaccharide capsule and sialic acid-mediated regulation promote biofilm-like intracellular bacterial communities during cystitis. Infect Immun 78:963–975. doi: 10.1128/IAI.00925-09. [DOI] [PMC free article] [PubMed] [Google Scholar]
- 48.Bahrani-Mougeot FK, Buckles EL, Lockatell CV, Hebel JR, Johnson DE, Tang CM, Donnenberg MS. 2002. Type 1 fimbriae and extracellular polysaccharides are preeminent uropathogenic Escherichia coli virulence determinants in the murine urinary tract. Mol Microbiol 45:1079–1093. doi: 10.1046/j.1365-2958.2002.03078.x. [DOI] [PubMed] [Google Scholar]
- 49.Snyder JA, Haugen BJ, Buckles EL, Lockatell CV, Johnson DE, Donnenberg MS, Welch RA, Mobley HLT. 2004. Transcriptome of uropathogenic Escherichia coli during urinary tract infection. Infect Immun 72:6373–6381. doi: 10.1128/IAI.72.11.6373-6381.2004. [DOI] [PMC free article] [PubMed] [Google Scholar]
- 50.Hagan EC, Lloyd AL, Rasko DA, Faerber GJ, Mobley HLT. 2010. Escherichia coli global gene expression in urine from women with urinary tract infection. PLoS Pathog 6:e1001187. doi: 10.1371/journal.ppat.1001187. [DOI] [PMC free article] [PubMed] [Google Scholar]
- 51.Bielecki P, Muthukumarasamy U, Eckweiler D, Bielecka A, Pohl S, Schanz A, Niemeyer U, Oumeraci T, von Neuhoff N, Ghigo J-M, Häussler S. 2014. In vivo mRNA profiling of uropathogenic Escherichia coli from diverse phylogroups reveals common and group-specific gene expression profiles. mBio 5:e01075-14. doi: 10.1128/mBio.01075-14. [DOI] [PMC free article] [PubMed] [Google Scholar]
- 52.Subashchandrabose S, Hazen TH, Brumbaugh AR, Himpsl SD, Smith SN, Ernst RD, Rasko DA, Mobley HLT. 2014. Host-specific induction of Escherichia coli fitness genes during human urinary tract infection. Proc Natl Acad Sci U S A 111:18327–18332. doi: 10.1073/pnas.1415959112. [DOI] [PMC free article] [PubMed] [Google Scholar]
- 53.Conover MS, Hadjifrangiskou M, Palermo JJ, Hibbing ME, Dodson KW, Hultgren SJ. 2016. Metabolic requirements of Escherichia coli in intracellular bacterial communities during urinary tract infection pathogenesis. mBio 7:e00104-16. doi: 10.1128/mBio.00104-16. [DOI] [PMC free article] [PubMed] [Google Scholar]
- 54.Reigstad CS, Hultgren SJ, Gordon JI. 2007. Functional genomic studies of uropathogenic Escherichia coli and host urothelial cells when intracellular bacterial communities are assembled. J Biol Chem 282:21259–21267. doi: 10.1074/jbc.M611502200. [DOI] [PubMed] [Google Scholar]
- 55.Henderson JP, Crowley JR, Pinkner JS, Walker JN, Tsukayama P, Stamm WE, Hooton TM, Hultgren SJ. 2009. Quantitative metabolomics reveals an epigenetic blueprint for iron acquisition in uropathogenic Escherichia coli. PLoS Pathog 5:e1000305. doi: 10.1371/journal.ppat.1000305. [DOI] [PMC free article] [PubMed] [Google Scholar]
- 56.Roos V, Klemm P. 2006. Global gene expression profiling of the asymptomatic bacteriuria Escherichia coli strain 83972 in the human urinary tract. Infect Immun 74:3565–3575. doi: 10.1128/IAI.01959-05. [DOI] [PMC free article] [PubMed] [Google Scholar]
- 57.Tang F, Barbacioru C, Nordman E, Bao S, Lee C, Wang X, Tuch BB, Heard E, Lao K, Surani MA. 2011. Deterministic and stochastic allele specific gene expression in single mouse blastomeres. PLoS One 6:e21208. doi: 10.1371/journal.pone.0021208. [DOI] [PMC free article] [PubMed] [Google Scholar]
- 58.Talbot NC, Rexroad CE Jr, Pursel VG, Powell AM, Nel ND. 1993. Culturing the epiblast cells of the pig blastocyst. In Vitro Cell Dev Biol Anim 29:543–554. doi: 10.1007/BF02634148. [DOI] [PubMed] [Google Scholar]
- 59.Eveloff J, Haase W, Kinne R. 1980. Separation of renal medullary cells: isolation of cells from the thick ascending limb of Henle's loop. J Cell Biol 87:672–681. doi: 10.1083/jcb.87.3.672. [DOI] [PMC free article] [PubMed] [Google Scholar]
- 60.Keshtkar A, Keshtkar A, Lawford P. 2007. Cellular morphological parameters of the human urinary bladder (malignant and normal). Int J Exp Pathol 88:185–190. doi: 10.1111/j.1365-2613.2006.00520.x. [DOI] [PMC free article] [PubMed] [Google Scholar]
- 61.Eshaghi M, Mehershahi KS, Chen SL. 2016. Brighter fluorescent derivatives of UTI89 utilizing a monomeric vGFP. Pathogens 5:E3. doi: 10.3390/pathogens5010003. [DOI] [PMC free article] [PubMed] [Google Scholar]
- 62.Eshaghi M, Sun G, Grüter A, Lim CL, Chee YC, Jung G, Jauch R, Wohland T, Chen SL. 2015. Rational structure-based design of bright GFP-based complexes with tunable dimerization. Angew Chem 127:14158–14162. doi: 10.1002/ange.201506686. [DOI] [PubMed] [Google Scholar]
- 63.Garofalo CK, Hooton TM, Martin SM, Stamm WE, Palermo JJ, Gordon JI, Hultgren SJ. 2007. Escherichia coli from urine of female patients with urinary tract infections is competent for intracellular bacterial community formation. Infect Immun 75:52–60. doi: 10.1128/IAI.01123-06. [DOI] [PMC free article] [PubMed] [Google Scholar]
- 64.Heitzer A, Mason CA, Hamer G. 1992. Heat shock gene expression in continuous cultures of Escherichia coli. J Biotechnol 22:153–169. doi: 10.1016/0168-1656(92)90139-Z. [DOI] [PubMed] [Google Scholar]
- 65.Yosef N, Regev A. 2011. Impulse control: temporal dynamics in gene transcription. Cell 144:886–896. doi: 10.1016/j.cell.2011.02.015. [DOI] [PMC free article] [PubMed] [Google Scholar]
- 66.Waigh TA. 2014. The physics of living processes: a mesoscopic approach. John Wiley & Sons, Singapore. [Google Scholar]
- 67.Khetrapal V, Mehershahi K, Rafee S, Chen S, Lim CL, Chen SL. 2015. A set of powerful negative selection systems for unmodified Enterobacteriaceae. Nucleic Acids Res 43:e83. doi: 10.1093/nar/gkv248. [DOI] [PMC free article] [PubMed] [Google Scholar]
- 68.Chao MC, Abel S, Davis BM, Waldor MK. 2016. The design and analysis of transposon insertion sequencing experiments. Nat Rev Microbiol 14:119–128. doi: 10.1038/nrmicro.2015.7. [DOI] [PMC free article] [PubMed] [Google Scholar]
- 69.Hadjifrangiskou M, Gu AP, Pinkner JS, Kostakioti M, Zhang EW, Greene SE, Hultgren SJ. 2012. Transposon mutagenesis identifies uropathogenic Escherichia coli biofilm factors. J Bacteriol 194:6195–6205. doi: 10.1128/JB.01012-12. [DOI] [PMC free article] [PubMed] [Google Scholar]
- 70.Justice SS, Lauer SR, Hultgren SJ, Hunstad DA. 2006. Maturation of intracellular Escherichia coli communities requires SurA. Infect Immun 74:4793–4800. doi: 10.1128/IAI.00355-06. [DOI] [PMC free article] [PubMed] [Google Scholar]
- 71.Nicholson TF, Watts KM, Hunstad DA. 2009. OmpA of uropathogenic Escherichia coli promotes postinvasion pathogenesis of cystitis. Infect Immun 77:5245–5251. doi: 10.1128/IAI.00670-09. [DOI] [PMC free article] [PubMed] [Google Scholar]
- 72.Westermann JA, Gorski AS, Vogel J. 2012. Dual RNA-seq of pathogen and host. Nat Rev Microbiol 10:618–630. doi: 10.1038/nrmicro2852. [DOI] [PubMed] [Google Scholar]
Associated Data
This section collects any data citations, data availability statements, or supplementary materials included in this article.