Abstract
Gaucher disease (GD) is an inherited deficiency of glucocerebrosidase leading to accumulation of glucosylceramide in tissues such as the spleen, liver, and bone marrow. The resulting lipid-laden macrophages lead to the appearance of “Gaucher cells”. Anemia associated with an unexplained hyperferritinemia is a frequent finding in GD, but whether this pathogenesis is related to an iron metabolism disorder has remained unclear. To investigate this issue, we explored the iron status of a large cohort of 90 type I GD patients, including 66 patients treated with enzyme replacement therapy. Ten of the patients treated with enzyme replacement were followed up before and during treatment. Serum levels of hepcidin, the iron regulatory peptide, remained within the physiological range, while the transferrin saturation was slightly decreased in children. Inflammation-independent hyperferritinemia was found in 65% of the patients, and Perl’s staining of the spleen and marrow smear revealed iron accumulation in Gaucher cells. Treated patients exhibited reduced hyperferritinemia, increased transferrin saturation and transiently increased systemic hepcidin. In addition, the hepcidin and ferritin correlation was markedly improved, and, in most patients, the hemoglobin level was normalized. To further explore eventual iron sequestration in macrophages, we produce a Gaucher cells model by treating the J774 macrophage cell line with a glucocerebrosidase inhibitor and showed induced local hepcidin and membrane retrieval of the iron exporter, ferroportin. These data reveal the involvement of Gaucher cells in abnormal iron sequestration, which may explain the mechanism of hyperferritinemia in GD patients. Local hepcidin-ferroportin interaction was involved in this pathogenesis.
Introduction
Gaucher Disease (GD) is caused by an inherited deficiency of the lysosomal enzyme glucocerebrosidase, leading to the accumulation of glycosphingolipids in various organ systems, particularly in myeloid mononuclear cells.1 GD is mostly characterized by the presence of lipid-laden macrophages that turn into “Gaucher cells” with a striated appearance and off-center nuclei.2 GD is classified into three clinical types according to the absence (type 1) or presence (types 2 and 3) of central neurological impairment. Type I GD (GD1) remains the most prevalent form of GD.3 In all forms, the clinical presentation of GD and the age of diagnosis are highly variable. The accumulation of Gaucher cells in the spleen, liver and bone marrow leads to significant organomegaly, cytopenia and bone disorders.3 In addition, 36% of Gaucher patients are anemic at diagnosis,3–5 but there is no direct correlation between anemia and the degree of splenomegaly or cytopenia, suggesting that other mechanisms may be involved. Accordingly, we have recently shown that red blood cells (RBCs) exhibit abnormal deformability and adhesion properties that may trigger ischemic events and phagocytosis in GD.6 Using erythroid progenitor cultures derived from peripheral CD34+ cells, we also demonstrated that GD1 patients exhibit ineffective erythropoiesis with increased plasma levels of erythropoietin (EPO) and GDF15 factor.7 The treatment of GD is based on enzyme replacement therapy (ERT)8 using either imiglucerase (Cerezyme®, Genzyme, SANOFI company, Cambridge®, MA, USA) or velaglucerase alfa (VPRIV®, Shire HGT, Lexington, MA, USA). Substrate reduction therapy (SRT) using miglustat (Zavesca®, Actelion Pharmaceuticals, Allschwil, Switzerland) and the new molecule eliglustat (Cerdelga®, Sanofi-Genzyme) may also be used. However, ERT remains the current standard of care for GD treatment, and once started, ERT is generally administered for life.
Several reports have documented the appearance of clinical hyperferritinemia in GD patients in whom the level of serum ferritin may exceed 2–3 times the normal level, suggesting an altered iron homeostasis pathogenesis in GD.4,9–11 Ferritin is an intracellular cytosolic protein that stores iron in almost all tissues, including the liver and spleen, but small amounts are secreted into the serum. The amount of this secreted fraction significantly increases when ferritin synthesis is exceeded due to iron accumulation in target tissues. However, serum ferritin may also increase in the case of an inflammatory stimulus.12
Iron homeostasis is mainly based on iron storage in the liver and macrophages of the spleen, which together contain the largest pool of iron (derived from the phagocytosis of senescent red cells and catabolism of heme) and control its release according to the body’s needs (20–30 mg of iron daily). The intestine is the second compartment that provides 1–2 mg of iron, corresponding to the amount lost daily by the body. In macrophages, as well as in enterocytes, iron is exported to the bloodstream through the iron exporter ferroportin (FPN). Hepcidin, secreted by hepatocytes and acting as a hyposideremic factor, is the main regulator of these iron fluxes.13,14 Hepcidin was first shown in HEK-293 cells transfected with GFP-tagged ferroportin to regulate iron efflux through a direct interaction with ferroportin, leading to the internalization and lysosomal degradation of the exporter.15 This result was confirmed in primary cultured macrophages expressing endogenous ferroportin.16 In addition, hepcidin acts on the iron importer DMT1 (divalent iron transporter 1) at the apical side of the enterocytes, possibly leading to efficient inhibition of iron intestinal absorption.17,18 Hepcidin synthesis is regulated by iron through a complex of integral hemochromatosis proteins, i.e. HFE, HJV (hemojuvelin) and TfR2 (Transferrin Receptor 2). They tightly co-ordinate signaling through the BMP6/HJV/SMAD pathway and increase hepcidin gene (named Hamp) expression when serum or tissue iron levels increase. Inflammation with an accompanying production of cytokines such as IL-6 can also contribute to the elevation of hepcidin synthesis through the JAK/STAT3 signaling pathway.19 Thus, inflammatory conditions can raise the levels of hepcidin, leading to the anemia of inflammation characterized by a high plasma ferritin and low transferrin saturation (TS).20 Interestingly, besides being predominantly produced by the liver, hepcidin was found to be expressed in other organs, although to a lesser extent (e.g. the kidney, gut, and retina).21–28 In addition, hepcidin is expressed in macrophages, where it is supposed to act through an autocrine/paracrine pathway to decrease iron release.29 Two previous studies have reported contradictory results concerning the serum hepcidin concentration in untreated patients with GD1. Thus, the question of the serum hepcidin concentration and its role in iron metabolism in GD requires more investigation.10,11
In this study, we sought to decipher the origin of hyperferritinemia in GD. We investigated iron metabolism parameters and measured the serum hepcidin levels in a large cohort of patients with GD1. In vitro studies, as well as the longitudinal follow up of 10 ERT-treated patients, allowed us to highlight iron retention in Gaucher cells and the improved redistribution of this iron after ERT in patients.
Methods
Patients
We conducted a retrospective observational study on a cohort of 90 patients with type 1 Gaucher Disease (GD1). Three centers participated in the study (Beaujon and Trousseau Hospital, Assistance Publique-Hôpitaux de Paris, and Saint Vincent Hospital, Lille, France). The patients were registered from 2009 to 2015 (for patients’ characteristics see Online Supplementary Table S1). Patients with iron overload, defined by hyperferritinemia associated with a transferrin saturation exceeding 45%, and splenectomized patients were excluded from the study. Most of the patients (n=66) were treated with ERT using either imiglucerase or velaglucerase alfa. Twenty-four patients were untreated at the time of the study, and 10 of them had a longitudinal biological follow up with blood samples taken every 6–10 months. Only patients who received at least six months of ERT were considered as treated patients, and the longest time that a patient had been treated was 23 years. The cohort was explored according to sex and age. Patients aged 16 years or younger were considered as children (pediatric population). Hyperferritinemia was considered when the serum ferritin values were above 300 μg/L for men and above 150 μg/L for children and women. Cases with hyperferritinemia of known origin were excluded, including chronic or acute inflammatory syndrome, history of transfusion or iron supplementation, cellular lysis, dysmetabolic syndrome, and excessive alcohol consumption. Anemia was determined by hemoglobin levels below 13 g/dL for men, 12 g/dL for women and 11.5 g/dL for children.
The study was conducted in accordance with the principles of the Declaration of Helsinki and was approved by the local ethics committee.
Hematologic and biochemical analysis
Serum iron, ferritin, transferrin, C-reactive protein (CRP) and soluble transferrin receptor (sTfR) were quantified using the Dimension RXL and Vista 1500 system (Siemens Healthcare, Saint-Denis, France). Transferrin saturation (TS) was calculated as the percent of [serum iron (μmol/L) / serum transferrin (g/L) × 25]. The hemoglobin level was measured on an automated counter (Sysmex, Roissy, France), and quantification of IL-6 was performed using a cytometric bead array (BD Bioscience, Le Pont de Cliax, France). Serum hepcidin was quantified by the previously published method of LC-MSMS.30 Biological markers for each subgroup were expressed in mean±Standard Error of Mean (SEM).
Cell culture
The J774 cell line derived from mouse macrophages was purchased from the American Type Culture Collection (ATCC) and was cultured in Dulbecco’s Modified Eagle’s Medium (DMEM) supplemented with a 10% low-endotoxin fetal bovine serum (FBS), 4 mM glutamine and 1.5 g/L sodium bicarbonate at 37°C with 5% CO2 in the atmosphere. Cells were plated and maintained overnight in the above medium in a 6-well plate. Confluent cells were first treated with FeNTA (100 μM Fe/400 μM NTA) to drive the expression of FPN at the cell membrane. Twenty-four hours (h) later, 1 mM conduritol B epoxide (CBE) was added for 96 h.
Immunofluorescence and confocal microscopy
Treated cells were washed 3 times with PBS, fixed with 3% paraformaldehyde for 10 min at room temperature, washed again 3 times with PBS, incubated with 20 mmol/L glycine for 10 min, and subsequently permeabilized for 30 min with PBS containing 0.1% saponin. FPN staining was performed using an anti-FPN antibody (Alpha Diagnostic International, San Antonio, USA) (1/50, for 1 h at room temperature). Actin staining was performed using Alexa Fluor 635 phalloidin (1/200, for 30 min at room temperature). The coverslips were mounted using Dako glycerol medium supplemented with 2.5% 1,4 diazabicyclo-(2.2.2)octane (DABCO) (Sigma Aldrich, St Louis, MO, USA) as the anti-fading reagent. Confocal images were taken with a high-resolution confocal microscopy LSM 780 (ZEISS, Marly-Le-Roi, France) equipped with a 63X oil immersion objective.
Statistical analysis
Statistical analysis was performed using Prism 7 software (GraphPad Software, La Jolla, CA, USA). The unpaired Mann-Whitney test and the paired Wilcoxon test were used to compare biological values. The χ2 test was used to compare patient groups. Spearman’s test was performed to qualify the correlations. P<0.05 was considered statistically significant. Other methods are described in the Online Supplementary Appendix.
Results
Biological features of the untreated patients
The main biological parameters are shown in Table 1. As expected, high ferritinemia was found in untreated patients, with mean values of 563, 518 and 287 g/L in the subgroups of men, women and children, respectively. Twenty-two (65%) out of these 34 patients showed high serum ferritin levels (67% of men, 57% of women and 73% of children) (Online Supplementary Table S2). Despite a wide range of values, we found that the serum ferritin level in women was particularly high, with an average value exceeding three times the accepted normal level. Men and women (adult patients) exhibited a low normal level of TS (means of 22%). However, young patients were iron deficient, with a mean TS of 14.9% and decreased serum iron (Table 1). We also measured serum hepcidin levels by liquid chromatographic-tandem mass spectrometry (LC-MSMS). In all groups, the level of serum hepcidin was within the normal range (mean, 12.9±4 ng/mL for men, 6.4±2 ng/mL for women and 6.6±1 ng/mL for children; the normal range is 1-20 ng/mL) (Table 1).
Table 1.
Iron-related biological parameters of the untreated and treated Type 1 Gaucher disease (GD1) cohorts.
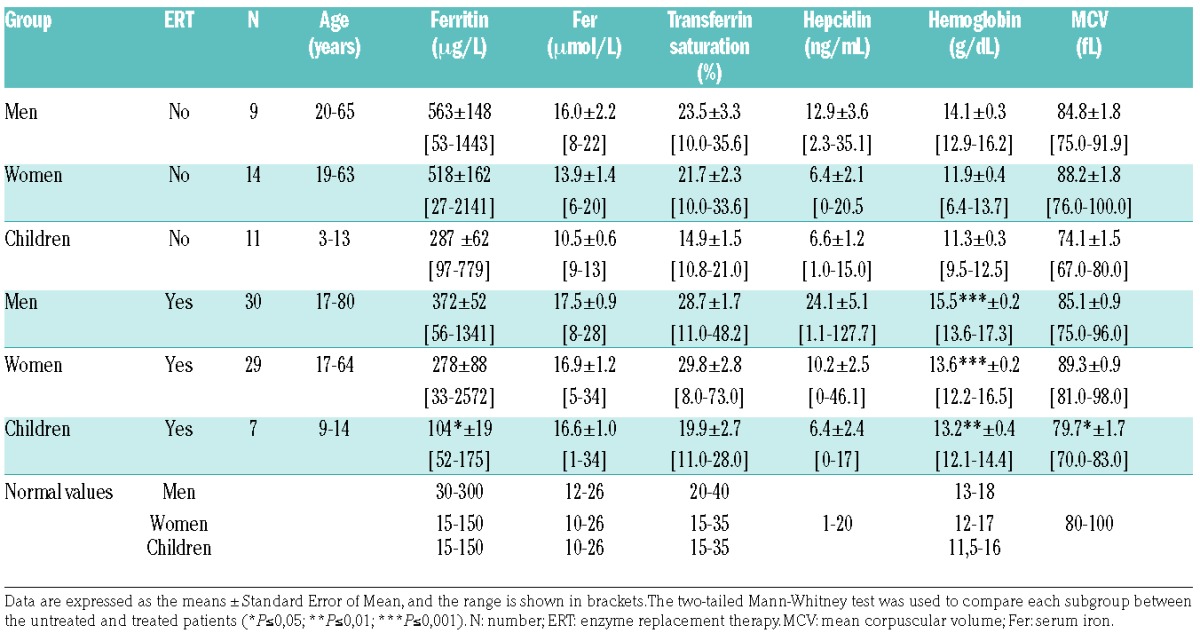
As expected, anemia was observed in 33% of our patients (40% of children, 43% of women and one man, 11%), although the hemoglobin level was only slightly reduced (Online Supplementary Table S3). Anemia was normocytic with respect to a mean corpuscular volume (MCV) of 74.1±1.5 fL in children (Table 1). Soluble transferrin receptor (sTfR) was also slightly increased with a mean of 2.40±0.24 mg/L (normal values ≤1.76 mg/L).
Hyperferritinemia is independent of the global iron status and systemic inflammation
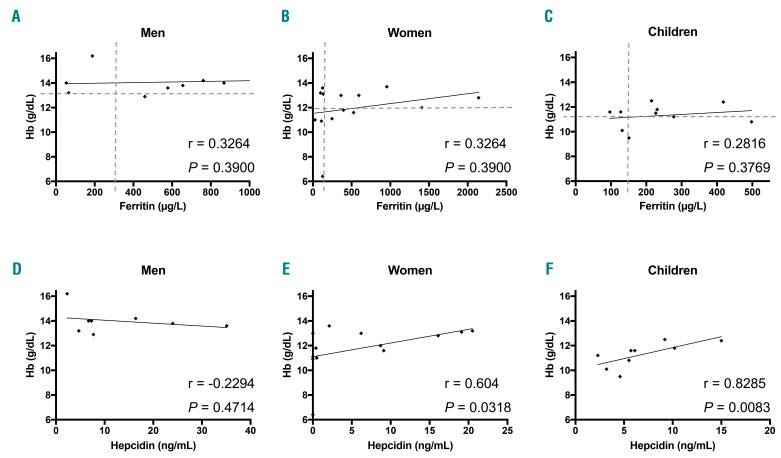
Because ferritin is stimulated during inflammation, we investigated the inflammatory status of our cohort of GD patients. All individuals included in the study were negative for CRP (<5 mg/L). We also measured the serum level of the pro-inflammatory interleukin 6 (IL-6) in 22 patients (mix of treated and untreated patients) and found that this cytokine was not induced (data not shown), suggesting an absence of systemic inflammation. We conclude that hyperferritinemia is independent of the inflammatory state in our GD cohort. Furthermore, there was no correlation between serum ferritin and hemoglobin in untreated patients (Figure 1). There was even a positive correlation between hemoglobin and serum hepcidin in women and children, who were more affected by anemia in our cohort, excluding the eventual presence of an anemia of inflammation.
Figure 1.
Hemoglobin levels, serum ferritin and serum hepcidin values in untreated Gaucher disease (GD) patients. Correlation of the hemoglobin concentration (Hb) with serum ferritin (A–C) and serum hepcidin (E–F) in men (A and D), women (B and E) and children (C and F), respectively. According to the Spearman test, no significant correlation was found (r<0.3; P>0.05) between hemoglobin and ferritin but correlations were positive between hemoglobin and hepcidin in women and children. The dotted lines represent the high normal value of ferritin on the x-axis and low normal level of hemoglobin on the y-axis.
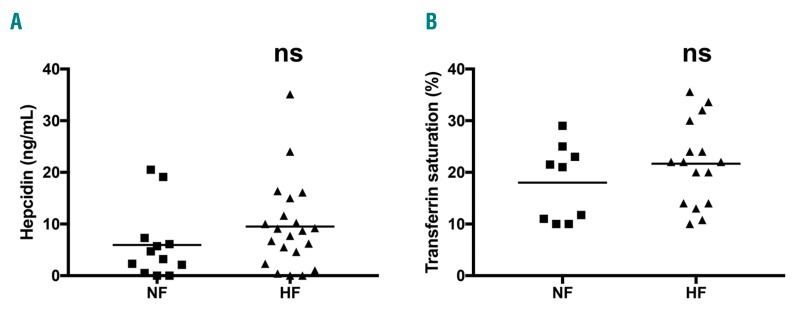
Because some untreated GD patients have normal ferritinemia (NF), we compared their levels of serum hepcidin and TS with those of untreated patients with hyperferritinemia (HF) (Figure 2). For both parameters, no significant differences were found between NF and HF groups, and correlation between serum hepcidin and ferritin was not significant in any group of the cohort (Online Supplementary Figure S1). Thus, the ferritin level in GD patients is increased independently of systemic inflammation, the iron pool and the serum hepcidin level.
Figure 2.
Serum hepcidin level and transferrin saturation (TS) are independent of the ferritin status. Serum hepcidin (A) and TS (B) levels were measured in the normal ferritin (NF) and hyperferritin (HF) untreated patient groups. The means are represented by the horizontal line. According to a two-tailed Mann-Whitney test, no significant differences were observed.
Hyperferritinemia reflects local iron sequestration in Gaucher cells
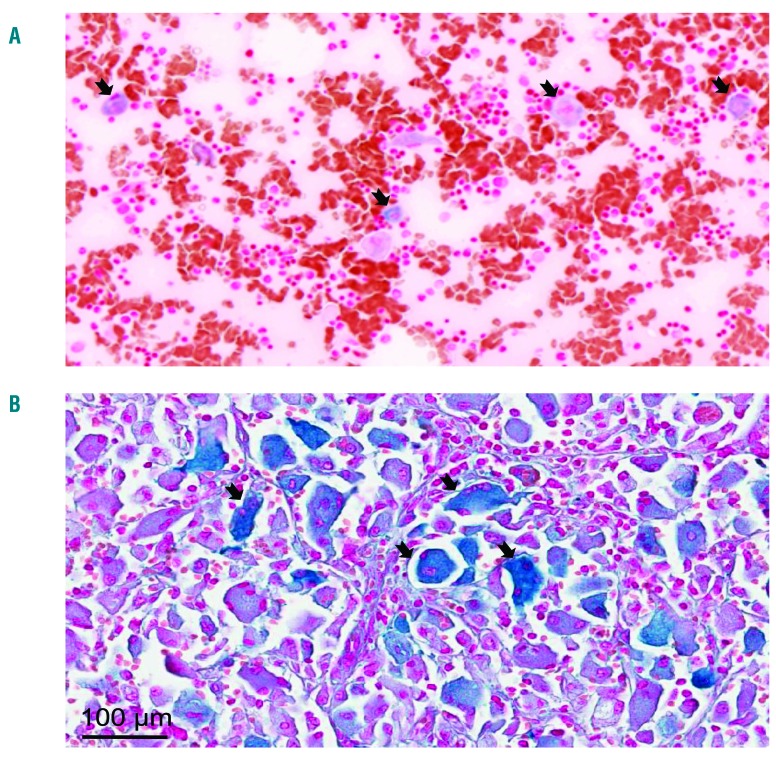
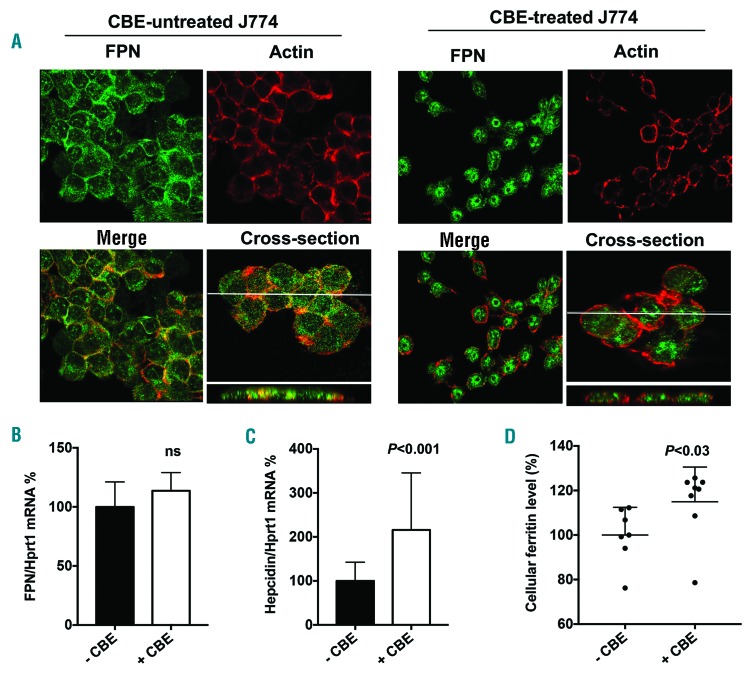
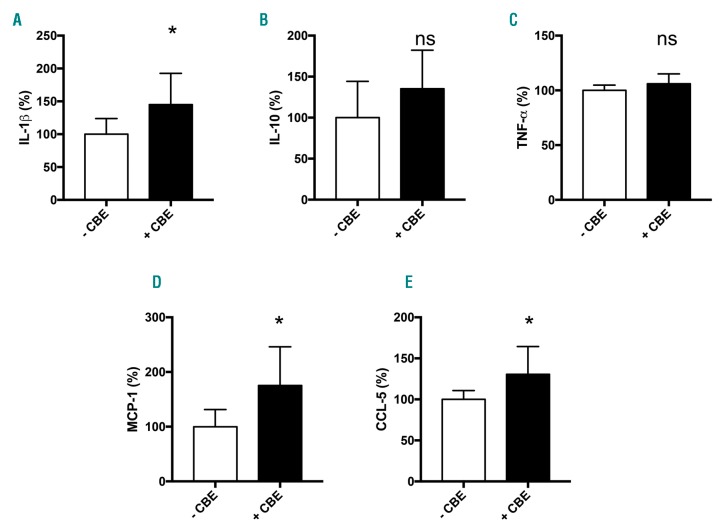
Serum ferritin is a primary marker of tissue iron overload; thus, we investigated whether hyperferritinemia might reflect local iron sequestration in Gaucher cells. Perl’s staining on the myelogram of one patient and on histological sections of the spleen from 2 patient biopsies showed high iron accumulation in Gaucher cells in both organs (Figure 3A and B, respectively). We noticed a high variation in the amount of accumulated iron within these Gaucher cells, particularly in the spleen. To investigate the underlying mechanism of this iron sequestration, we decided to mimic the Gaucher phenotype in vitro using the J774 macrophagic cell line incubated with the GCerase inhibitor CBE. The inhibition of GCerase activity in the presence of CBE was confirmed by flow cytometry showing a decreased fluorescence of its PFB-FDGlu substrate (Online Supplementary Figure S2). We hypothesized that the inhibition of GCerase activity could affect the protein expression of the iron exporter FPN (Figure 4). In the absence of CBE, FPN protein staining was strongly observed both at the plasma membrane localized with actin and in the subapical compartment, reminiscent of the known intracellular diffuse distribution of the FPN protein.16 However, when added to the culture media at a final concentration of 1 mM for 96 h, CBE dramatically reduced the level of FPN membrane expression (Figure 4A). We also explored the expression pattern of CD11b, a macrophage cell surface protein, which was found not to be affected by CBE treatment (Online Supplementary Figure S3), confirming specificity in FPN regulation by CBE. The decrease in the FPN protein level was not associated with decreased FPN mRNA, the level of which was slightly but not significantly increased (Figure 4B), indicating a post-translational downregulation of FPN expression due to GCerase activity inhibition. Furthermore, FPN downregulation was associated with increased level of cellular ferritin in CBE-treated cells, reminiscent of an iron sequestration in Gaucher cells (Figure 4D). Because the post-translational downregulation of FPN may involve hepcidin and macrophages can produce hepcidin locally, we quantified the expression level of the Hamp gene encoding hepcidin in J774 cells under the same conditions. We found that inhibition of GCerase activity significantly increased the mRNA level of hepcidin, which may lead, at least in part, to a reduction in FPN protein via an autocrine-paracrine interaction and resulting in iron retention in these cells (Figure 4C). Since hepcidin in liver was found to be induced by inflammatory cytokines, likely by IL-6 or IL-1β, we also explored the J774 cells inflammatory profile by quantifying secreted cytokines and chemokines in their supernatant. under CBE treatment, the levels of IL-1β, MCP-1 and CCL-5 levels were increased, the levels of IL-10 and TNF-α levels were not affected, and INF-γ, IL-6 and IL-12 remained under limit of detection (Figure 5). Thus, one can postulate that increased hepcidin in CBE-treated J774 macrophages is dependent on a local inflammatory environment.
Figure 3.
Iron sequestration in Gaucher cells. Tissue iron content was determined by Perl’s staining of medullar smear (A) and spleen sections (B). The large cells with a laminated aspect were Gaucher cells. The representative images show iron deposition mostly in Gaucher cells. The classical description of Gaucher cells (black arrows) is limited to cells 20–100 μm in diameter with eccentrically placed nuclei and cytoplasm with characteristic crinkles and striations. Images were taken at 20X magnification and a higher magnification (40X).
Figure 4.
Impact of glucocerebrosidase activity inhibition on ferroportin (FPN) and hepcidin expression in the J774 cell line. J774 cells were incubated with 1 mM CBE (+CBE) or with vehicle (-CBE) for 96 hours (h). (A) Staining of FPN and actin were performed as described in the Methods section. FPN is labeled in green and actin in red. In the absence of CBE, FPN is stained mostly at the plasma membrane with some intracellular extent. In the presence of CBE, FPN membrane staining was reduced, and its localization was mostly intracellular. The cross-section images demonstrated a significant overlap of FPN and actin staining in the -CBE condition but not in the +CBE condition. Images were taken by confocal microscopy (60X). (B and C) Quantification of the mRNA expression levels of FPN (B) and hepcidin (C) from treated and untreated J774 cells. Data were normalized by the housekeeping transcript Hprt1 and expressed as the percentage of the -CBE group mean±Standard Error of Mean. Mann-Whitney test was used to compare RNA levels. (D) Quantification of ferritin in cellular extracts from treated and untreated J774 cells. Data were expressed as percentage of the control mean. Medians are represented by the horizontal line. According to a two-tailed Mann-Whitney test, the level of cellular ferritin was significantly higher in the CBE treated cells; P=0.021.
Figure 5.
Impact of CBE treatment on J774 inflammatory profile. IL-1β, IL-10, MCP-1, CCL-5 and TNF-α were quantified in supernatant of J774 cells after incubation with (+CBE) and without (-CBE) CBE for 96 hours (h). Mann-Whitney test was used to compare cytokine levels.
The improvement of biological abnormalities by enzyme replacement therapy confirms the local iron sequestration hypothesis
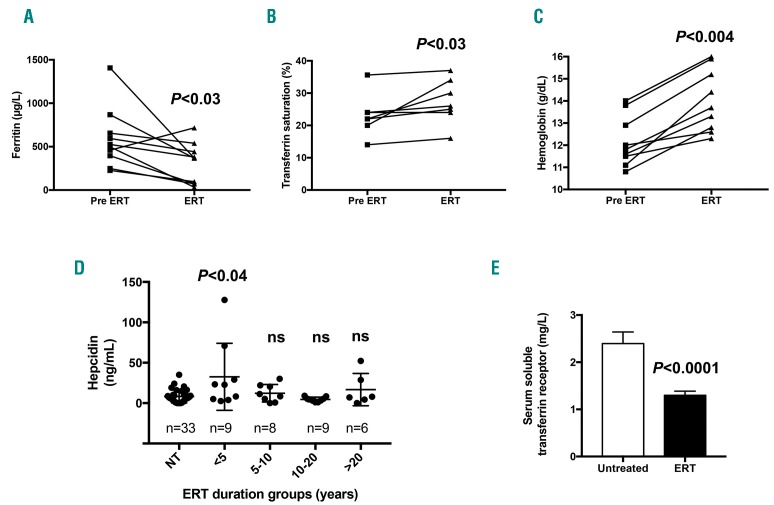
Serum ferritin was significantly reduced in children (104 vs. 287 μg/L; P=0.008). A trend toward reduced values was observed in adults (Table 1). Hyperferritinemia was observed in 42% of treated rather than 65% of untreated patients (P=0.02) (Online Supplementary Table S2). This amelioration was more pronounced in children, with hyperferritinemia observed in 14% of treated versus 73% of untreated patients (P=0.008). ERT also tended to improve TS, with a mean value of 28.7% in men, 29.8% in women and 19.9% in children (Table 1). Regarding the hepcidin response, we found that ERT led to slightly increased serum hepcidin levels in men. However, in women and children, the serum hepcidin levels remained unchanged, most likely because hemoglobin in these two groups was lower and may maintain hepcidin levels within the minimal range for erythropoiesis iron availability. ERT markedly increased the hemoglobin levels, and none of the treated patients remained anemic (Online Supplementary Table S3). Indeed, the average hemoglobin levels increased by 1.4 g/dL in men, 1.7 g/dL in women and 1.9 g/dL in the pediatric group (Table 1). Moreover, the longitudinal monitoring of the biological parameters of patients before/after ERT analyzed by a paired comparison significantly highlighted the tendencies observed in the global cohort study. This patient follow up demon strated reduced ferritin levels, increased TS and improved hemoglobin levels, suggesting the involvement of iron release and underlying the need for its bioavailability for erythropoiesis recovery (Figure 6A–C). We also quantified the serum hepcidin level at different time points during ERT. Interestingly, we observed that the kinetics of systemic hepcidin secretion reflected a positive and transient adaptive response against iron release in circulation. Compared to untreated patients, the hepcidin level increased significantly between six months and five years of treatment and then returned to the baseline value five years post ERT (Figure 6D). In addition, we also observed significantly lower serum soluble transferrin receptor levels in all treated patients than in untreated patients (Figure 6E).
Figure 6.
Impact of ERT on iron metabolism. Paired comparison of the levels of ferritin (A), TS (B) and hemoglobin (C) in patients before (pre-ERT) and after initiation of enzyme replacement treatment (ERT) (from 6 months at least). (D) The hepcidin level was measured in untreated (NT) and treated patients during different periods of time. Each group was compared with the NT group. The hepcidin level was transiently increased during the first five years of ERT (<5). (E) Comparison of the levels of serum soluble transferrin receptor in untreated (n=24) versus treated (ERT; n=22) patients. (A–C) A paired Wilcoxon test was used; (D and E) an unpaired Mann-Whitney test was used.
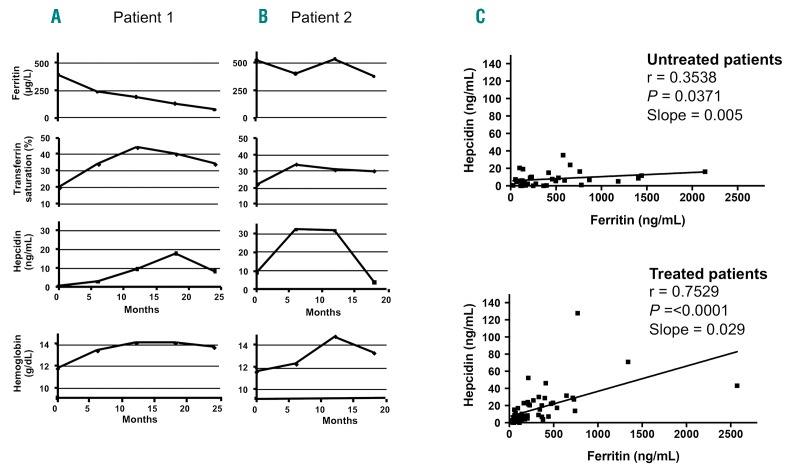
We monitored the time course of different biological parameters in 2 representative patients: one who began the ERT during adolescence and the other who began treatment later in adulthood. The 2 patients were followed up to 25 months post ERT, and the ERT efficacy regarding iron parameters was compared between them (Figure 7A and B). In Patient 1, an 18-year-old woman, the ferritin level decreased dramatically after only five months of ERT, and this decline was maintained continuously over time (Figure 7A). Consequently, the TS began to increase, reaching a maximal level (approximately 40%) at 10 months post ERT, and then returned to a steady state value of approximately 30%. The kinetics of systemic hepcidin secretion was again positive and transient with a maximal level at 18 months post ERT, allowing the TS to reach normal values. This controlled iron release was beneficial for restoring hemoglobin synthesis because its serum level requires ten months post ERT to stabilize. Similar kinetic patterns were confirmed in another young treated patient (Online Supplementary Figure S4), although the TS values and intermediate time data were missing. Patient 2 was a woman who received ERT for the first time at 52 years of age. Interestingly, the decrease in the ferritin level was not evident as late as 15 months post ERT. The kinetic patterns of the other parameters were similar to those of Patient 1 (Figure 7B).
Figure 7.
Recovery of hepcidin control on iron metabolism in treated Gaucher disease (GD) patients. (A and B) Time course of iron-related parameters in 2 treated patients from enzyme replacement therapy (ERT) initiation until 18–25 months after ERT initiation. Patient 1: 18-year-old woman; Patient 2: 52-year-old woman. (C) According to the Spearman test, hepcidin/ferritin correlation in the untreated and treated patients r and P were shown for each condition and slope of linear regression.
Finally, we analyzed the correlation between the hepcidin and ferritin values in untreated and treated GD1 patients. Compared with that in untreated patients, the correlation between both parameters was significantly improved under ERT with a higher slope (Figure 7C). Indeed, the hepcidin response levels were more adapted toward the ferritin values, confirming the restored systemic hepcidin control on iron metabolism. Furthermore, this recovery of controlled iron metabolism was associated with a reduction in the soluble transferrin receptor level in treated patients (Figure 6E).
Discussion
This study demonstrated for the first time that hyperferritinemia observed in GD1 patients is related to abnormal iron metabolism and the sequestration of iron in Gaucher cells. ERT allows for the release of iron, improves the iron status, and corrects the anemia. In addition to spleen dysfunction, bone marrow infiltration by Gaucher cells and ineffective erythropoiesis, part of the anemia can likely be explained by this abnormal iron metabolism.
From a large cohort of 90 GD1 patients, we showed that most of them (65%) exhibited high levels of serum ferritin, with one-third presenting moderate anemia. These results are in line with previous data.9–11 Serum iron and TS were in a normal range as previously shown in adult GD1 patients.4,9 However, the pediatric population exhibited decreased iron release into plasma as shown by a low TS and significant anemia. Indeed, children were the most affected patients, most likely because the iron requirements are very high during childhood due to the high energy intake and active erythropoiesis, limiting the body pool of iron.31 In our cohort of GD patients, hyperferritinemia was not related to an obvious systemic inflammation because neither CRP nor IL-6 were detected. Furthermore, there was no difference in hepcidin level, which is also induced by inflammation,32,33 between the groups of GD patients with and without hyperferritinemia. A normal serum hepcidin concentration despite hyperferritinemia has already been reported by Lorenz et al. in a limited number of GD1 patients (n=11).11 Although Medrano-Engay et al. reported increased hepcidin levels in 3 untreated GD1 patients,10 our data indicate that the ferritin levels in GD patients are increased independently of the hepcidin levels and inflammation. Indeed, our measures of hepcidin were analyzed in a larger cohort of untreated GD1 patients (n=34) and interpreted in the context of other iron metabolism parameters.
Previous reports have documented that GD may trigger pro-inflammatory and anti-inflammatory pathways including IL-6 coming from monocytes/macrophages lineages, and pathways due to glucocerebroside accumulation.34–36 These pathways could lead to high ferritin levels and increased hepcidin transcription. However, the pathological manifestations of GD are highly variable, leading to different levels of accumulated glucocerebroside among patients and individually within organs. Thus, one may speculate that the management of our patients was performed before the critical threshold of glucosylceramide storage was reached, leading to the absence of systemic inflammation in these patients. Moreover, the appearance of local inflammation around Gaucher cells cannot be excluded. Indeed, Gaucher cells have been shown to exhibit a phenotype resembling activated M2 macrophages not expressing pro-inflammatory cytokines; however, they are surrounded by macrophages with an M1 signature.37
Under steady-state conditions, the serum ferritin concentration is well correlated with total body iron stores.38 The sequestration of iron in Gaucher cells may then account for the increased production and secretion of ferritin. Of interest, iron accumulation in the macrophage compartment has already been described in GD.39–41 Herein, using Perl’s staining of a spleen biopsy and medullar smear from one GD patient, we confirmed a significant iron overload in Gaucher cells. The origin of this iron accumulation is not fully elucidated, but evidence for increased erythrophagocytic activity in Gaucher cells with the ingestion of mainly mature erythrocytes has already been provided.42,43 Our data suggested that iron efflux is also affected in these cells. Indeed, the expression of FPN, the sole iron exporter, was significantly diminished upon glucocerebrosidase inhibition and accumulation of glucocerebroside into J774 macrophage cells. Because hepcidin transcripts were also enhanced, we postulate that one of the mechanisms involved in this FPN downregulation may be the induction of local hepcidin in this in vitro system. Macrophages have already been shown to be able to express endogenous hepcidin.29 Our data confirmed these reports and also suggested that, in Gaucher cells, the hepcidin/ferroportin axis may be active via an autocrine/paracrine pathway. Whether hepcidin is induced via a local inflammatory state or directly via lipid-mediated pathways remains to be determined. However, one cannot exclude the possibility that FPN may also be directly affected by lipid-mediated pathways in addition to local hepcidin effect.
Enzyme replacement therapy was associated with a notable reversal of hyperferritinemia that appeared to correlate with iron release from Gaucher cells. Indeed, longitudinal monitoring of 10 patients under ERT showed the opposite time course of ferritin and rates of TS. This improvement in iron availability occurred under the control of systemic hepcidin as evidenced by the moderate elevation in TS compared to the strong decrease in ferritinemia. This is also reinforced by the improvement in the correlation between serum hepcidin and ferritinemia post ERT. We postulate that the recovery of hemoglobin levels under ERT may also be partly due to this iron availability. This was confirmed by the lower level of soluble transferrin receptor in treated patients. Similarly, an increased number of reticulocytes in treated patients would have helped to highlight this mechanism, but unfortunately these data were not available. However, iron restriction may not be the only cause of GD anemia, as we have already shown that GD patients exhibit an ineffective erythropoiesis,7 as well as altered morphological properties of RBCs that could accelerate their erythrophagocytosis.43,44 In this study, the efficacy of ERT was particularly demonstrated in the pediatric population in which the iron requirement is high. Likewise, the low ferritin responsiveness in Patient 2 under ERT may imply a low efficacy of this treatment in older patients, but this hypothesis requires additional studies on a larger number of patients. Interestingly, the level of serum hepcidin was increased after ERT. This is probably to fight against iron excess due to the improvement of iron release from Gaucher cells, and to regain a balanced iron status.
In conclusion, our study revealed for the first time that hyperferritinemia in GD is related to the sequestration of iron in Gaucher cells due to the downregulation of the iron exporter ferroportin. Hepcidin from macrophages, rather than the systemic peptide, seems to be responsible for this FPN repression. ERT restored the iron availability and improved the anemia in these patients. Overall, these results provide new perspectives for better management of GD patients. Indeed, the measurement of liver iron content by magnetic resonance imaging and the analysis of iron status must be systematically evaluated to prevent iron deficiency in patients.
Supplementary Material
Acknowledgments
We are very grateful to the patients who kindly contributed to this study. Inserm and Paris Diderot University, the Laboratory of excellence, GR-Ex, Paris, France, supported this work.
Footnotes
Check the online version for the most updated information on this article, online supplements, and information on authorship & disclosures: www.haematologica.org/content/103/4/587
Funding
The labex GR-Ex, reference ANR-11-LABX-0051 is funded by the program “Investissements d’Avenir” of the French National Research Agency, reference ANR-11-IDEX-0005-02. We thank Nathalie Dessendier, Nicolas Ducrot and Olivier Thibaudeau for their technical support, Samira Benadda for the confocal microscope support, and Karima Yousfi for providing assistance in collecting the patient data.
References
- 1.Brady RO, Kanfer JN, Shapiro D. Metabolism of glucocerebrosides. II. Evidence of an enzymatic deficiency in Gaucher’s disease. Biochem Biophys Res Commun. 1965;18:221–225. [DOI] [PubMed] [Google Scholar]
- 2.Grabowski GA. Phenotype, diagnosis, and treatment of Gaucher’s disease. Lancet Lond Engl. 2008;372(9645):1263–1271. [DOI] [PubMed] [Google Scholar]
- 3.Charrow J, Andersson HC, Kaplan P, et al. The Gaucher registry: demographics and disease characteristics of 1698 patients with Gaucher disease. Arch Intern Med. 2000;160(18):2835–2843. [DOI] [PubMed] [Google Scholar]
- 4.Stein P, Yu H, Jain D, Mistry PK. Hyperferritinemia and iron overload in type 1 Gaucher disease. Am J Hematol. 2010;85(7):472–476. [DOI] [PMC free article] [PubMed] [Google Scholar]
- 5.Regenboog M, van Kuilenburg ABP, Verheij J, Swinkels DW, Hollak CEM. Hyperferritinemia and iron metabolism in Gaucher disease: Potential pathophysiological implications. Blood Rev. 2016;30(6):431–437 [DOI] [PubMed] [Google Scholar]
- 6.Franco M, Collec E, Connes P, et al. Abnormal properties of red blood cells suggest a role in the pathophysiology of Gaucher disease. Blood. 2013;121(3):546–555. [DOI] [PubMed] [Google Scholar]
- 7.Reihani N, Arlet J-B, Dussiot M, et al. Unexpected macrophage-independent dyserythropoiesis in Gaucher disease. Haematologica. 2016;101(12):1489–1498. [DOI] [PMC free article] [PubMed] [Google Scholar]
- 8.Barton NW, Brady RO, Dambrosia JM, et al. Replacement therapy for inherited enzyme deficiency–macrophage-targeted glucocerebrosidase for Gaucher’s disease. N Engl J Med. 1991;324(21):1464–1470. [DOI] [PubMed] [Google Scholar]
- 9.Mekinian A, Stirnemann J, Belmatoug N, et al. Ferritinemia during type 1 Gaucher disease: mechanisms and progression under treatment. Blood Cells Mol Dis. 2012;49(1):53–57. [DOI] [PubMed] [Google Scholar]
- 10.Medrano-Engay B, Irun P, Gervas-Arruga J, et al. Iron homeostasis and infIammatory biomarker analysis in patients with type 1 Gaucher disease. Blood Cells Mol Dis. 2014;53(4):171–175. [DOI] [PubMed] [Google Scholar]
- 11.Lorenz F, Pawłowicz E, Klimkowska M, et al. Ferritinemia and serum inflammatory cytokines in Swedish adults with Gaucher disease type 1. Blood Cells Mol Dis. 2018;68:35–42. [DOI] [PubMed] [Google Scholar]
- 12.Finch CA, Bellotti V, Stray S, et al. Plasma ferritin determination as a diagnostic tool. West J Med. 1986;145(5):657–663. [PMC free article] [PubMed] [Google Scholar]
- 13.Nicolas G, Bennoun M, Devaux I, et al. Lack of hepcidin gene expression and severe tissue iron overload in upstream stimulatory factor 2 (USF2) knockout mice. Proc Natl Acad Sci USA. 2001;98(15):8780–8785. [DOI] [PMC free article] [PubMed] [Google Scholar]
- 14.Pigeon C, Ilyin G, Courselaud B, et al. A new mouse liver-specific gene, encoding a protein homologous to human antimicrobial peptide hepcidin, is overexpressed during iron overload. J Biol Chem. 2001;276(11):7811–7819. [DOI] [PubMed] [Google Scholar]
- 15.Nemeth E, Tuttle MS, Powelson J, et al. Hepcidin regulates cellular iron efflux by binding to ferroportin and inducing its internalization. Science. 2004;306(5704): 2090–2093. [DOI] [PubMed] [Google Scholar]
- 16.Delaby C, Pilard N, Gonçalves AS, Beaumont C, Canonne-Hergaux F. Presence of the iron exporter ferroportin at the plasma membrane of macrophages is enhanced by iron loading and down-regulated by hepcidin. Blood. 2005;106(12):3979–3984. [DOI] [PubMed] [Google Scholar]
- 17.Brasse-Lagnel C, Karim Z, Letteron P, et al. Intestinal DMT1 cotransporter is downregulated by hepcidin via proteasome internalization and degradation. Gastroenterology. 2011;140(4):1261–1271. [DOI] [PubMed] [Google Scholar]
- 18.Mena NP, Esparza A, Tapia V, Valdés P, Núñez MT. Hepcidin inhibits apical iron uptake in intestinal cells. Am J Physiol Gastrointest Liver Physiol. 2008;294(1):G192–198. [DOI] [PubMed] [Google Scholar]
- 19.Nemeth E, Rivera S, Gabayan V, et al. IL-6 mediates hypoferremia of inflammation by inducing the synthesis of the iron regulatory hormone hepcidin. J Clin Invest. 2004;113(9):1271–1276. [DOI] [PMC free article] [PubMed] [Google Scholar]
- 20.Weiss G, Goodnough LT. Anemia of chronic disease. N Engl J Med. 2005;352(10):1011–1023. [DOI] [PubMed] [Google Scholar]
- 21.Kulaksiz H, Theilig F, Bachmann S, et al. The iron-regulatory peptide hormone hepcidin: expression and cellular localization in the mammalian kidney. J Endocrinol. 2005;184(2):361–370. [DOI] [PubMed] [Google Scholar]
- 22.Moulouel B, Houamel D, Delaby C, et al. Hepcidin regulates intrarenal iron handling at the distal nephron. Kidney Int. 2013;84(4):756–766. [DOI] [PubMed] [Google Scholar]
- 23.Gnana-Prakasam JP, Martin PM, Mysona BA, et al. Hepcidin expression in mouse retina and its regulation via lipopolysaccharide/Toll-like receptor-4 pathway independent of Hfe. Biochem J. 2008;411(1):79–88. [DOI] [PMC free article] [PubMed] [Google Scholar]
- 24.Schwarz P, Kübler JAM, Strnad P, et al. Hepcidin is localised in gastric parietal cells, regulates acid secretion and is induced by Helicobacter pylori infection. Gut. 2012;61(2):193–201. [DOI] [PubMed] [Google Scholar]
- 25.Kulaksiz H, Fein E, Redecker P, et al. Pancreatic beta-cells express hepcidin, an iron-uptake regulatory peptide. J Endocrinol. 2008;197(2):241–249. [DOI] [PubMed] [Google Scholar]
- 26.Merle U, Fein E, Gehrke SG, Stremmel W, Kulaksiz H. The iron regulatory peptide hepcidin is expressed in the heart and regulated by hypoxia and inflammation. Endocrinology. 2007;148(6):2663–2668. [DOI] [PubMed] [Google Scholar]
- 27.Frazier MD, Mamo LB, Ghio AJ, Turi JL. Hepcidin expression in human airway epithelial cells is regulated by interferon-γ. Respir Res. 2011;12:100. [DOI] [PMC free article] [PubMed] [Google Scholar]
- 28.Bekri S, Gual P, Anty R, et al. Increased Adipose Tissue Expression of Hepcidin in Severe Obesity Is Independent From Diabetes and NASH. Gastroenterology. 2006;131(3):788–796. [DOI] [PubMed] [Google Scholar]
- 29.Peyssonnaux C, Zinkernagel AS, Datta V, et al. TLR4-dependent hepcidin expression by myeloid cells in response to bacterial pathogens. Blood. 2006;107(9):3727–3732. [DOI] [PMC free article] [PubMed] [Google Scholar]
- 30.Lefebvre T, Dessendier N, Houamel D, et al. LC-MS/MS method for hepcidin-25 measurement in human and mouse serum: clinical and research implications in iron disorders. Clin Chem Lab Med. 2015;53(10):1557–1567. [DOI] [PubMed] [Google Scholar]
- 31.Domellöf M, Braegger C, Campoy C, et al. Iron requirements of infants and toddlers. J. Pediatr. Gastroenterol. Nutr. 2014;58(1):119–129. [DOI] [PubMed] [Google Scholar]
- 32.Nicolas G, Chauvet C, Viatte L, et al. The gene encoding the iron regulatory peptide hepcidin is regulated by anemia, hypoxia, and inflammation. J Clin Invest. 2002;110(7):1037–1044. [DOI] [PMC free article] [PubMed] [Google Scholar]
- 33.Nemeth E, Rivera S, Gabayan V, et al. IL-6 mediates hypoferremia of inflammation by inducing the synthesis of the iron regulatory hormone hepcidin. J Clin Invest. 2004;113(9):1271–1276. [DOI] [PMC free article] [PubMed] [Google Scholar]
- 34.Allen MJ, Myer BJ, Khokher AM, Rushton N, Cox TM. Pro-inflammatory cytokines and the pathogenesis of Gaucher’s disease: increased release of interleukin-6 and interleukin-10. QJM Mon. J Assoc Physicians. 1997;90(1):19–25. [DOI] [PubMed] [Google Scholar]
- 35.Barak V, Acker M, Nisman B, et al. Cytokines in Gaucher’s disease. Eur Cytokine Netw. 1999;10(2):205–210. [PubMed] [Google Scholar]
- 36.Pandey MK, Burrow TA, Rani R, et al. Complement drives glucosylceramide accumulation and tissue inflammation in Gaucher disease. Nature. 2017;543(7643):108–112. [DOI] [PubMed] [Google Scholar]
- 37.Boven LA, van Meurs M, Boot RG, et al. Gaucher cells demonstrate a distinct macrophage phenotype and resemble alternatively activated macrophages. Am J Clin. Pathol. 2004;122(3):359–369. [DOI] [PubMed] [Google Scholar]
- 38.Hunt JR. How important is dietary iron bioavailability? Am J Clin Nutr. 2001;73(1):3–4. [DOI] [PubMed] [Google Scholar]
- 39.Bogoeva B, Petrusevska G. Immunohistochemical and ultrastructural features of Gaucher’s cells–five case reports. Acta Medica Croat. Cas. Hravatske Akad Med Znan. 2001;55(3):131–134. [PubMed] [Google Scholar]
- 40.Lee RE, Balcerzak SP, Westerman MP. Gaucher’s disease. A morphologic study and measurements of iron metabolism. Am J Med. 1967;42(6):891–898. [DOI] [PubMed] [Google Scholar]
- 41.Lorber M. Adult-type Gaucher’s disease: a secondary disorder of iron metabolism. Mt Sinai J Med N Y. 1970;37(4):404–417. [PubMed] [Google Scholar]
- 42.Bitton A, Etzell J, Grenert JP, Wang E. Erythrophagocytosis in Gaucher cells. Arch Pathol Lab Med. 2004;128(10):1191–1192. [DOI] [PubMed] [Google Scholar]
- 43.Bratosin D, Tissier J-P, Lapillonne H, et al. A cytometric study of the red blood cells in Gaucher disease reveals their abnormal shape that may be involved in increased erythrophagocytosis. Cytometry B Clin Cytom. 2011;80(1):28–37. [DOI] [PubMed] [Google Scholar]
- 44.Franco M, Collec E, Connes P, et al. Abnormal properties of red blood cells suggest a role in the pathophysiology of Gaucher disease. Blood. 2013;121(3):546–555. [DOI] [PubMed] [Google Scholar]
Associated Data
This section collects any data citations, data availability statements, or supplementary materials included in this article.


