Abstract
Different Doppler echocardiography (DE) models have been proposed for estimation of mean pulmonary arterial pressures (PAMP) from tricuspid regurgitation (TR) jet velocity. We aimed to compare four TR-derived DE models in predicting the PAMP measured by right heart catheterization (RHC) in different groups of precapillary pulmonary hypertension (PH). A total of 287 patients with hemodynamically pre-capillary PH were enrolled (mean age = 51 ± 17.4 years, 59.9% female). All patients underwent DE before RHC (< 3 h) and four formulae (F) were used for TR-derived PAMP estimation (PAMP-DE). These were as follows: F1 = Chemla (0.61 × systolic pulmonary artery pressure [PASP] + 2); F2 = Friedberg (0.69 × PASP − 0.22), F3 = Aduen (0.70 × PASP); and F4 = Bech-Hanssen (0.65 × PASP − 1.2). The PASP and PAMP (mmHg) measured by RHC were 89.1 ± 30.4 and 55.8 ± 20.8, respectively. In the overall PH group, DE estimates for PASP (r = 0.59, P = 0.001) and PAMP (r = 0.56, P = 0.001 for all) showed significant correlations with corresponding RHC measures. Concordance was noted between Chemla and Bech-Hanssen, and Aduen and Bech-Hanssen. The Bland–Altman plot showed that Chemla and Bech-Hanssen overestimated and Friedberg and Aduen underestimated PAMP-RHC measures. Paired-t test showed significant systematic biases for Aduen and Bech-Hanssen while Passing-Bablok non-parametric analysis revealed significant systematic biases all four PAMP-DE estimates. There was poor agreement between PAMP-RHC measures and PAMP-DE deciles (Kappa values were 0.112, 0.097, 0.095, and 0.121, respectively). This study showed a poor agreement between PAMP-DE estimates by four TR-derived formulae and PAMP-RHC in patients with PH, regardless of the etiology. However, these results can not be fully extrapolated to a normal population and did not address the reliability of DE estimates for PH screening procedures.
Keywords: pulmonary hypertension, pulmonary artery pressure, echocardiography, right heart catheterization, agreement
Introduction
According to the current practice guidelines, pulmonary hypertension (PH) is defined as an increase in mean pulmonary arterial (PA) pressure (PAMP) ≥ 25 mmHg at rest as assessed by right heart catheterization (RHC). Although RHC is the method of choice for the diagnosis of PH, continuous wave Doppler echocardiography (DE) is frequently used as an initial screening method to estimate pulmonary pressures.1–3 Moreover, DE has been used as a non-invasive, inexpensive, and widely available method of monitoring disease progression over time in patients with PH. The most commonly used and studied method is the estimation of systolic PA pressure (PASP) by measuring the peak velocity of the tricuspid regurgitant (TR) jet using a modified Bernoulli equation.1–11 In this approach, right ventricular systolic pressure or PASP can then be estimated by adding the TR systolic pressure gradient to the estimated right atrial pressure (RAP) and this pressure is equal to PASP in the absence of pulmonic stenosis. However, the reliability of RAP estimation is considered to be an important limitation of the peak TR jet velocity method.2,4–6 Furthermore, accuracy of this non-invasive estimation of PAMP for initial screening and follow-up has remained an unmet need in this setting.12–21 The majority of DE methods proposed for the estimation of PAMP from TR jet velocity (PAMP-DE) have been based on the assumption of linearity between PASP and PAMP.12–23 However, utility of these DE methods across the subgroup of PH has not been evaluated.
The purpose of our study was to assess the reliability of the PASP and PAMP values estimated by TR jet-derived DE methods for corresponding PA pressures measured with RHC in an overall PH population and prespecified subgroups of PH.
Methods
In this study, a total of 287 patients with hemodynamically pre-capillary PH were enrolled (mean age = 51 ± 17.4 years, 59.9% female). Subgroups were as follows: idiopathic pulmonary arterial hypertension (IPAH) (n = 48); PAH associated with congenital heart disease and connective tissue disease (APAH-CHD, APAH-CTD) (n = 106 and 17); chronic thromboembolic PH (CTEPH) (n = 64); and other PH groups (n = 52). Hemodynamic definitions of pre-capillary PH and clinical diagnostic algorithms were initially performed according to the 2009 European Society of Cardiology / European Respiratory Society (ESC/ERS) PH Guidelines and retrospectively re-evaluated after the publication of the 2015 ESC/ERS PH Guidelines.1,2 Patients in whom PAMP was measured to be < 25 mmHg, which is the definitive threshold for PH, and patients with pulmonary arterial wedge pressure (PAWP) ≥ 15, indicating postcapillary PH, were excluded from the study.
Doppler echocardiographic assessments: All patients underwent DE before (< 3 h) RHC and DE was performed by two experienced echocardiographers according to the recommendations of American Society of Echocardiography (ASE) Guidelines for Right Ventricle Assessment endorsed by the European Association of Cardiovascular Imaging (EACVI).3,4 The PASP was calculated from the summation of TR peak systolic gradient value and mean RAP estimated from inferior vena cava (IVC) diameters. For IVC diameter < 2.1 cm that collapses > 50% with a sniff suggests a normal RAP of 3 mmHg (range = 0–5 mmHg), whereas an IVC diameter > 2.1 cm that collapses < 50 % with a sniff suggests a high RAP of 15 mmHg (range = 10–20 mmHg). In cases where the IVC diameter and collapse do not fit this criteria, an intermediate value of 8 mmHg (range =5–10 mmHg) was preferred for RAP estimation.
The PAMP-DE was indirectly derived from PASP using the four formulae (F) as follows: F1 = Chemla (0.61 ×PASP + 2);13 F2 = Friedberg (0.69 × PASP–0.22);15 F3 =Aduen (0.70 × PASP);16 and F4 = Bech-Hanssen (0.65 ×PASP – 1.2).18
The study protocol was approved by the Institutional Review Board and written informed consent was obtained from all patients before the DE and RHC assessments.
Statistical methods
Continuous variables were presented as mean ± standard deviation (SD); categorical variables were presented as percentage. Linear association between variables was assessed using Pearson correlation coefficient. Paired-t test was performed between means (PAMP-RHC vs. PAMP estimated by four DE equations) to detect any possible systematic bias. The degree of agreement (DOA) between continuous measurements of PAMP-RHC and four DE formulae were quantified through intraclass correlation coefficient (ICC), Lin’s concordance correlation coefficient, and Bland–Altman (BA) analysis. ICC < 0.4 indicates poor agreement, ICC in the range of 0.4–0.75 indicates moderate agreement, and ICC values > 0.75 indicate excellent agreement. The DOA between PAMP-RHC and PAMP-DE by four equations categorized into deciles was quantified through Kappa statistics: Kappa value < 0.2 indicates poor agreement; 0.2–0.4 fair agreement; 0.4–0.6 moderate agreement; 0.6–0.8 substantial agreement; and > 0.8 almost perfect agreement.24 Also, to assess the DOA between continuous variables, the Passing–Bablok non-parametric regression method was used. Passing–Bablok non-parametric regression provides intercept and slope with 95% confidence intervals (CI).25 The intercept assesses systematic bias; a CI below zero denotes a constant underestimation trend whereas values over zero denote an overestimation trend. The slope assesses proportional bias; a good agreement is present when its CI includes 1. In BA analysis, PAMP-RHC and PAMP estimated by four DE formulae plotted with line represen mean difference ± 1.96 SD (95% limits of agreement).26 A P value < 0.05 indicates statistical significance. All statistical analyses were performed by SAS v9.4 (SAS Institute, Inc.) and MedCalc Software (Trial version 11.2, Belgium).
Results
Patient characteristics are summarized in Table 1. The PASP and PAMP (mmHg) measured by confirmatory RHC were 89.1 ± 30.4 and 55.8 ± 20.8, respectively. Pulmonary vascular resistance (PVR) and systemic vascular resistance (SVR) were 9.7 ± 7 and 22.1 ± 8.1 Wood units (WU), respectively.
Table 1.
Baseline clinical, echocardiographic, and invasive characteristics.
| Age (years) | 51 ± 17.4 |
|---|---|
| Female sex (n (%)) | 172 (59.9) |
| PH subgroups (n (%)) | 287 |
| IPAH | 48 (16.7) |
| APAH-CTD | 17 (5.9) |
| APAH-CHD | 106 (36.9) |
| CTEPH | 64 (22.3) |
| Others | 52 (18.1) |
| Six-minute walking distance (m) | 248 ± 132 |
| NYHA class (median) | III |
| Echocardiographic variables | |
| PASP (mmHg) | 85.8 ± 25.6 |
| TAPSE (cm) | 1.88 ± 1.39 |
| LVEF (%) | 61.8 ± 8.3 |
| Invasive hemodynamic variables | |
| PASP (mmHg) | 89.1 ± 30.4 |
| PADP (mmHg) | 35.1 ± 16.9 |
| PAMP (mmHg) | 55.8 ± 20.8 |
| PVR (WU) | 9.7 ± 7.0 |
| SVR (WU) | 22.1 ± 8.1 |
| Cardiac index (L/min/m2) | 2.48 ± 0.79 |
IPAH, idiopathic pulmonary arterial hypertension; APAH, associated pulmonary arterial hypertension; CTD, connective tissue disorders; CHD, congenital heart disease; CTEPH, chronic thromboembolic pulmonary hypertension; NYHA, New York Heart Association; PASP, systolic pulmonary arterial pressure; TAPSE, tricuspid annular plane systolic excursion; LVEF, left ventricular ejection fraction; PADP, diastolic pulmonary arterial pressure; PAMP, mean pulmonary arterial pressure; PVR, pulmonary vascular resistance; SVR, systemic vascular resistance.
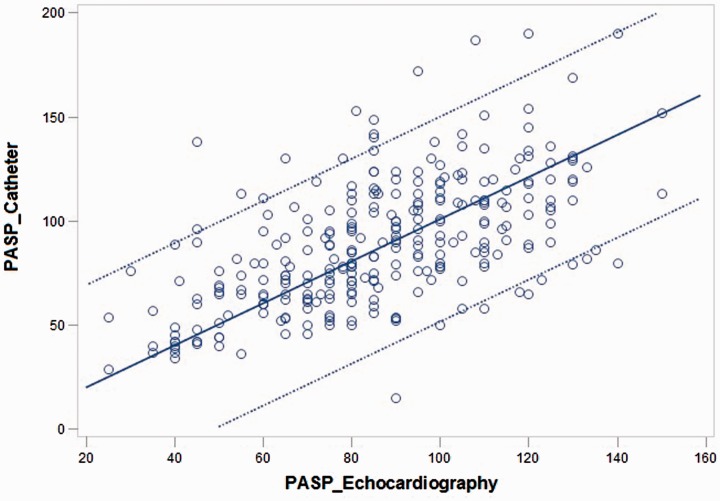
In the overall PH group, PASP-DE showed significant correlation to PASP-RHC (r = 0.593, P < 0.001) (Fig. 1). Similarly, PAMP-DE with the Chemla, Friedberg, Aduen, and Bech-Hanssen equations were found to be correlated with PAMP-RHC (r = 0.563, P < 0.001 for all).
Fig. 1.
Scatter plot between PASP measured by RHC and echocardiography (some spots are darker, which indicate that some patients have overlapping values).
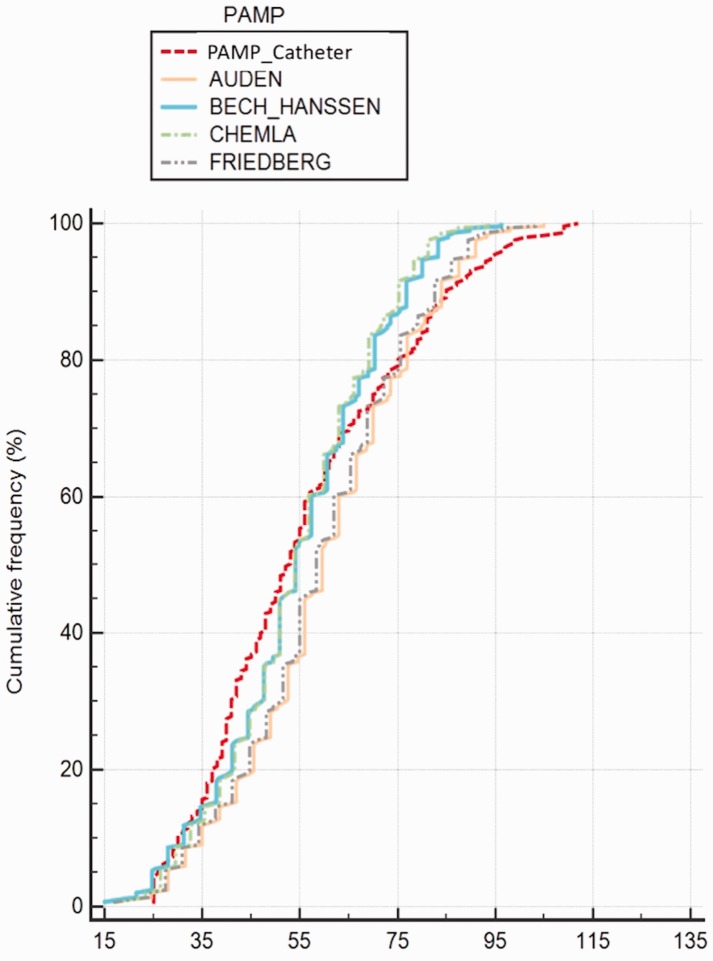
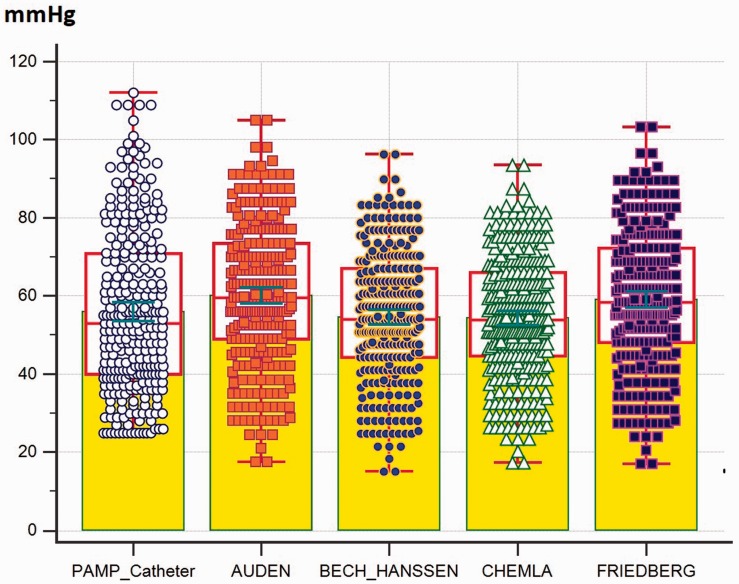
The ICC, Lin’s concordance coefficient, and Pearson correlation coefficient between PAMP-RHC and PAMP-DE by four equations were presented in Table 2. The cumulative frequency and individual values of PAMP-DE obtained by four equations vs. PAMP-RHC were presented in Figs. 2 and 4, respectively. In the visual assessment of cumulative frequency plot (Fig. 2), the Chemla, Friedberg, Aduen, and Bech-Hanssen equations provided concordant results, respectively.
Table 2.
Pearson correlation and absolute agreement (ICC and Lin’s coefficient) between PAMP_Catheter and different echocardiographic equations.
| Chemla | Friedberg | Auden | Bech-Hanssen | ||
|---|---|---|---|---|---|
| Pearson corelation coefficient | 0.563 (0.478–0.637) | 0.563 (0.478–0.637) | 0.563 (0.478–0.637) | 0.563 (0.478–0.637) | |
| PAMP measured by catheterization | ICC | 0.540 (0.452–0.616) | 0.549 (0.461–0.626) | 0.545 (0.452–0.625) | 0.549 (0.463–0.625) |
| Lin’s concordance coefficient | 0.539 (0.457–0.612) | 0.548 (0.465–0.622) | 0.544 (0.460–0.618) | 0.548 (0.465–0.622) |
PAMP, mean pulmonary arterial pressure; ICC, intraclass correlation coefficient.
Fig. 2.
The cumulative frequency of PAMP obtained by four equations vs. RHC.
Fig. 4.
The individual value of PAMP obtained by four equations vs. RHC (yellow colored areas indicate the mean value; red boxes indicate the median and interquartile range; and green range lines indicate standard error of the mean).
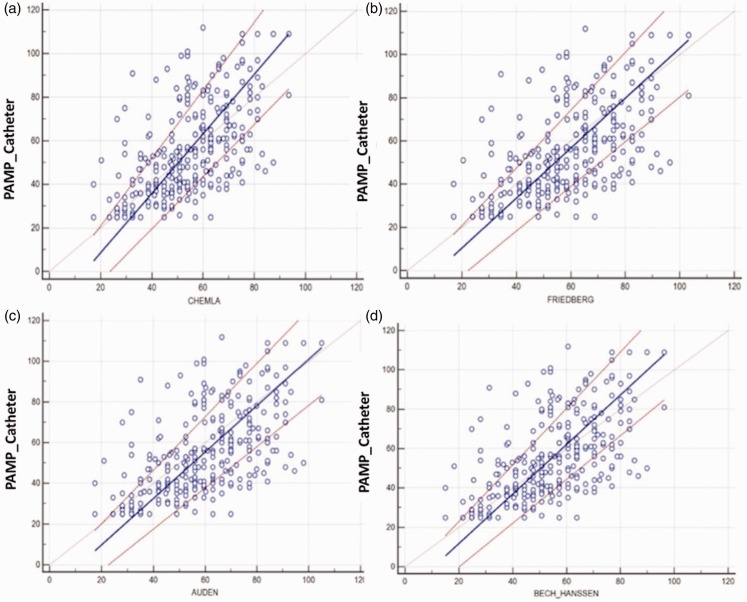
Paired-t test results indicated that there were significant differences for the Friedberg and Aduen equations (Table 3). In addition, Passing–Bablok non-parametric analyzes were shown in Table 4, where variable y stands for estimated PAMP-DE with four formulae, x for PAMP-RHC. Because all CIs were below zero for the intercept, we assumed that there were significant systematic biases between PAMPs obtained by RHC and four estimates of PAMP-DE. However, because all CIs included 1 for the slope, we assumed that there were significant proportional errors between PAMP-DE and PAMP-RHC (Fig. 3).
Table 3.
Results of paired t test for PAMP_Catheter compared to each PAMP calculation by formula.
| Formula | Mean difference (MD) | 95% CI of MD | SD | P value |
|---|---|---|---|---|
| Chemla | 1.51 | −0.54–3.56 | 17.6 | 0.148 |
| Friedberg | –3.13 | −5.25–−1.01 | 18.2 | 0.004 |
| Auden | –4.21 | −6.34–−2.08 | 18.3 | <0.001 |
| Bech-Hanssen | 1.27 | −0.80–3.36 | 17.9 | 0.228 |
CI, confidence interval; SD, standard deviation.
Table 4.
Passing–Bablok non-parametic analysis for each PAMP estimating formula.
| Formula | Regression equation | CI for intercept | CI for slope | P value for linear model* |
|---|---|---|---|---|
| Chemla | Y = −18.7 + 1.36*X | −28.6 – −10.2 | 1.20–1.55 | 0.01 |
| Friedberg | Y = −12.9 + 1.16*X | −23.2 – −6.20 | 1.03–1.34 | 0.05 |
| Auden | Y = −13.2 + 1.14*X | −23.2 – −6.11 | 1.02–1.31 | 0.09 |
| Bech-Hanssen | Y = −13.4 + 1.25*X | −22.6 – −5.78 | 1.11–1.43 | 0.05 |
The cusum test was used for linearity.
PAMP, mean pulmonary arterial pressure; CI, confidence interval.
Fig. 3.
Passing-Bablok regression plot for PAMP obtained by four equations vs. RHC.
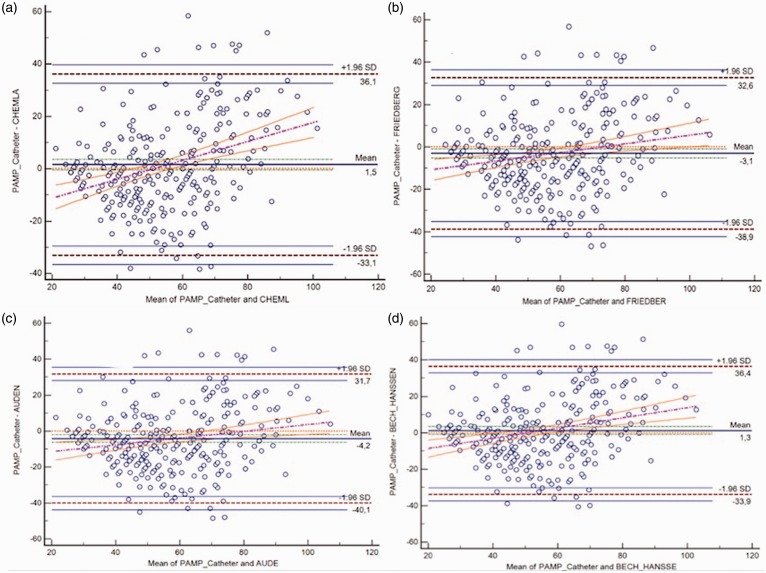
Agreements assessed by BA analysis between PAMP-RHC and PAMP-DE estimated by four DE formulae in the overall PH group and IPAH, APAH-CHD, and CTEPH subsets are presented in Table 5 and Fig. 5. The Chemla and Bech-Hanssen formulae tended to underestimate PAMP-RHC while the Friedberg and Aduen formulae tended to overestimate RHC measures (Fig. 4). Although < 5% points were out of the limits of agreement for all comparison, there were wide intervals between the lower and upper limits of agreement, indicating poor agreement. In addition, the regression line of difference on average appears to show a positive increase, suggesting that the bias was not constant. Also, to assess the DOA, we further categorized PAMP-RHC and PAMP-DE estimates into deciles and Kappa statistics was performed. We found that there was poor agreement between measured PAMP-RHC and deciles of PAMP-DE (Kappa values were 0.112, 0.097, 0.095, 0.121, respectively).
Table 5.
Bland–Altman analysis for measured PAMP by catheterization vs. different PAMP calculated by formulae using echocardiography in the overall population and in IPAH, APAH, and CTEPH populations.
| Mean difference | 95% LOA | |
|---|---|---|
| Overall population | ||
| Chemla | 1.5 | −33.1–36.1 |
| Friedberg | –3.1 | −38.9–32.6 |
| Auden | –4.2 | −40.1–31.7 |
| Bech-Hanssen | 1.3 | −33.9–36.4 |
| IPAH subgroup | ||
| Chemla | 4.5 | −25.1–34.1 |
| Friedberg | –0.6 | −31.8–30.6 |
| Auden | –1.8 | −33.2–29.6 |
| Bech-Hanssen | 4.0 | −26.3–34.4 |
| APAH-CHD subgroup | ||
| Chemla | 5.9 | −30.4–42.2 |
| Friedberg | 0.8 | −36.3–37.8 |
| Auden | –0.4 | −37.5–36.8 |
| Bech-Hanssen | 5.4 | −31.2–42.0 |
| CTEPH subgroup | ||
| Chemla | –0.9 | −31.6–29.9 |
| Friedberg | –5.0 | −37.1–27.1 |
| Auden | –6.0 | −38.3–26.3 |
| Bech-Hanssen | –0.8 | −32.2–30.6 |
IPAH, idiopathic pulmonary hypertension; APAH, associated pulmonary hypertension; CHD, congenital heart disease; CTEPH, chronic thromboembolic pulmonary hypertension; LOA, limit of agreement.
Fig. 5.
Bland–Altman plot for PAMP obtained by four equations vs. RHC in the overall population.
Discussion
In this study comprising patients with confirmed PH, DE estimates for PASP and PAMP from TR jet velocity showed good and significant correlations to invasively measured PASP and PAMP, respectively. Among the PAMP estimates by four DE formulae, concordant results were noted between the Chemla and Bech-Hanssen equations and the Friedberg and Auden equations, respectively. However, agreements among four DE formulae were found to be poor and the Chemla and Bech-Hanssen formulae underestimated PAMP-RHC while other two overestimated PAMP-RHC.
The estimation of PASP and PAMP from TR jet velocity suffers from several limitations.1–22 Therefore, PH can not be reliably defined by a specific threshold cut-off for TR jet peak velocity and estimation of PASP based solely on this measurement may not be appropriate to screen for mild, asymptomatic PH. In a large review including 29 studies, the correlation between PASP-DE and PASP-RHC was found to be modest, with a summary correlation coefficient of 0.70 (95% CI = 0.67–0.73), regardless of the disease severity. The diagnostic accuracy (DA) of DE for PH proven by RHC was also found to be modest, even adopting a cut-off value of 40 mmHg that is the most commonly used threshold for PASP by DE studies and some risks for false-positive and false-negative results also arose.11 Although significant heterogeneity was evident in both correlation and DA analyses, any source for the heterogenity was not found by sensitivity analysis.1 The possible source for the heterogenity for both analyses was associated with a combination of variation in study populations in terms of co-morbidity, study design, spectrum bias, disease progression bias, review and publication bias, and population bias.11 In the review by Janda et al., spectrum bias and disease progression bias were noted in some studies.15 However, because of the lack of information regarding blinding during testing, the possibility of review bias remains unclear whereas poor reporting of any co-morbid conditions within the PH group seemed to limit generalizability.11 Furthermore, intra- and inter-observer variability during DE assessment and reading the recordings, physiological variability in PA hemodynamics among repeat measurements related with volume status, systemic blood pressure and changes in blood oxygenation should be considered as the confounding factors even by the same method on the same day.1–3,11
The mathematical and physiological links between PASP and PAMP are crucially important and a strong linearity between PASP and PAMP has been shown in several studies performed in adults and pediatric populations.12,13,22,23 This relationship was reported to be unchanged in several situations including exercise, pacing, treatment with inotropic agents or pulmonary vasodilators, following heart or double lung transplantation.23 According to the classical physiologic approach based on empirical formula of the two-pressure model, PAMP is defined by the following equation: PAMP = 2/3 × PADP + 1/3 × PASP, where PADP refers to diastolic PA pressure.27 The PAMP has been documented to be more sensitive to changes in PADP compared to those with PASP, and PADP may represent distal vascular resistance more accurately than PASP that is more dependent to the characteristics of right ventricular ejection dynamics, PA compliance, and wave reflections.14,22,27 Moreover, in a simpler single-pressure model using a high-fidelity manometer a new equation was proposed: PAMP = 0.61 ×PASP + 2 mmHg; PASP was reported to account for 98% of PAMP variability.12 Chemla et al. analysed five studies in which high-fidelity manometers were utilized and reported that the most accurate estimate for PAMP was found by using PASP only, while combining the PASP with PADP provided the most precise PAMP estimate.13
Several DE models have been developed for the estimation of the PAMP from TR or pulmonary regurgitant jet velocities.12–20 In addition to the Chemla formula, Syyed (PAMP = 0.65 × PASP + 0.55 mmHg), the Friedberg, Aduen and Bech-Hanssen equations have also been developed for TR-derived DE estimations for PAMP.12–19 A comparison analysis revealed that estimates of the Chemla or Syyed formulae reflect more precisely the PAMP measured by RHC than that measured by PASP-DE.12–14 As another method, PAMP-DE estimation by Aduen’s mean gradient method also showed a similar accuracy and precision compared to the methods of Chemla and Syyed.17 The acceptable accuracy of these methods were considered to suggest their equal suitability for clinical use.12–19 Although all these DE formulae have been shown to provide high DA for PH, comparison among these equations in the pre-specified subsets of PH has not been reported.
Although our study revealed good and significant correlations between four PAMP-DE estimates and PAMP-RHC (r = 0.563, P < 0.001 for all), regardless of the selected TR-derived formula, the clinical relevance of PAMP-DE should be questioned because of the poor agreement between DE and RHC measures for PAMP. This might be due to high constant and proportional errors and seemed to be not originated from problems in the linearity between DE estimates of PASP and PAMP but suffered from technical limitations in the estimation of TR-derived peak systolic gradient using the simplified Bernoulli equation and inaccuracies in the RAP estimates. Because of these shortcomings of TR-derived estimations, ESC/ERS PH 2015 Guidelines recommended a two-step algorithm combining the pre-specified cut-off values for TR peak velocity at rest (instead of estimated PASP) as the main variable for assigning the DE probability of PH with additional seven echocardiographic variables suggestive for PH from three categories addressing the right ventricular pressure overloading against left ventricle, accelerated and/or notched right ventricular ejection into the enlarged PA, and right atrial enlargement and plethora.2
Limitations
Because our analyses were performed in a pre-defined population in whom precapillary PH was already confirmed by RHC, the DA of any threshold cut-off for PASP or PAMP defined by DE for PH screening in a general population was not a concern in our study. Moreover, the exclusion of patients without PH as assessed by RHC might cause a spectrum bias carrying the risk for distortions in a diagnostic test’s performance and eventually overestimation of the sensitivity and specificity of the DE. These results represent drawbacks of TR jet-derived DE methods, but not those with other DE methods in which acceleration time of right ventricular outflow ejection or early diastolic pulmonary regurgitant jet velocity are utilized. As another probable limitation, intra- and inter-observer variability analysis in DE assessments were not included in the study. Finally, physiologic variability of the pulmonary vascular hemodynamics at sequential assessments might be a confounding factor for comparisons between DE and RHC measures in the absence of simultaneous evaluations.
Conclusions
The results of this study performed in a pre-defined population with confirmed PH showed a poor agreement between four TR jet-derived PAMP-DE estimates and PAMP-RHC measures, regardless of the underlying pathology. Therefore, these DE estimates solely might not be reliable for periodical non-invasive assessments of PAMP in patients with PH who were under targeted treatments. However, these results should not be extrapolated to DE screening procedures for PH performed in normal population. Whether implementation of other confirmatory echocardiographic findings suggestive for PH may eliminate these limitations of DE remains to be determined.
Conflict of interest
The author(s) declare that there is no conflict of interest.
Funding
Article processing procedure is financially supported by Actelion Pharmaceuticals – Turkey as an unrestricted scientific grant.
References
- 1.Galie N, Hoeper MM, Humbert M, et al. Guidelines for the diagnosis and treatment of pulmonary hypertension: the Task Force for the Diagnosis and Treatment of Pulmonary Hypertension of the European Society of Cardiology (ESC) and the European Respiratory Society (ERS), endorsed by the International Society of Heart and Lung Transplantation (ISHLT). Eur Heart J 2009; 30: 2493–2537. [DOI] [PubMed] [Google Scholar]
- 2.Galie N, Humbert M, Vachiery JL, et al. 2015 ESC/ERS Guidelines for the diagnosis and treatment of pulmonary hypertension: The Joint Task Force for the Diagnosis and Treatment of Pulmonary Hypertension of the European Society of Cardiology (ESC) and the European Respiratory Society (ERS): Endorsed by: Association for European Paediatric and Congenital Cardiology (AEPC), International Society for Heart and Lung Transplantation (ISHLT). Eur Heart J 2016; 37: 67–119. [DOI] [PubMed] [Google Scholar]
- 3.Rudski LG, Lai WW, Afilalo J, et al. Guidelines for the echocardiographic assessment of the right heart in adults: a report from the American Society of Echocardiography endorsed by the European Association of Echocardiography, a registered branch of the European Society of Cardiology, and the Canadian Society of Echocardiography. J Am Soc Echocardiogr 2010; 23: 685–713. [DOI] [PubMed] [Google Scholar]
- 4.Lang RM, Badano LP, Mor-Avi V, et al. Recommendations for cardiac chamber quantification by echocardiography in adults: an update from the American Society of Echocardiography and the European Association of Cardiovascular Imaging. Eur Heart J Cardiovasc Imaging 2015; 16: 233–271. [DOI] [PubMed] [Google Scholar]
- 5.Chan KL, Currie PJ, Seward JB, et al. Comparison of three Doppler ultrasound methods in the prediction of pulmonary artery pressure. J Am Coll Cardiol 1987; 9: 549–554. [DOI] [PubMed] [Google Scholar]
- 6.Currie PJ, Seward JB, Chan KL, et al. Continuous wave Doppler determination of right ventricular pressure: a simultaneous Doppler-catheterization study in 127 patients. J Am Coll Cardiol 1985; 6: 750–756. [DOI] [PubMed] [Google Scholar]
- 7.Fisher MR, Forfia PR, Chamera E, et al. Accuracy of Doppler echocardiography in the hemodynamic assessment of pulmonary hypertension. Am J Respir Crit Care Med 2009; 179: 615–621. [DOI] [PMC free article] [PubMed] [Google Scholar]
- 8.Arcasoy SM, Christie JD, Ferrari VA, et al. Echocardiographic assessment of pulmonary hypertension in patients with advanced lung disease. Am J Respir Crit Care Med 2003; 167: 735–740. [DOI] [PubMed] [Google Scholar]
- 9.Abaci A, Kabukcu M, Ovunc K, et al. Comparison of the three different formulas for Doppler estimation of pulmonary artery systolic pressure. Angiology 1998; 49: 463–470. [DOI] [PubMed] [Google Scholar]
- 10.Ristow B, Schiller NB. Stepping away from ritual right heart catheterization into the era of noninvasively measured pulmonary artery pressure. J Am Soc Echocardiogr 2009; 22: 820–822. [DOI] [PubMed] [Google Scholar]
- 11.Janda S, Shahidi N, Gin K, et al. Diagnostic accuracy of echocardiography for pulmonary hypertension: a systematic review and meta-analysis. Heart 2011; 97: 612–622. [DOI] [PubMed] [Google Scholar]
- 12.Chemla D, Castelain V, Humbert M, et al. New formula for predicting mean pulmonary artery pressure using systolic pulmonary artery pressure. Chest 2004; 126: 1313–1317. [DOI] [PubMed] [Google Scholar]
- 13.Chemla D, Castelain V, Provencher S, et al. Evaluation of various empirical formulas for estimating mean pulmonary artery pressure by using systolic pulmonary artery pressure in adults. Chest 2009; 135: 760–768. [DOI] [PubMed] [Google Scholar]
- 14.Syyed R, Reeves JT, Welsh D, et al. The relationship between the components of pulmonary artery pressure remains constant under all conditions in both health and disease. Chest 2008; 133: 633–639. [DOI] [PubMed] [Google Scholar]
- 15.Friedberg MK, Feinstein JA, Rosenthal DN. A novel echocardiographic Doppler method for estimation of pulmonary arterial pressures. J Am Soc Echocardiogr 2006; 19: 559–562. [DOI] [PubMed] [Google Scholar]
- 16.Aduen JF, Castello R, Lozano MM, et al. An alternative echocardiographic method to estimate mean pulmonary artery pressure: diagnostic and clinical implications. J Am Soc Echocardiogr 2009; 22: 814–819. [DOI] [PubMed] [Google Scholar]
- 17.Aduen JF, Castello R, Daniels JT, et al. Accuracy and precision of three echocardiographic methods for estimating mean pulmonary artery pressure. Chest 2011; 139: 347–352. [DOI] [PubMed] [Google Scholar]
- 18.Bech-Hanssen O, Selimovic N, Rundqvist B, et al. Doppler echocardiography can provide a comprehensive assessment of right ventricular afterload. J Am Soc Echocardiogr 2009; 22: 1360–1367. [DOI] [PubMed] [Google Scholar]
- 19.Bech-Hanssen O, Karason K, Rundqvist B, et al. Can pulmonary hypertension and increased pulmonary vascular resistance be ruled in and ruled out by echocardiography? J Am Soc Echocardiogr 2013; 26: 469–478. [DOI] [PubMed] [Google Scholar]
- 20.Laver RD, Wiersema UF, Bersten AD. Echocardiographic estimation of mean pulmonary artery pressure in critically ill patients. Crit Ultrasound J 2014; 6: 9. [DOI] [PMC free article] [PubMed] [Google Scholar]
- 21.Kasai H, Matsumura A, Sugiura T, et al. Mean pulmonary artery pressure using echocardiography in chronic thromboembolic pulmonary hypertension. Circ J 2016; 80: 1259–1264. [DOI] [PubMed] [Google Scholar]
- 22.Kind T, Faes TJ, Vonk-Noordegraaf A, et al. Proportional relations between systolic, diastolic and mean pulmonary artery pressure are explained by vascular properties. Cardiovasc Eng Technol 2011; 2: 15–23. [DOI] [PMC free article] [PubMed] [Google Scholar]
- 23.Vanden Eynden F, Racape J, Vincent J, et al. The linear relationship between systolic pulmonary artery pressure and mean pulmonary artery pressure is maintained regardless of autonomic or rhythm disturbances. Respir Res 2016; 17: 33. [DOI] [PMC free article] [PubMed] [Google Scholar]
- 24.Tanboga IH, Ekinci M, Isik T, et al. Reproducibility of syntax score: from core lab to real world. J Interv Cardiol 2011; 24: 302–306. [DOI] [PubMed] [Google Scholar]
- 25.Bilic-Zulle L. Comparison of methods: Passing and Bablok regression. Biochem Med 2011; 21: 49–52. [DOI] [PubMed] [Google Scholar]
- 26.Bland JM, Altman DG. Statistical methods for assessing agreement between two methods of clinical measurement. Lancet 1986; 1: 307–310. [PubMed] [Google Scholar]
- 27.McNeil K, Dunning J, Morrell NW. The pulmonary physician in critical care. 13: the pulmonary circulation and right ventricular failure in the ITU. Thorax 2003; 58: 157–162. [DOI] [PMC free article] [PubMed] [Google Scholar]


