Abstract
Mounting evidence suggest that iron overload enhances cancer growth and metastasis; hence, iron chelation is being increasingly used as part of the treatment regimen in patients with cancer. Now whether iron chelation depletes intracellular iron and/or disrupts intracellular iron homeostasis is yet to be fully addressed. MCF-7 and MDA-MB-231 breast cancer cells treated with increasing concentrations of the iron chelator deferoxamine were assessed for intracellular iron status, the expression of key proteins involved in iron metabolism, cell viability, growth potential, and apoptosis at different time points following treatment. Treatment with deferoxamine at 1, 5, or 10 μM for 24 or 48 hours, while not leading to significant changes in intracellular labile iron content, upregulated the expression of hepcidin, ferroportin, and transferrin receptors 1 and 2. In contrast, deferoxamine at 30, 100, or 300 μM for 24 hours induced a significant decrease in intracellular labile iron, which was associated with increased expression of hepcidin, ferritin, and transferrin receptors 1 and 2. At 48 hours, there was an increase in intracellular labile iron, which was associated with a significant reduction in hepcidin and ferritin expression and a significant increase in ferroportin expression. Although low-dose deferoxamine treatment resulted in a low to moderate decrease in MCF-7 cell growth, high-dose treatment resulted in a significant and precipitous decrease in cell viability and growth, which was associated with increased expression of phosphorylated Histone 2A family member X and near absence of survivin. High-dose deferoxamine treatment also resulted in a very pronounced reduction in wound healing and growth in MDA-MB-231 cells. These findings suggest that high-dose deferoxamine treatment disrupts intracellular iron homeostasis, reduces cell viability and growth, and enhances apoptosis in breast cancer cells. This is further evidence to the potential utility of iron chelation as an adjunctive therapy in iron-overloaded cancers.
Keywords: apoptosis, deferoxamine, ferritin, ferroportin, hepcidin, iron chelation, MCF-7
Introduction
Iron is essential for the metabolism, survival, and growth of almost all cells and organisms. However, excess iron, which leads to the generation and propagation of oxygen and hydroxyl-free radicals, is potentially toxic. To maintain iron homeostasis, mammals have evolved intricate mechanisms that tightly regulate iron absorption and release. Ferroportin (FPN) on the surface of enterocytes and macrophages channels intracellular ferrous iron out into the circulation, where it is instantly oxidized by ceruloplasmin and/or hephaestin at the interphase between iron-releasing cells and the circulation.1 Circulating ferric iron binds to transferrin, and the complex is taken up by target cells through transferrin receptor 1 (TfR1; CD71)-mediated endocytosis. Ferroportin expression is negatively regulated by the liver-derived peptide hormone hepcidin, which induces its internalization and degradation.2 When demand for iron is increased, hepcidin synthesis is suppressed by the action of hypoxia-inducible factor 1α (HIF-1α)3 and growth differentiation factor 154 among other iron regulatory proteins.5 In contrast, ferric-transferrin complexes in excess enhance hepcidin synthesis by inducing the release of human hemochromatosis protein from TfR1 and its binding to TfR2.2,6
Disturbed iron homeostasis is now recognized as part of the pathophysiology of various disease states including cardiovascular complications, neurodegenerative diseases, aging, infection, and cancer.7 Several forms of cancer including those of the lung,8,9 pancreas,10 colon,11–14 and breast11,15–18 have been reported to associate with significant iron overload. Furthermore, breast cancer cells have been shown to exhibit increased levels of hepcidin, ferritin (FT), and labile (exchangeable) iron along with decreased FPN expression.15 Breast cancer cells have also been shown to exhibit increased capacity to sequester iron15 and upregulate the expression of FT, transferrin, and iron regulatory proteins 1 and 2.16 Upregulated expression of CD7119 among other proteins involved in iron metabolism8 is now considered as a marker of poor prognosis in breast cancer. Clinical evidence also suggest that cancerous tissues and blood samples taken from patients with cancer exhibit higher levels of iron20 and disrupted iron metabolism21 when compared with normal participants. Several studies have also suggested that accumulation of iron is a potential risk factor in breast cancer.22,23 Iron overload has also been shown to enhance cell proliferation24 and the progression of cancer toward more aggressive forms.25,26
The growing body of evidence regarding the intricate role of iron in cancer has helped to form the basis for use of iron chelation therapy to manage patients with cancer having iron overload.19,27–32,33,34 However, the full utility of iron chelation therapy in patients with cancer is not well established, that is, although it has proven effective in some instances,27–29 whether its benefits outweigh its side effects is still debatable.27,30,31 Additionally, little is known about the effects of iron chelation on intracellular iron status; the few studies that have addressed this issue suggest that the response of cancer cells to iron deprivation is neither uniform34 nor necessarily similar to that of normal cells [reviewed in the study of Prus & Fibach 35]. Here, we evaluated the effects of iron chelation on the status of the intracellular labile iron pool (LIP) in human breast cancer cell lines MCF-7 and MDA-MB-231 and assessed the status of several proteins involved in cellular iron metabolism along with cell viability and growth potential.
Materials and Methods
Cells and In Vitro Treatment Protocols
The nonmetastatic MCF-7 cells (ATCC HTB-22, Manassas, Virginia) and the metastatic MDA-MB-231 (ATCC HTB-26) were used throughout the study. Cells were maintained in Dulbecco’s modified Eagle’s medium supplemented with 2 μg/mL insulin, 1 mM sodium pyruvate, 1 mM nonessential amino acids, 4 mM glutamine, 10% fetal calf serum, and antibiotics (penicillin/streptomycin) at 37°C and 5% CO2. Cells were seeded at 0.5 to 1 × 10⁵ cells/mL in 25-cm flasks; at ∼70% confluency, cells were treated with DFO (desferrioxamine methanesulfonate, Novartis, Switzerland) at 1, 5, 10, 30, 100, or 300 µM and cultured for 24 and 48 hours prior to harvesting. Control cultures were left untreated or treated with equal volumes of phosphate-buffered saline (PBS) as vehicle.
Western Blotting
Cells were lysed with ice-cold radioimmunoprecipitation assay buffer containing protease cocktail inhibitor tablets (Cat. No. S8830; Sigma). Protein concentration in cell lysates was quantified using the Braford method (Cat. No. 500-0006; BioRad, Berkeley, California). Lysate aliquots containing 30 µg protein were separated by 12% sodium dodecyl sulfate polyacrylamide gel electrophoresis (SDS-PAGE) gel electrophoresis and transferred onto a polyvinylidene difluoride membrane (Cat. No. 162-0177; BioRad). The membrane was blocked with 5% skimmed milk powder for 1 hour at room temperature, washed with Tris-buffered saline Tween-20, and reacted with primary immunoglobulin G (IgG) unlabeled antibody (anti-hepcidin: Cat. No. ab57611; anti-FPN: Cat No ab85370; anti-TfR1: Cat No. ab84036; anti-TfR2: Cat No, ab84287; anti-survivin [BIRC5], Cat No, ab134170 all from Abcam, Cambridge, United Kingdom; anti-FT, Cat No. aa154-183 from LifeSpan Biosciences, Seattle, Washington; anti-H2A histone family, member X [γ-H2AX], Cat No, 05-636 from Merck Millipore, Darmstadt, Germany) at 1:1000 dilution overnight at 4°C. The secondary anti-IgG antibody (Cat. No. 7076 and 7074, Cell signaling, Waltham, Massachusetts) was reacted with the membrane at 1:1000 dilution for 1 hour at room temperature. Protein bands were detected using enhanced chemiluminescence kit (Cat. No. 32106; Thermo Scientific Pierce, Waltham, Massachusetts) on ChemiDoc Touch Gel and Western Blot Imaging System (Bio-Rad, Hercules, California). Protein band quantification was carried out using the Bio-Rad Image Lab software. β-actin (Cat. No. A5441; Sigma, St. Louis, Missouri) was used as a normalization control; values of control (untreated) samples were defined as 1.00 and those of experimental samples were quantified relative to controls.
Immunofluorescence
Cells were seeded at 104/mL on sterile poly-l-lysine-coated glass cover slips in 6-well culture plates overnight. Control and DFO-treated cells were then washed with PBS and fixed with 4% paraformaldehyde for 15 minutes at room temperature and treated with 0.1% Triton X-100 for 10 minutes. Fixed and permeabilized cells were blocked with 3% Bovine Serum Albumin for 1 hour, rinsed with 1× PBS, and incubated with unlabeled primary antibody (anti-hepcidin: Cat. No. ab57611; anti-FPN: Cat No ab85370; anti-TfR1 all from Abcam) at 5 µg/mL overnight at 4°C. Cells were then washed with 1× PBS and reacted with the Alexafluor488- or Alexafluor680-labeled secondary antibody (Abcam) for 1 hour at 37°C; excess reagent was rinsed with 1× PBS. Genomic DNA was stained with 4′,6′-diamidino-2-phenylindole (Cat. No. D1306; Invitrogen, Carlsbad, California), according to the instructions of the manufacturer. Slides were visualized by fluorescence microscopy using an Olympus BX51 fluorescence microscope (Olympus Corporation, Tokyo, Japan).
Flow Cytometric Analysis
Intracellular (labile) iron content was qualitatively assessed as previously described with a slight modification involving the chelator being DFO instead of deferiprone given the noticeable instability of dissolved deferiprone as we experienced it.35 Briefly, cells were washed twice with PBS; 0.5 × 10⁶ were incubated for 15 minutes at 37°C in the presence of 0.125 μM calcein acetoxymethyl ester (CA-AM; Cat. No. 56496; Sigma-Aldrich). Cells were washed twice and incubated for 15 minutes with DFO (Novartis) at 100 mM. After 1 wash, cells were then analyzed by flow cytometry (The BD FACSAria III; Becton-Dickinson, Franklin Lakes, New Jersey) at a rate of 1000 events/second applying a 488-nm laser beam for excitation. A minimum of 25 000 events were collected/sample, and percentage positive staining was computed to the 99% level of confidence. Mean fluorescence intensity (MFI) as presented here represents the geometric MFI of a log-normal distribution of fluorescence signals. Given that MFI increases as free iron content decreases, a qualitative measure of the change in LIP is calculated as ▵MFI (MFICA-AM/DFO −MFICA-AMalone), where ▵MFI > 0 indicates LIP availability, while ▵MFI ≤ 0 indicates LIP depletion.
Wound Healing Assay
MCF-7 and MDA-MB-231 breast cancer cells were seeded at a density of 5 × 10⁵ in a 6-well plate till confluency; the cultures were disturbed by introducing a straight-line scratch using a 20 μL pipette tip. Detached cells were removed by washing twice with PBS. The respective cultures were subsequently treated with 1, 5, 10, 30, 100, or 300 μM DFO (in the case of MCF-7 cells), 30, 100, or 300 μM DFO (in the case of MDA-MB-231), or left untreated in media lacking serum for 0, 6, 24, or 48 hours. At each time point, multiple images were acquired using an inverted microscope at ×10. Quantitative analysis of the cell migration was performed using ImageJ software, National Institutes of Health (http://rsb.info.nih.gov/ij/index.html). Migration rate was calculated using the following equation: Migration rate = (mean width at 0 hours – mean width at 24 hours)/mean width at 0 hours.
3-(4,5-dimethylthiazol-2-yl)-2,5-diphenyltetrazolium bromide Cell Viability Assay
3-(4,5-dimethylthiazol-2-yl)-2,5-diphenyltetrazolium bromide (MTT) (Sigma-Aldrich) was used as a colorimetric assay to assess cell viability following DFO treatment as described elsewhere.36 104 cells were grown in 0.2 mL growth medium in 96-well plates and cultured for 24 hours. The MTT salt was then mixed with the control or DFO-treated cells and incubated at 37°C for 2 hours in a humidified CO2 incubator at 5% CO2. The MTT formazan product was dissolved in Dimethyl sulfoxide, and absorbance was read at 570 nm on a microplate reader.
Statistical Analysis
Cell viability, iron content studies, protein expression levels, and wound healing data were analyzed using Graph Prism Pad 5 (GraphPad Software Inc, La Jolla, California); paired t test was used to generate P values for comparisons between groups in each data set; P < .5 was considered as significant.
Results
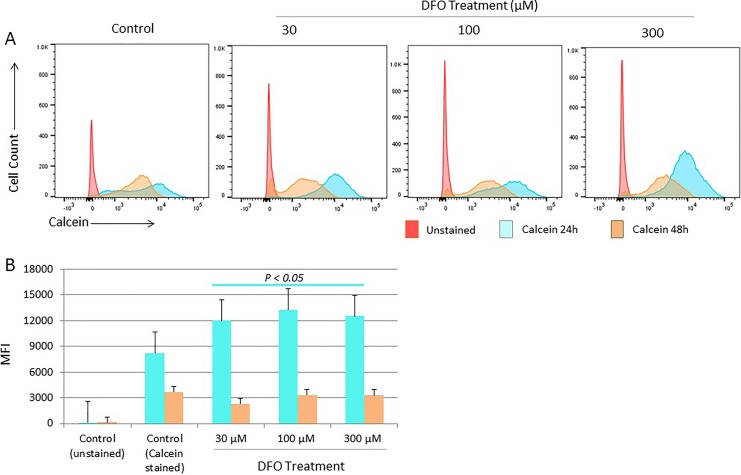
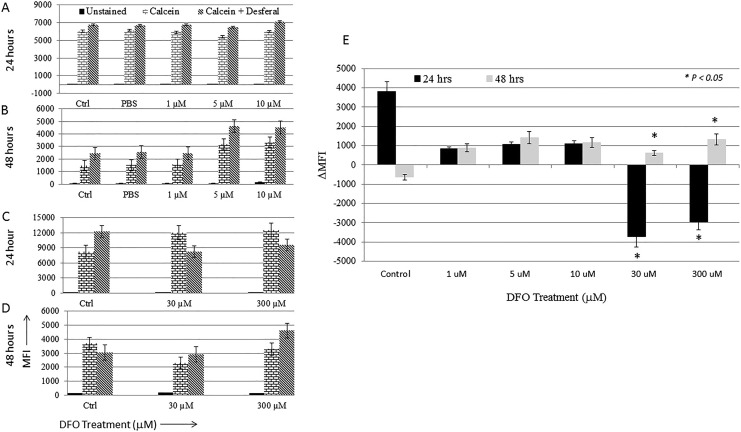
The status of the intracellular LIP following DFO treatment was assessed using the CA-AM/chelator staining-based flow cytometry method.35 Fluorescence intensity of CA-AM-stained control and treated cells was measured at 24 and 48 hours posttreatment as means of evaluating the effects of chelation on LIP content over time. As shown in Figure 1A and B, cells treated with DFO for 24 hours showed a statistically significant decrease (P > .05) in CA-AM quenching (increased fluoresce intensity that equates with lower iron content) when compared with that in untreated cells irrespective of DFO dose. At 48 hours posttreatment, however, there was a significant increase in CA-AM quenching in treated cells (decreased fluoresce intensity that equates with higher iron content). Interestingly, a similar pattern of increased CA-AM quenching was noted in untreated control cells at 48 hours postculture, suggestive perhaps of cell cycling-related physiologic changes in LIP content. To further evaluate the effect of DFO dose on LIP content, the difference in fluorescence intensity between CA-AM alone versus CA-AM-stained and subsequently chelated (CA-AM + chelator) control as well as treated cells was measured and expressed as ΔMFI. The ΔMFI concept was developed and used on the assumption that iron chelation of CA-AM-stained cells unquenches CA-AM (increase CA-AM fluorescence intensity) in a manner reflective of LIP content.35 As shown in Figure 2E, there was a positive shift in fluorescence (ΔMFI > 0) only in untreated control cells at 24 hours posttreatment. Cells treated with DFO at 1, 5, or 10 μM did not show a significant shift in fluorescence (ΔMFI) at either time point, suggesting that low-dose DFO treatment is insufficient to cause detectable changes in the LIP (Figure 2A, B, and E). In contrast, high-dose DFO treatment resulted in a statistically significant negative shift in fluorescence (ΔMFI > 0) at 24 hours irrespective of DFO dose (Figure 2C and E). At 48 hours, however, a reverse pattern was noted; in that, while a positive shift in fluorescence (ΔMFI > 0) was evident in cells treated with 30 and 300 µM DFO, control cells showed a negative shift (ΔMFI > 0; Figure 2D and E). In agreement with data observed in Figure 1, this suggests that LIP content was higher in untreated cells when compared with cells treated with high-dose DFO for 24 hours and higher in DFO-treated cells when compared with untreated cells at 48 hours.
Figure 1.
Changes in labile iron pool (LIP) status in MCF-7 cells following deferoxamine (DFO) treatment. Intracellular iron content was assessed in cells treated with increasing concentrations of DFO versus untreated cells at 24 and 48 hours by flow cytometry calcein acetoxymethyl ester (CA-AM)-based method. A, Representative sample of flow cytometry histogram overlays of CA-AM staining in control cells as well as cells treated with DFO at 30, 100, or 300 µM for 24 hours and 48 hours. B, Calculated averages ± standard error of the mean (SEM) of mean fluorescence intensity (MFI) using histograms as in (A) of 3 separate experiments. P > .05 signifies the presence of a statistically significant difference in MFI (B) between control and treated groups at 24 hours.
Figure 2.
Labile iron pool (LIP) status in MCF-7 cells following treatment with increasing concentrations of deferoxamine (DFO). The effect of iron chelation dose on intracellular iron content was assessed in untreated cells and cells treated with DFO by comparing calcein acetoxymethyl ester (CA-AM)-stained cells with that of CA-AM + chelator-stained cells as explained in Methods section. Average mean fluorescence intensity (MFI) ± standard error of the mean (SEM) of histograms obtained from 2 separate experiments for cells treated with 1, 5, or 10 μM DFO for 24 hours (A) and 48 hours (B) and from 3 separate experiments for cells treated with 30, 100, or 300 μM DFO for 24 hours (C) and 48 hours (D). E, Average change MFI (▵MFI) ± SEM in control and treated cells at 24 and 48 hours as calculated by the formula given in Methods section. P > .05 signifies the presence of a statistically significant difference in ▵MFI (E) in the specific control or experimental group.
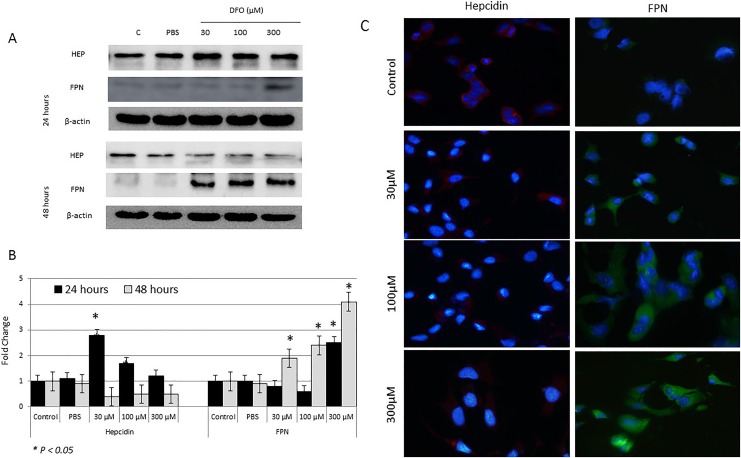
As shown in Figure 3, treatment of MCF-7 cells with increasing concentrations of DFO for 24 hours resulted in a significant increase in hepcidin synthesis, especially at 30 and 100 µM (P > .05). In contrast, treatment with increasing concentrations of DFO for 48 hours resulted in a significant reduction in hepcidin expression (Figure 3A–C). This pattern of hepcidin synthesis negatively correlated with that of LIP in treated cells at both time points (Figures 1 and 2). With regard to FPN expression, it significantly increased in cells treated with 300 µM DFO for 24 hours and those treated with 30, 100, or 300 µM for 48 hours; untreated cells showed minimal levels of FPN at either time point (Figure 3A and B). Overall, the pattern of FPN expression following DFO treatment positively correlated with that of LIP (Figure 1) and negatively correlated with that of hepcidin (Figure 1), especially at 48 hours posttreatment.
Figure 3.
Assessment of cytoplasmic hepcidin and ferroportin (FPN) protein levels in control and deferoxamine (DFO)-treated MCF-7 cells. A, Lysates of cells treated with 30, 100, or 300 µM DFO and those of controls were assessed for hepcidin and FPN by Western blotting at 24 and 48 hours posttreatment. B, Calculated fold change in protein expression levels in treated and controls cells based on 3 separate experiments ± SEM. C, Assessment of cytoplasmic hepcidin and FPN expression by immunofluorescence in control and treated cells at 48 hours; a sample urn of 3 separate experiments. B, The presence of a statistically significant difference (P > .05) in protein expression levels between treated cells and untreated controls at the specific time point is denoted by *.
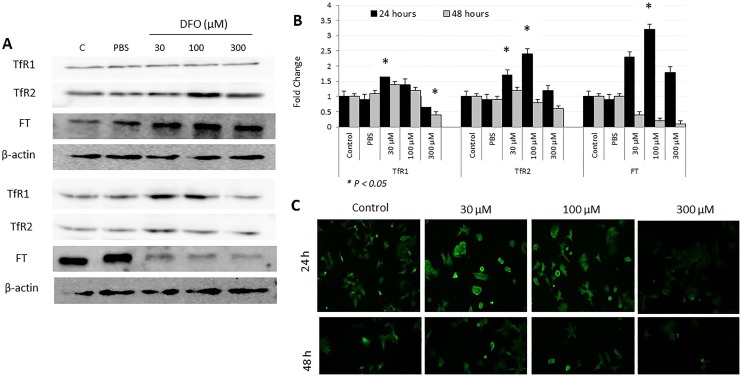
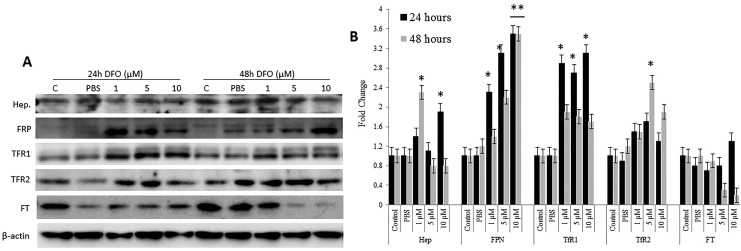
As upregulated expression of FPN is suggestive of increased intracellular iron efflux, the ability of iron-chelated cells to alter the expression of FT, TfR1, and TfR2 as means of compensating for lost LIP was evaluated (Figure 4). As shown in Figure 4, FT expression significantly upregulated (P > .05) at 24 hours and significantly downregulated (P > .05) at 48 hours post DFO treatment. Although changes in FT expression following DFO treatment occurred irrespective of dose, cells treated with 100 µM DFO exhibited the highest levels of FT (>3-fold) when compared with controls. Ferritin expression pattern correlated positively with that of hepcidin (Figure 3) and negatively with that of LIP (Figures 1 and 2) and FPN (Figure 3) at both time points. As a general trend, the lower the DFO dose, the higher the level of TfR1 expression (Figure 4). Cells treated with 30 µM DFO for 24 hours showed significantly higher levels of TfR1 (P > .05) when compared with untreated cells or cells treated with higher DFO doses. Cells treated with 300 µM DFO for 48 hours showed significantly lower levels of TfR1 (P > .05) when compared with treated or untreated cells. The pattern of TfR2 following DFO treatment was slightly different from that of TfR1 (Figure 4C), with it being time- and DFO dose-dependent. In that, TfR2 expression was significantly upregulated especially at 30 μM DFO (P > .05) in cells treated with 30 and 100 µM DFO at 24 hours posttreatment. The TfR2 expression in cells treated with 300 µM DFO was similar to that in untreated cells at 24 hours and slightly lower than that in controls at 48 hours posttreatment. The expression pattern of TfR2 negatively correlated with that of FPN, especially at 300 µM DFO/48 hours exposure time. Interestingly, although low-dose DFO treatment did not lead to significant changes in LIP content, the expression of key iron regulatory proteins including hepcidin, FPN, TfR1, and TfR2 showed significant corrective changes at both 24 and 48 hours posttreatment (Figure 5A and B). This suggests that low-dose iron chelation disrupts intracellular iron metabolism sufficiently enough to trigger corrective responses, vis-à-vis, variable expression in hepcidin and upregulated expression TfR1, TfR2, and FPN.
Figure 4.
Expression patterns of transferrin receptor 1 (TfR1), TfR2, and ferroportin (FT) proteins in deferoxamine (DFO)-treated and control MCF-7 cells. A, Total cell lysates from MCF-7 cells treated with increasing concentrations of DFO (30, 100, or 300 µm) or left untreated were used to assess for TFR1, TfR2, and FT at 24 and 48 hours posttreatment. B, Average fold change ± standard error of the mean in the level of expression of TfR1, TfR2, and FT based on 3 separate experiments. C, Assessment of cell surface expression of TFR1 by immunofluorescence in controls and DFO-treated cells at 24 and 48 hours; data shown are representative of 3 separate experiments. B, The presence of a statistically significant difference (P >. 05) in protein expression levels between treated cells and untreated controls at the specific time point is denoted by *.
Figure 5.
Expression pattern of iron homeostasis proteins in MCF-7 cells following low-dose deferoxamine (DFO) treatment. A, Total cell lysates from MCF-7 cells treated with 1, 5, or 10 µm DFO or left untreated were assessed for the expression of Hep, ferroportin (FPN), transferrin receptor 1 (TFR1), TfR2, and ferritin (FT) at 24 and 48 hours posttreatment. B, Average fold change ± standard error of the mean in the level of expression of the same proteins as in A. *A statistically significant change (P > .05) in protein expression levels between treated and untreated cells at the indicated time point.
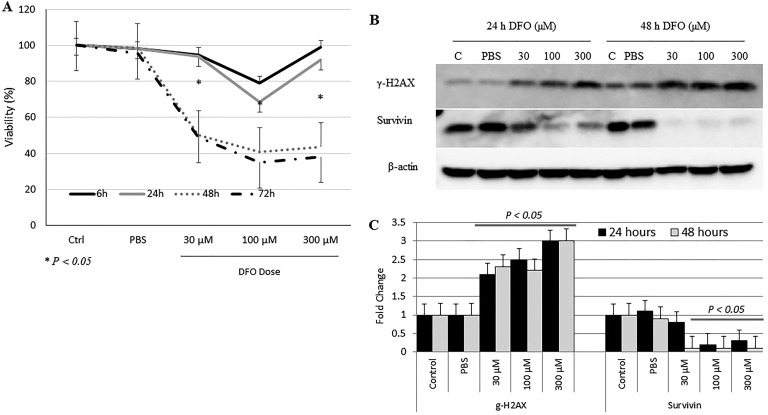
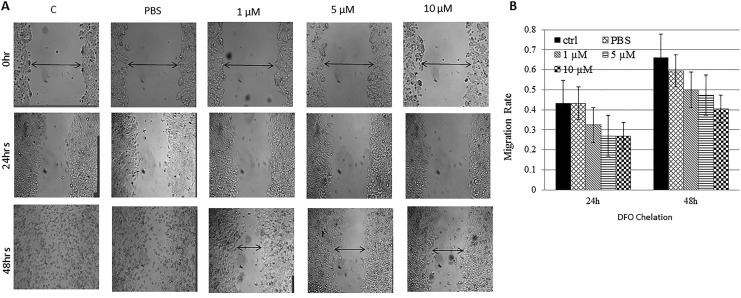
The effect of DFO treatment on MCF-7 cells was further investigated by assessing cell viability (Figure 5) and wound healing (cell migration) potential (Figure 6). As shown in Figure 5, DFO-treated cells experienced a time- and dose-dependent reduction in cell viability when compared with untreated controls; it was most evident in cells treated with 100 µM DFO for 48 and 72 hours (P > .05) postchelation (Figure 6A and B). Furthermore, while low-dose DFO (1, 5, or 10 μM) treatment resulted in a low–moderate reduction in growth and healing (Figure 7A and B), high-dose (30, 100, or 300 μM) treatment resulted in a significant decrease (P > .05) in healing potential (cell migration rates) when compared with untreated cells (Figure 7C and D). In that, untreated cells were able to gradually heal the wound as evidenced by wound closure, high cell migration rates, and absence of floating (dead) cells. In contrast, DFO-treated cells failed to heal the wound as evidenced by the significantly (P > .05) reduced rates of cell migration toward wound area and the presence of significant numbers of floating cells. Interestingly, high-dose DFO treatment of the metastatic breast cancer cell line MDA-MB-231 also resulted in a very significant (P > .05) and visually pronounced decrease in cell growth and healing as evidenced by the apparent lack of cell migration, as well as the clear increase in cell detachment and floating, especially at 100 and 300 μM DFO/48 hours dose (Figure 7E and F). Based on these findings, the proapoptotic potential of DFO-treated cells was evaluated (Figure 6C). Cells treated with increasing concentrations of DFO showed a significant dose-dependent increase (P > 0.05) in the expression profile of the DNA damage marker γ-H2AX at both time points. In contrast, the expression profile of the DNA repair/cell survival marker BIRC5 (survivin) showed a significant reduction (P > .05) at 100 and 300 µM/24 hours and at 30, 100, and 300 µM/48 hours.
Figure 6.
Evaluation of cell viability and apoptotic potential following deferoxamine (DFO) treatment. A, The viability of cells treated with increasing concentrations of DFO (30, 100, or 300 µm) was evaluated at 6, 24, 48 and 72 hours posttreatment using the 3-(4,5-dimethylthiazol-2-yl)-2,5-diphenyltetrazolium bromide (MTT) assay. B, Levels of expression of γ-H2AX and survivin were assessed by Western blotting in untreated cells and in cells treated with DFO (30, 100, or 300 µm) at 24 and 48 hours after treatment. C, Average fold change ± SEM in the level of expression of γ-H2AX and survivin based on 3 separate experiments; data shown are representative of 2 separate experiments. A, *signifies the presence of statistically significant differences (P > 0.05) in cell viability within the same control or experimental group at 24 versus 48 hours (A); statistically significant differences (P > .05) in fold change of protein expression between treated cells and untreated controls is also indicated (C).
Figure 7.
Wound healing potential of DFO-treated versus untreated cells: Disrupted MCF-7 treated with low- (A) and high-dose DFO (C) as well as MDA-MB-213 (E) cell cultures were photographed at 0, 6, 24, and 48 hours; and healing was qualitatively assessed by observing wound closure, migration of viable cells to wound area, and dead cells floating; data shown are representative of 2 separate experiments. Migration rates of viable cells into wound area in both untreated and DFO-treated disrupted MCF-7 (B, D) and MDAMB-231 (F) cell cultures were measured at 6, 24, and 48 hours using the formula: Migration rate = (mean width at 0 hours – mean width at time point (6, 12 or 24 hours)/mean width at 0 hours. *The presence of a statistically significant difference (P > 0.05) in rate of migration between treated cells and controls at the specified concentration/time point.
Discussion
Findings presented here clearly suggest that high-dose DFO treatment targets and reduces intracellular LIP content (Figures 1 and 2). This is consistent with previous studies, which have shown that major iron chelators including DFO can deplete intracellular LIP in various cell types.34,37,38 However, the reduction in intracellular LIP as reported here was transient as evidenced by the observation that following its significant drop at 24 hours, it recovered at 48 hours postchelation (Figure 1). This is consistent with previous work which has shown that DFO treatment increases intracellular iron content in certain types of breast cancer including, for example, the aggressive MDA-MB-231 cells.34 The significant reduction in FT expression at 48 hours (Figure 4) may explain the increase in LIP at this time point, given the antagonistic relationship between LIP and FT expression39,40 and the likely possibility that LIP-depleted cells repress FT expression as means of survival, DNA replication, and cell cycling.41 Whether the interplay between intracellular LIP and FT could continue following iron chelation and for how long is worth addressing in future studies.
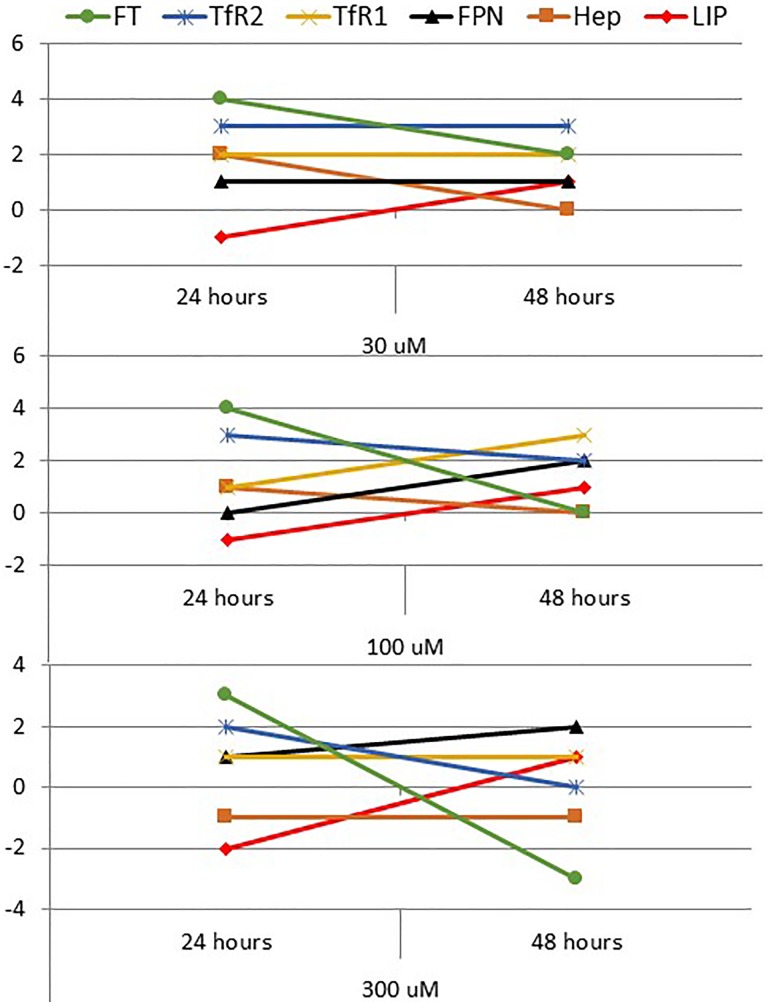
As described in the Results section (Figures 3 and 4) and summarized in Figure 8, high-dose DFO treatment-induced reduction in LIP at 24 hours resulted in increased hepcidin and FT expression, reduced FPN expression, and increased TfR1 and TfR2 expression at 30 and 100 µM concentrations. However, this expected sequence of events2–8 didn’t hold true when MCF-7 cells were treated with 300 µM DFO as evidenced by the observation that increased FPN expression did not correlate positively with an increase in TfR1 and that hepcidin did not change in any significant manner. On the other hand, DFO-induced increase in LIP at 48 hours was associated with reduced hepcidin and FT synthesis, significantly increased FPN expression, increased TfR1 and 2 expression only at 30 DFO, increased TfR1, but reduced TfR2 at 100 µM DFO and reduced TfR1 and TfR2 at 300 µM DFO. Of all these profiles and outcomes, the only one that is roughly consistent with what is to be expected when labile iron content increases in normal cells2–8 is the one observed in cells treated with 300 µM DFO. In agreement with previous reports,8,30,42 these findings point to a significant disruption in intracellular iron homeostasis in cancer cells. This may also partially explain previous observations regarding the differential vulnerability of cancer cells to iron chelation42 and/or chemotherapy.34,37,38
Figure 8.
Summary figure of the trend of change in labile iron pool (LIP) and iron regulatory proteins in treated cells when compared with untreated controls at 24 and 48 hours. A change in any parameter was arbitrarily defined as 0 (no change), 1 (minor), 2 (intermediate), or 3 (major) in the up (+) or down (−) direction.
The observation that iron chelation precipitates time-dependent detrimental effects against nonmetastatic (MCF-7) and metastatic (MDA-MB-231) breast cancer cells (Figures 6 and 7) is consistent with previous reports which have shown that DFO treatment minimizes cell migration and wound healing potential in MCF-7 cells34 and that it decreases the viability and proliferation of breast cancer cells.43 This is in agreement with the observation that DFO-induced LIP depletion increases the susceptibility of cell lines like K562 to doxorubicin38 and that DFO treatment in TP53-MDA-MB-231 and TP53-MCF-7 results in pronounced epigenetic alterations that associate with increased apoptosis and enhanced sensitivity to doxorubicin and cisplatin.44 Increased expression of γ-H2AX and decreased expression of surviving with increasing concentration of DFO as shown in Figure 6 further confirm the apoptotic potential of iron chelation. The detrimental effects of DFO observed in this study were most evident at 100 μM (Figures 6 and 7). However, given that different cell types exhibit differential susceptibilities and sensitivities to iron chelation,34,45 the optimal dose to apply should take into account the status of the patient and the type of cancer being targeted among other issues.
Conclusion
Findings reported here suggest that high-dose DFO treatment transiently depletes LIP content to a level low enough to (1) induce significant disruption in intracellular iron homeostasis, (2) enhance apoptosis, and (3) reduce cell viability and growth in nonmetastatic and metastatic breast cancer cells. Further in vitro work is still needed to test the anti-growth and apoptotic potential of various iron chelators against a wide range of iron-overloaded cancers. Further in vivo work is also needed to optimize the therapeutic dose and address safety concerns relating to iron chelation adjunctive therapy, vis-à-vis iron-deficiency anemia, panleukopenia, and increased susceptibility to nosocomial infections, among others.
Acknowledgments
The authors wish to acknowledge the generous in-house support of the Sharjah Institute for Medical Research (SIMR), University of Sharjah, United Arab Emirates.
Abbreviations
- CA-SM
M calcein acetoxymethyl ester
- FPN
ferroportin
- FT
ferritin
- HIF1-α
hypoxia-inducible factor 1α
- IgG
immunoglobulin G
- LIP
labile iron pool
- PBS
phosphate-buffered saline
- MFI
mean fluorescence intensity
- MTT
3-(4,5-dimethylthiazol-2-yl)-2,5-diphenyltetrazolium.
Authors’ Note: M. Hamad was responsible for the conception of the idea, literature review, hypothesis formulation, data analysis and interpretation, and manuscript preparation. J. Shafarin and K Bajbouj performed all experimental work and data analysis, and they both contributed equally to this work
Declaration of Conflicting Interests: The author(s) declared no potential conflicts of interest with respect to the research, authorship, and/or publication of this article.
Funding: The author(s) disclosed receipt of the following financial support for the research, authorship, and/or publication of this article: This work was supported by research grants MH-15010501005-P/VCGSR, University of Sharjah, Sharjah, United Arab Emirates and seed grant #AJF201664 (MH), Al-Jalila Foundation Research Center, Dubai, United Arab Emirates.
References
- 1. Anderson GJ, Wang F. Essential but toxic: controlling the flux of iron in the body. Clin Exp Pharmacol Physiol. 2012;39(8):719–724. [DOI] [PubMed] [Google Scholar]
- 2. Nemeth E, Tuttle MS, Powelson J, et al. Hepcidin regulates cellular iron efflux by binding to ferroportin and inducing its internalization. Science. 2004;306(5704):2090–2093. [DOI] [PubMed] [Google Scholar]
- 3. Peyssonnaux C, Zinkernagel AS, Schuepbach RA, et al. Regulation of iron homeostasis by the hypoxia-inducible transcription factors (HIFs). J Clin Invest. 2007;117(7):1926–1932. [DOI] [PMC free article] [PubMed] [Google Scholar]
- 4. Tanno T, Bhanu NV, Oneal PA, et al. High levels of GDF15 in thalassemia suppress expression of the iron regulatory protein hepcidin. Nat Med. 2007;3(9):1096–1101. [DOI] [PubMed] [Google Scholar]
- 5. Silvestri L, Pagani A, Nai A, De Domenico I, Kaplan J, Camaschella C. The serine protease matriptase-2 (TMPRSS6) inhibits hepcidin activation by cleaving membrane hemojuvelin. Cell Metab. 2008;8(6):502–511. [DOI] [PMC free article] [PubMed] [Google Scholar]
- 6. Schmidt PJ, Toran PT, Giannetti AM, Bjorkman PJ, Andrews NC. The transferrin receptor modulates Hfe-dependent regulation of hepcidin expression. Cell Metab. 2008;7(3):205–214. [DOI] [PMC free article] [PubMed] [Google Scholar]
- 7. Weinberg ED. The hazards of iron loading. Metallomics. 2010;2(11):732–740. [DOI] [PubMed] [Google Scholar]
- 8. Xiong W, Wang L, Yu F. Regulation of cellular iron metabolism and it implications in lung cancer progression. Med Oncol. 2014;31(7):28, doi:10.1007/s12032-014-0028-2. [DOI] [PubMed] [Google Scholar]
- 9. Yildirim A, Meral M, Kaynar H, Polat H, Ucar EY. Relationship between serum levels of some acute-phase proteins and stage of disease and performance status in patients with lung cancer. Med Sci Monit. 2007;13(4):CR195–CR200. [PubMed] [Google Scholar]
- 10. Kalousova M, Krechler T, Jachymova M, Kuběna AA, Zák A, Zima T.Ferritin as an independent mortality predictor in patients with pancreas cancer. Results of a pilot study. Tumour Biol. 2012;33(5):1695–1700. [DOI] [PubMed] [Google Scholar]
- 11. Osborne NJ, Gurrin LC, Allen KJ, et al. HFE C282Y homozygotes are at increased risk of breast and colorectal cancer. Hepatology. 2010;51(4):1311–1318. [DOI] [PMC free article] [PubMed] [Google Scholar]
- 12. Pusatcioglu CK, Nemeth E, Fantuzzi G, et al. Systemic and tumor level iron regulation in men with colorectal cancer: a case control study. Nutr Metab. 2014;11:21 doi:10.1186/1743-7075-11-21. [DOI] [PMC free article] [PubMed] [Google Scholar]
- 13. Xue X, Taylor M, Anderson E, et al. Hypoxia-inducible factor-2alpha activation promotes colorectal cancer progression by dysregulating iron homeostasis. Cancer Res. 2012;72(9):2285–2293. [DOI] [PMC free article] [PubMed] [Google Scholar]
- 14. Xue X, Shah YM. Intestinal iron homeostasis and colon tumorigenesis. Nutrients. 2013;5(7):2333–2351. [DOI] [PMC free article] [PubMed] [Google Scholar]
- 15. Pinnix ZK, Miller LD, Wang W, et al. Ferroportin and iron regulation in breast cancer progression and prognosis. Sci Transl Med. 2010;2(43):43ra56 doi:10.1126/scisignal.3001127 [DOI] [PMC free article] [PubMed] [Google Scholar]
- 16. Shpyleva SI, Tryndyak VP, Kovalchuk O, et al. Role of ferritin alterations in human breast cancer cells. Breast Cancer Res Treat. 2011;126(1):63–71. [DOI] [PubMed] [Google Scholar]
- 17. Yang J, Bielenberg DR, Rodig SJ, et al. Lipocalin 2 promotes breast cancer progression. Proc Natl Acad Sci USA. 2009;106(10):3913–3918. [DOI] [PMC free article] [PubMed] [Google Scholar]
- 18. Yang J, McNeish B, Butterfield C, Moses MA. Lipocalin 2 is a novel regulator of angiogenesis in human breast cancer. FASEB J. 2013;27(1):45–50. [DOI] [PMC free article] [PubMed] [Google Scholar]
- 19. Habashy OH, Powe DG, Staka CM, et al. Transferrin receptor (CD71) is a marker of poor prognosis in breast cancer and can predict response to tamoxifen. Breast Cancer Res Treat. 2010;119(2):283–293. [DOI] [PubMed] [Google Scholar]
- 20. Connor JR, Lee SY. Iron and cancer In: Milner JA, Romagnolo DF, eds. Bioactive Compounds and Cancer. New York:Springer; 2010:469–496. [Google Scholar]
- 21. Kabat GC, Rohan TE. Does excess iron play a role in breast carcinogenesis? An unresolved hypothesis. Cancer Causes Control. 2007;18(10):1047–1053. [DOI] [PubMed] [Google Scholar]
- 22. Rehman S, Husnain SM. A probable risk factor of female breast cancer: study on benign and malignant breast tissue samples. Biol Trace Elem Res. 2014;157(1):24–29. [DOI] [PubMed] [Google Scholar]
- 23. Cui Y, Vogt S, Olson N, Glass AG, Rohan TE. Levels of zinc, selenium, calcium, and iron in benign breast tissue and risk of subsequent breast cancer. Cancer Epidemiol Biomarkers Prev. 2007;16(8):1682–1685. [DOI] [PubMed] [Google Scholar]
- 24. Torti SV, Torti FM. Iron and cancer: more ore to be mined. Nat Rev Cancer. 2013;13(5):342–355. [DOI] [PMC free article] [PubMed] [Google Scholar]
- 25. Huang X. Does iron have a role in breast cancer? Lancet Oncol. 2008;9(8):803–807. [DOI] [PMC free article] [PubMed] [Google Scholar]
- 26. Moore AB, Shannon J, Chen C, et al. Dietary and stored iron as predictors of breast cancer risk: a nested case–control study in Shanghai. Intl J Cancer. 2009;125(5):1110–1117. [DOI] [PMC free article] [PubMed] [Google Scholar]
- 27. Bedford MR, Ford SJ, Horniblow RD, et al. Iron chelation in the treatment of cancer: a new role for deferasirox? J Clin Pharmacol. 2013;53(9):885–891. [DOI] [PubMed] [Google Scholar]
- 28. Fukushima T, Kawabata H, Nakamura T, et al. Iron chelation therapy with deferasirox induced complete remission in a patient with chemotherapy-resistant acute monocytic leukemia. Anticancer Res. 2011;31(5):1741–1744. [PubMed] [Google Scholar]
- 29. Rao VA. Iron chelators with topoisomerase-inhibitory activity and their anticancer applications. Antioxid Redox Signal. 2013;18(8):930–955. [DOI] [PMC free article] [PubMed] [Google Scholar]
- 30. Torti SV, Torti FM. Cellular iron metabolism in prognosis and therapy of breast cancer. Crit Rev Oncog. 2013;18(5):435–448. [DOI] [PMC free article] [PubMed] [Google Scholar]
- 31. Mitchell M, Gore SD, Zeidan AM. Iron chelation therapy in myelodysplastic syndromes: where do we stand? Expert Rev Hematol. 2013;6(4):397–410. [DOI] [PMC free article] [PubMed] [Google Scholar]
- 32. Shen J, Sheng X, Chang Z, et al. Iron metabolism regulates p53 signaling though direct heme-p53 interaction and modulation of p53 localization, stability, and function. Cell Rep. 2014;7(1):180–193. [DOI] [PMC free article] [PubMed] [Google Scholar]
- 33. Ito F, Nishiyama T, Shi L, et al. Contrasting intra- and extracellular distribution of catalytic ferrous iron in ovalbumin-induced peritonitis. Biochem Biophys Res Comm. 2016;476(4):600–606. doi.10.1016/j.bbrc.2016.06.003. [DOI] [PubMed] [Google Scholar]
- 34. Liu P, He K, Song H, Ma Z, Yin W, Xu LX. Deferoxamine-induced increase in the intracellular iron levels in highly aggressive breast cancer cells leads to increased cell migration by enhancing TNF-α-dependent NF-κB signaling and TGF-β signaling. J Inorg Biochem. 2016;160:40–48. [DOI] [PubMed] [Google Scholar]
- 35. Prus E, Fibach E. Flow cytometry measurement of the labile iron pool in human hematopoietic cells. Cytometry A. 2008;73(1):22–27. [DOI] [PubMed] [Google Scholar]
- 36. Amin A, Bajbouj K, Koch A, Gandesiri M, Schneider-Stock R. Defective autophagosome formation in p53-null colorectal cancer reinforces crocin-induced apoptosis. Int J Mol Sci. 2015;16(1):1544–1561. [DOI] [PMC free article] [PubMed] [Google Scholar]
- 37. Glickstein H, El RB, Shvartsman M, Cabantchik ZI. Intracellular labile iron pools as direct targets of iron chelators: a fluorescence study of chelator action in living cells. Blood. 2005;106(9):3242–3250. [DOI] [PubMed] [Google Scholar]
- 38. Yalcintepe L, Halis E. Modulation of iron metabolism by iron chelation regulates intracellular calcium and increases sensitivity to doxorubicin. Bosn J Basic Med Sci. 2016;16(1):14–20. [DOI] [PMC free article] [PubMed] [Google Scholar]
- 39. Picard V, Epsztejn S, Santambrogio P, Cabantchik ZI, Beaumont C. Role of ferritin in the control of the labile iron pool in murine erythroleukemia cells. J Biol Chem. 1998;273(25):15382–15386. [DOI] [PubMed] [Google Scholar]
- 40. Kakhlon O, Gruenbaum Y, Cabantchik ZI. Repression of ferritin expression increases the labile iron pool, oxidative stress, and short-term growth of human erythroleukemia cells. Blood. 2001;97(9):2863–2871. [DOI] [PubMed] [Google Scholar]
- 41. Kakhlon O, Gruenbaum Y, Cabantchik ZI. Ferritin expression modulates cell cycle dynamics and cell responsiveness to H-ras-induced growth via expansion of the labile iron pool. Biochem J. 2002;363(pt 3):431–436. [DOI] [PMC free article] [PubMed] [Google Scholar]
- 42. Bystrom LM, Rivella S. Cancer cells with iron in the fire. Free Radic Biol Med. 2015;79:337–342. [DOI] [PMC free article] [PubMed] [Google Scholar]
- 43. Kuban-Jankowska A, Sahu KK, Gorska-Ponikowska M, Tuszynski JA, Wozniak M. Inhibitory activity of iron chelators ATA and DFO on MCF-7 breast cancer cells and phosphatases PTP1B and SHP2. Anticancer Res. 2017;37(9):4799–4806. [DOI] [PubMed] [Google Scholar]
- 44. Pogribny IP, Tryndyak VP, Pogribna M, et al. Modulation of intracellular iron metabolism by iron chelation affects chomatin remodeling proteins and corresponding epigenetic modifications in breast cancer cells and increases their sensitivity to chemotherapeutic agents. Intl J Oncol. 2013;42(5):1822–3182. [DOI] [PubMed] [Google Scholar]
- 45. Kovaif J, Valenta T, Stýbrová H. Differing sensitivity of tumor cells to apoptosis induced by iron deprivation in vitro. In Vitro Cell Dev Biol Anim. 2001;37(7):450–458. [DOI] [PubMed] [Google Scholar]


