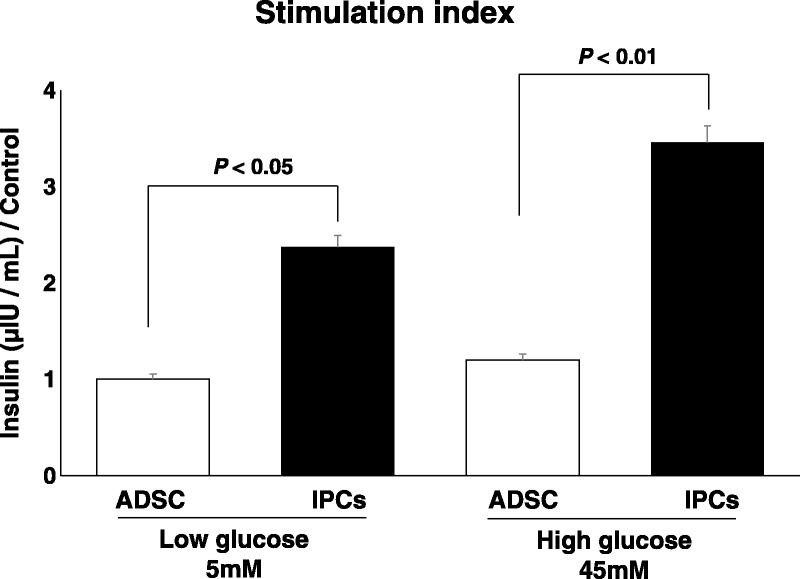
FIGURE 5.

Glucose SI. The insulin concentration in the supernatant of IPCs at day 28 significantly increased when these cells were put in “low” glucose medium (5 mM; paired t-test, P < 0.05) and when moved into “high” glucose medium (45 mM; paired t-test, P < 0.01).
