

Abstract
Background:
Cardiovascular disease (CVD) is highly prevalent at ages 80 and above. The association of physical functioning (PF), a key to an optimal aging trajectory, with CVD and specific CVD diagnosis in women who survive to age 80 and above has not been described previously and has important public health significance given our aging population.
Methods:
Women’s Health Initiative participants aged 80 years or older at the time of self-reporting PF (RAND SF-36) were studied in relationship to CVD diagnosis, whether present at study baseline (1993–1998) or diagnosed during follow-up through 2012. Cross-sectional analyses utilized demographic, medical, lifestyle, and psycho-social questionnaire data from baseline or updated at the time of self-reported PF.
Results:
Among 27,145 older Women’s Health Initiative participants, 22.0% ( N = 5,959) had been diagnosed with CVD, specifically: 11.3% ( N = 3,071) with coronary heart disease; 4.7% ( N = 1,279), stroke; 5.2% ( N = 1,397), venous thromboembolism; 2.7% ( N = 737), peripheral arterial disease; and 2.7% ( N = 725), congestive heart failure. PF scores (mean ± SE ) were significantly ( p < .0001) higher without CVD (60.0±26.9), compared with any CVD (47.9±27.3), and for each specific CVD diagnosis: coronary heart disease (48.8±27.1); stroke (44.8±27.9); venous thromboembolism (48.9±27.4); peripheral arterial disease (41.9±2.2); and congestive heart failure (38.8±26.1). Regardless of CVD diagnosis, higher PF was associated with: younger age at the time of PF assessment; lower body mass index; higher recreational physical activity; better self-reported general health; fewer hip fractures after age 55; no history of arthritis; and no recent use of non-steroidal anti-inflammatory drugs.
Conclusions:
Older women with any CVD, and particularly women with congestive heart failure or peripheral arterial disease, reported significantly lower PF compared to women with no CVD. Regardless of CVD diagnosis, higher PF was strongly associated with a more active lifestyle and lower body mass index, suggesting potential intervention targets for more optimal aging.
Keywords: Cardiovascular, Physical function, Successful aging
Two thirds of female deaths from both coronary heart disease (CHD) and stroke, the first and third leading causes of death among U.S. women, occur in women aged 80 and older, an age reached by 55% of U.S. women in 2011 ( 1 ). The population of women aged 80 and older is expected to nearly triple between 2010 and 2050, to total 11 million ( 2 ). Physical functioning (PF), defined as the ability to perform basic and instrumental activities that one might do in a typical day, is generally considered essential for maintaining independence ( 3 ) and is often included among components of an optimal adult health trajectory, also described as “productive” ( 4 ), “healthy” ( 5 ), “effective” ( 6 ), or “successful” ( 7 , 8 ) aging. Comorbidities, such as CHD or stroke, may be regarded as components of reduced PF; yet, it is unclear how cardiovascular disease (CVD) diagnoses, including CHD, stroke, venous thromboembolic disease (VTE), congestive heart failure (CHF), and/or peripheral arterial disease (PAD), relate to PF, particularly in women aged 80 and older.
Self-reported walking pace, one aspect of PF, was an important determinant of CVD risk in nearly 74,000 women aged 50–79 years in the Women’s Health Initiative (WHI) ( 9 ). Low gait speed was also a strong predictor of future CVD in 1,567 participants, aged 65–97 years (61% women), in the Progetto Veneto Ansiani cohort, even after adjusting for traditional CVD risk factors, inflammatory markers, and hemoglobin A 1c ( 10 ). Similarly, long-distance corridor walk performance measures were important prognostic factors for incident CVD in 3,075 Health, Aging, and Body Composition study participants, aged 70–79 years (52% women, 42% black) ( 11 ). Lower walking speed and average time for sit-to-stand were also associated with indices that precede vascular disease, including wider carotid adventitial diameter, thicker carotid intima-media thickness, and higher probability of carotid plague burden, even after adjustment for CVD risk factors, medications, and physical activity in 1,103 late midlife Study of Women Across the Nation participants ( 12 ). Physical disability was also related to likelihood of experiencing CVD events in 4,648 adults (61% women) aged 55 and older in the Rotterdam Study ( 13 ).
Based on these reports, one can hypothesize that CVD will be associated with lower self-reported PF compared to no CVD and that a CVD diagnosis that is associated with a higher mortality rate, such as CHF, will be associated with lower PF than a CVD diagnoses with a better prognosis; however, there are virtually no data on PF by specific CVD diagnosis, particularly in women aged 80 and older. More importantly, there is little information on what factors are associated with higher PF, and thus a more optimal aging trajectory, versus lower PF among women with CVD or by specific CVD diagnosis. The WHI cohort offers an excellent opportunity to study these relationships because of the large number of women aged 80 and older for whom medical, psycho-social, behavioral, and other health-related measures have been collected over about 15 years, with carefully adjudicated follow-up of cardiovascular outcomes. We thus sought to determine factors associated with high versus low PF in women aged 80 and older with prevalent CVD, and by specific CVD diagnoses, compared with those without CVD.
Methods and Measures
Study Population
The WHI protocol, including study design, eligibility criteria, data collection, and outcomes ascertainment and adjudication, has been published ( 14 ). In brief, 161,808 postmenopausal women (aged 50–79 years, mean age: 63 years) were recruited throughout the United States at 40 clinical centers between 1993 and 1998 into either one or more of three clinical trials (CT: menopausal hormone therapy, diet modification, and calcium and vitamin D supplementation) or an observational study (OS). The CT + OS phases of WHI were completed in 2005, after which surviving participants were invited to enroll in a 5-year Extension Study through September 2010. A total of 115,403 (76.8% of eligible) participants joined and were subsequently invited to consent to further ongoing follow-up, which continued follow-up of 93,544 (87% of eligible) participants. A woman was included in the present analysis if she was alive and had consented to follow up beyond 2010; was aged 80 years or older at the time of a September 2012 data release cutoff; and had completed study questionnaires (described later), which included self-reported PF from the RAND 36-Item Health Survey (SF-36) ( 15 ) after turning 80 years of age. This yielded a sample of 33,386 women. The analytic sample for this article was further restricted to women who had complete CVD information and were not missing key covariates (described later).
Cardiovascular Diagnosis
Presence of CVD for this analysis was defined as having been diagnosed with CHD, including myocardial infarction, coronary artery bypass grafting, and/or percutaneous transluminal coronary angioplasty; stroke (ischemic and hemorrhagic); VTE, including pulmonary embolism and deep vein thrombosis; CHF; and PAD, before the most recent PF assessment. Presence of CVD was defined as self-reported history at baseline by questionnaire; adjudicated CVD events during the CT (semi-annually) and OS (annually) phases per WHI protocol ( 16 ); and annually adjudicated cardiovascular outcomes from 2005 to 2012, per the WHI Extension Study protocol ( 17 ). Absence of CVD was defined as no baseline history or subsequent occurrence of any of these CVD events. A woman with more than one individual cardiovascular outcome over the course of the study was counted only once for presence (history) of any CVD, but was included for each relevant CVD diagnosis in the analysis of specific CVD conditions.
Primary Outcome: Physical Functioning
The most recent RAND-36 PF assessment, for which possible values range from 0 to 100 (with higher scores indicating better PF), since turning age 80, was the primary outcome.
Demographics and Health-Related Covariates
Date of birth, used to calculate current age at the time of the 80+ PF assessment, race/ethnicity, education level (high school or less; yes or no) were self-reported at WHI enrollment. Data from the most recent assessments before the PF assessment were used for: total family income (<$35,000, ≥$35,000), currently employed (yes or no), any health insurance (yes or no), living alone (yes or no), providing care (yes or no), currently married or intimate (yes or no), smoking status (never, past, current), body mass index (self-reported weight in kg/divided by height from baseline clinic visit, in m 2 ; and categorized as: ≤24.9, 25.0–29.9, ≥30.0); total weekly recreational physical activity (minutes/week, categorized into quartiles of the total cohort, regardless of cardiovascular status), self-reported general health (categorized as excellent, very good, good, fair, poor), hysterectomy, hypertension requiring pills, high cholesterol requiring pills, diabetes treated with pills or insulin, and osteoarthritis with medication use (yes or no, including statins, non-steroidal anti-inflammatory drugs (NSAIDS), aspirin, and warfarin). Hip fracture after age 55 years was self-reported at baseline, adjudicated through the CT/OS phase (to 2005) and either self-reported or adjudicated (depending on study component) during the extension phase (to 2012 in this analysis). WHI-designated U.S. geographic regions (Northeast, South, Midwest, and West) and study components (CT vs OS) were included as additional covariates.
Psycho-Social Variables
Depressive symptoms were measured by the eight-item Burnam short version of the Center for Epidemiologic Studies Depression Scale with a range from 0 to 1; higher score indicates greater likelihood of depression. Scores >.06 are considered indicative of significant depressive symptoms and scores ≤ .06 indicative of no/minimal depressive symptoms. Optimism was measured using the Life Orientation Test-Revised (LOT-R) ( 18 ). Scores range from 6 to 30, with higher scores indicating greater optimism (categorized into quartiles of the total analytic cohort). The cynicism subscale of the Cook-Medley Questionnaire was a sum of 13 true/false items resulting in a possible range from 0 to 13 where higher score indicates greater hostility (categorized into quartiles of the cohort). A separate item measured being subjectively happy during the past 4 weeks (categorized into most to all the time, some to a good bit of time, and none to a little of the time). A social support summary score was the sum of nine components with a range from 9 to 45 where a higher score indicates higher social support (categorized into quartiles of the analytic cohort).
Statistical Analysis
Women in the 80+ cohort were categorized with respect to absence versus presence of any CVD and each individual condition, for example, CHD, stroke, VTE, CHF, and PAD. Women’s characteristics were described as means (standard deviation) for continuous variables or counts (percentage) for categorical variables. Comparisons across women with and without a history of CVD (or individual condition) were performed using t tests for continuous variables or chi-square tests for categorical variables. The stratified analysis within each condition (absence of CVD, presence of CVD, and presence of individual CVD condition) was performed using multivariable linear regression models to examine predictors of PF. First, unadjusted models were fitted for each covariate and then a fully adjusted model was fitted with all other covariates in the model. Least square means and corresponding standard errors were reported for all the regression models. Three groups were created based on tertiles of the PF score for the entire analytic cohort. Odds ratios and corresponding 95% confidence intervals of being in the highest tertile compared with the lowest tertile were estimated from fully adjusted multinomial regression models by CVD conditions to assess predictors of high versus low PF. All tests were set at a significance level of .05. All analyses were performed using SAS 9.3 (SAS Institute, Cary, NC).
Results
Of the 33,386 participants who met the eligibility criteria for this analysis, 454 were excluded for missing CVD status and an additional 5,787 were excluded for missing key covariates (listed in Table 1 ). Characteristics of the resultant analytic cohort of 27,145 women are presented in Table 1 , with comparisons ( p values) presented between the 21,186 women with no CVD diagnosis (78.0%) versus the 5,959 with any CVD diagnosis (22.0%) and by specific CVD diagnoses within the total cohort, for example, CHD (11.3%), stroke (4.7%), VTE (5.2%), CHF (2.7%), and PAD (2.7%). [Note: participants with more than one diagnosis appear in each category.] Mean (± SD ) PF score was significantly higher in those with no CVD (60.0±26.9) compared to women with any CVD (47.9±27.3) and each CVD diagnosis, for example, CHD (48.8±27.1), stroke (44.8±27.9), VTE (48.9±27.4), CHF (38.8±26.1), and PAD (41.9±26.2). Figure 1 provides a visual display (histograms) of the distribution of PF scores from 0 to 100, with PF quartiles for the whole analytic cohort demarcated by lines, among women with no CVD (top) versus any CVD (second from top), and for each CVD category from top to bottom, CHD, Stroke, VTE, CHF, and PAD. While a high proportion of women with no CVD reported high PF, a lower proportion of women with CVD, particularly those with CHF and PAD, reported high PF, and PF is particularly low in women with CHF.
Table 1.
Description of Participants in WHI 80+ Cohort by CVD Conditions, Ns (%) Within CVD Condition, or, If Noted, Mean ( SD )
| Characteristic | CVD Absent | Total CVD Present | CHD Present | Stroke Present | VTE Present | CHF Present | PAD Present | ||||||
|---|---|---|---|---|---|---|---|---|---|---|---|---|---|
| Total N (% of total cohort) | 21,186 (78.0)* | 5,959 (22.0)* | 3,071 (11.3)* | 1,279 (4.7)* | 1,397 (5.2)* | 725 (2.7)* | 737 (2.7)* | ||||||
| Age at visit with physical functioning, Mean ( SD ) | 84.4 (3.3) | 85.0 (3.5) | <.0001 | 85.0 (3.5) | <.0001 | 85.3 (3.6) | <.0001 | 84.6 (3.4) | 0.0271 | 85.5 (3.7) | <.0001 | 85.3 (3.5) | <.0001 |
| 80–84 | 13,006 (61.4) | 3,236 (54.3) | <.0001 | 1658 (54.0) | <.0001 | 653 (51.1) | <.0001 | 827 (59.2) | 0.0836 | 356 (49.1) | <.0001 | 391 (53.1) | <.0001 |
| 85–89 | 6,581 (31.1) | 2,059 (34.6) | 1,083 (35.3) | 465 (36.4) | 444 (31.8) | 262 (36.1) | 250 (33.9) | ||||||
| 90+ | 1,599 (7.8) | 664 (11.1) | 330 (10.8) | 161 (12.6) | 126 (9.0) | 107 (14.8) | 96 (13.0) | ||||||
| SF-36 physical functioning Mean ( SD ) | 60.0 (26.9) | 47.9 (27.3) | <.0001 | 48.8 (27.1) | <.0001 | 44.8 (27.9) | <.0001 | 48.9 (27.4) | <.0001 | 38.8 (26.1) | <.0001 | 41.9 (26.2) | <.0001 |
| Race/ethnicity, N | |||||||||||||
| White (not Hispanic) | 19,224 (90.7) | 5,475 (91.9) | <.0001 | 2,827 (92.1) | 0.0097 | 1,156 (90.4) | 0.0851 | 1,310 (93.8) | 0.0002 | 670 (92.4) | 0.0135 | 666 (90.4) | 0.0251 |
| Black/African American | 902 (4.3) | 276 (4.6) | 135 (4.4) | 68 (5.3) | 52 (3.7) | 35 (4.8) | 47 (6.4) | ||||||
| Asian or Pacific Islander | 449 (2.1) | 73 (1.2) | 43 (1.4) | 20 (1.6) | 8 (0.6) | 2 (0.3) | 8 (1.1) | ||||||
| Hispanic/Latino | 355 (1.7) | 62 (1.0) | 33 (1.1) | 14 (1.1) | 11 (0.8) | 10 (1.4) | 8 (1.1) | ||||||
| American Indian/Alaskan Native | 48 (0.2) | 16 (0.3) | 9 (0.3) | 5 (0.4) | 2 (0.1) | 3 (0.5) | 2 (0.3) | ||||||
| Other | 208 (1.0) | 57 (1.0) | 24 (0.8) | 16 (1.3) | 14 (1.0) | 5 (0.7) | 6 (0.8) | ||||||
| Education: high school or less | 4,233 (20.0) | 1,437 (24.1) | <.0001 | 785 (25.6) | <.0001 | 297 (23.2) | 0.0050 | 332 (23.8) | 0.0006 | 156 (21.5) | 0.3092 | 193 (26.2) | <.0001 |
| Lifestyle | |||||||||||||
| Smoking status | |||||||||||||
| Never | 11,766 (55.5) | 3,170 (53.2) | 0.0054 | 1,592 (51.8) | 0.0006 | 693 (54.2) | 0.4561 | 783 (56.1) | 0.6351 | 397 (54.8) | 0.9131 | 323 (43.8) | <.0001 |
| Past | 9,182 (43.3) | 2,715 (45.6) | 1,441 (46.9) | 568 (44.4) | 602 (43.1) | 320 (44.1) | 395 (53.6) | ||||||
| Current | 238 (1.1) | 74 (1.2) | 38 (1.2) | 18 (1.4) | 12 (0.9) | 8 (1.1) | 19 (2.6) | ||||||
| BMI (kg/m 2 ), Mean ( SD ) | 26.5 (5.1) | 27.5 (5.4) | <.0001 | 27.5 (5.2) | <.0001 | 26.9 (5.1) | 0.0019 | 28.2 (5.7) | <.0001 | 28.3 (5.9) | <.0001 | 27.6 (5.6) | <.0001 |
| <25 | 9,394 (44.3) | 2107 (35.4) | < .0001 | 1,049 (34.2) | <.0001 | 516 (40.3) | 0.0108 | 436 (31.2) | <.0001 | 245 (33.8) | <.0001 | 269 (36.5) | <.0001 |
| 25–29.9 | 7,478 (35.3) | 2,207 (37.0) | 1,181 (38.5) | 469 (36.7) | 502 (35.9) | 220 (30.3) | 253 (34.3) | ||||||
| ≥30 | 4,314 (20.4) | 1,645 (27.6) | 841 (27.4) | 294 (23.0) | 459 (32.9) | 260 (35.9) | 215 (29.2) | ||||||
| Recreational physical activity (min/ wk) Mean ( SD ) | 145.4 (161.3) | 114.8 (150.2) | <.0001 | 115.0 (149.1) | <.0001 | 109.1 (146.2) | <.0001 | 123.9 (155.2) | <.0001 | 87.2 (134.9) | <.0001 | 98.7 (145.7) | <.0001 |
| First quartile (total cohort) | 5,294 (25.0) | 2,020 (33.9) | <.0001 | 1,038 (33.8) | <.0001 | 438 (34.3) | <.0001 | 457 (32.7) | <.0001 | 312 (43.0) | <.0001 | 293 (49.8) | <.0001 |
| Second quartile | 4,712 (22.2) | 1,408 (23.6) | 718 (23.4) | 302 (23.6) | 322 (23.1) | 168 (23.2) | 181 (24.6) | ||||||
| Third quartile | 5,798 (27.4) | 1,413 (23.7) | 745 (24.3) | 324 (25.3) | 303 (21.7) | 156 (21.5) | 150 (20.4) | ||||||
| Fourth quartile | 5,382 (25.4) | 1,118 (18.9) | 570 (18.9) | 215 (16.8) | 315 (22.6) | 89 (12.3) | 113 (15.3) | ||||||
| Psycho-social traits | |||||||||||||
| Subjective well-being, happy | |||||||||||||
| Most to all of the time | 14,198 (67.0) | 3,749 (62.9) | <.0001 | 1,917 (62.4) | <.0001 | 801 (62.6) | 0.0044 | 901 (64.5) | 0.1523 | 420 (57.9) | <.0001 | 447 (60.7) | 0.0001 |
| None to a little of the time | 1,020 (4.8) | 349 (5.9) | 179 (5.8) | 65 (5.1) | 73 (5.2) | 47 (6.5) | 55 (7.5) | ||||||
| Social support score, mean ( SD ) | 36.6 (7.9) | 36.3 (7.9) | 0.0201 | 36.3 (7.9) | 0.0936 | 36.1 (8.0) | 0.0322 | 36.1 (8.1) | 0.0302 | 36.8 (7.6) | 0.4943 | 35.8 (8.0) | 0.0085 |
| First quartile (total cohort) | 4,950 (23.4) | 1,434 (24.1) | 0.0168 | 739 (24.1) | 0.3618 | 316 (24.7) | 0.0953 | 359 (25.7) | 0.1152 | 152 (21.0) | 0.0715 | 193 (26.2) | 0.0314 |
| Fourth quartile | 5,210 (24.6) | 1,346 (22.6) | 715 (23.3) | 277 (21.7) | 319 (22.8) | 162 (22.3) | 148 (20.1) | ||||||
| Depression | 1,420 (6.7) | 503 (8.4) | <.0001 | 263 (8.6) | 0.0001 | 88 (6.9) | 0.8051 | 117 (8.4) | 0.0162 | 75 (10.3) | 0.0001 | 70 (9.5) | 0.0030 |
| In general self-reported health is | |||||||||||||
| Excellent | 1,849 (8.7) | 225 (3.8) | <.0001 | 113 (3.7) | <.0001 | 45 (3.5) | <.0001 | 61 (4.4) | <.0001 | 17 (2.3) | <.0001 | 18 (2.4) | <.0001 |
| Very good | 8,282 (39.1) | 1,600 (26.9) | 778 (25.3) | 336 (26.3) | 428 (30.6) | 135 (18.6) | 162 (22.0) | ||||||
| Fair | 2,356 (11.1) | 1,188 (19.9) | 630 (20.5) | 286 (22.4) | 251 (18.0) | 206 (28.4) | 190 (25.8) | ||||||
| Poor | 247 (1.2) | 134 (2.3) | 80 (2.6) | 26 (2.0) | 24 (1.7) | 33 (4.6) | 26 (3.5) | ||||||
| Medical history prior to physical functioning assessment | |||||||||||||
| History of hypertension requiring pills | 14,429 (68.1) | 4,899 (82.2) | <.0001 | 2,647 (86.2) | <.0001 | 1,090 (85.2) | <.0001 | 1,044 (74.7) | <.0001 | 619 (85.4) | <.0001 | 609 (82.6) | <.0001 |
| History of high cholesterol requiring pills | 7,291 (34.4) | 2,904 (48.7) | <.0001 | 1,753 (57.1) | <.0001 | 606 (47.4) | <.0001 | 551 (39.4) | 0.0001 | 307 (42.3) | <.0001 | 376 (51.0) | <.0001 |
| History of treated diabetes mellitus | 2,635 (12.4) | 1,115 (18.7) | <.0001 | 642 (20.9) | <.0001 | 243 (19.0) | <.0001 | 218 (15.6) | 0.0006 | 168 (23.2) | <.0001 | 166 (22.5) | <.0001 |
| History of hip fracture ≥55 y | 1,134 (5.4) | 421 (7.1) | <.0001 | 198 (6.5) | 0.0128 | 103 (8.1) | <.0001 | 102 (7.3) | 0.0019 | 60 (8.3) | 0.0007 | 63 (8.9) | 0.0002 |
| History of arthritis | 16,193 (76.4) | 4,776 (80.2) | <.0001 | 2431 (79.2) | 0.0008 | 992 (77.6) | 0.3555 | 1166 (83.5) | <.0001 | 605 (83.4) | <.0001 | 629 (85.4) | <.0001 |
| Recent medications | |||||||||||||
| Recent use statin | 8,792 (41.5) | 3,642 (61.1) | <.0001 | 2,256 (73.5) | <.0001 | 751 (58.7) | <.0001 | 658 (47.1) | <.0001 | 407 (56.1) | <.0001 | 436 (59.2) | <.0001 |
| Recent use NSAIDS | 6,631 (31.3) | 2,164 (36.3) | <.0001 | 1,096 (35.7) | <.0001 | 436 (34.1) | 0.0369 | 538 (38.5) | <.0001 | 290 (40.0) | <.0001 | 292 (39.6) | <.0001 |
| Recent use aspirin | 9,439 (44.6) | 3,489 (58.6) | <.0001 | 1,983 (64.8) | <.0001 | 756 (59.1) | <.0001 | 730 (52.3) | <.0001 | 419 (57.8) | <.0001 | 424 (57.5) | <.0001 |
| Recent use warfarin | 347 (1.6) | 414 (7.0) | <.0001 | 143 (4.6) | <.0001 | 111 (8.7) | <.0001 | 141 (10.1) | <.0001 | 123 (17.0) | <.0001 | 44 (6.0) | <.0001 |
Notes: p values indicates the t -test or chi-square test results between each disease condition (total CVD, CHD, Stroke, VTE, CHF, or PAD) vs CVD absent. BMI = body mass index; HCD = coronary heart disease; CHF = congestive heart failure; CVD = cardiovascular disease; PAD = peripheral arterial disease; VTE = venous thromboembolism.
* For categorical variables, percentages in the parenthesis represent row percentages. For CVD absent, it was calculated as (No. of CVD absent)/(No. of total CVD present + No. of CVD absent). For each disease condition, it was calculated as (No. of disease present)/(No. of disease present + No. of CVD absent). For example, for race/ethnicity, highlighted in yellow, among American Indians or Alaskan Native, 16 (25.0%) had CVD out of a total of 64 women (48 CVD absent + 16 total CVD present) and 9 (15.8%) had CHD out of 57 women (48 CVD absent + 9 CHD present).
Figure 1.
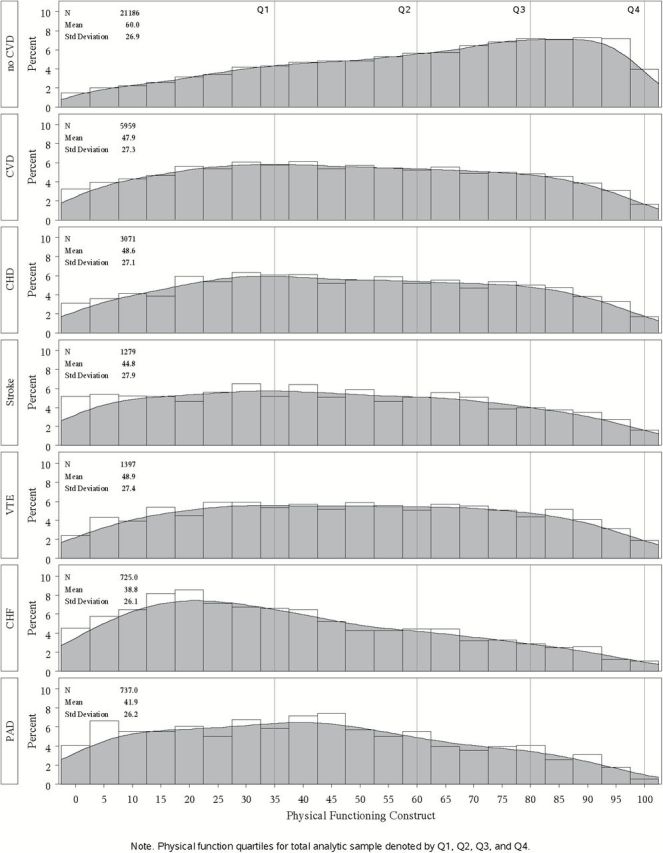
Distribution of physical function scores (0-100) by quartiles for the full analytic cohort.
Mean age was slightly higher in women with any CVD [mean age: 85.0 ± 3.5 ( SD )] versus no CVD [84.4 ± 3.3 ( SD )], a higher proportion of whom were aged 80–84 years (61.4% vs 54.3%) and a lower proportion aged 90 years and older (7.8% vs 11.1%) at the time PF was determined, compared to any CVD and each specific, CVD diagnosis ( Table 1 ). The racial/ethnic distribution for the whole analytic cohort was: white, N = 24,699 (91.0%); black, N = 1178 (4.3%); Asian, N = 522 (1.9%); Hispanic, N = 417 (1.5%); Native American, N = 64 (0.2%); and other, N = 265 (1.0%), with a slightly higher percent of whites and lower percentages of Asian/Pacific Islanders and Hispanics among those with any CVD diagnosis versus no CVD ( Table 1 ). The proportion of participants with more than a high school education was significantly lower among those with any CVD diagnosis (75.9%), versus no CVD (80.0%), but was not lower than 73.8% in any CVD group (ie, PAD). Smoking status varied slightly between the “any” and “no” CVD groups (with 54.9% never smokers and only 1.1% current smokers in the total analytic cohort). Mean body mass index was higher in women with any CVD versus no CVD, with a lower proportion of normal weight (<25kg/m 2 ) among women with any CVD and a higher proportion of obese (>30kg/m 2 ), particularly among women with CHF (35.9%). Among women with any CVD, a higher proportion was in the lowest quartile of recreational physical activity (33.9%) versus those without CVD (25.0%); and a lower proportion with CVD reported activity in the highest quartiles (18.9%) than women with no CVD (25.4%).
Among psycho-social variables ( Table 1 ), a higher proportion of women aged 80 and older without CVD described their well-being as “happy most to all of the time” (67.0%) compared to women with any CVD (62.9%), with the lowest proportion found in women with CHF (57.9%). A lower proportion of women with no CVD (4.8%) reported being “happy none to a little of the time” compared to women with any CVD (5.9%), with the highest proportion among women with PAD (7.5%). In contrast, social support scale scores varied little across CVD categories. On the other hand, depression was significantly higher in women with any CVD (8.4%), particularly those with CHF (10.3%) and PAD (9.5%), although not in women with stroke (6.9%), compared to women with no CVD (6.7%). Self-reported health, in general, was “excellent” or “very good” (combined) in a higher percent of women with no CVD (47.8%) versus women with any CVD (30.7%); whereas, a lower percent of women with no CVD (12.3%) reported “fair” or “poor” health (combined), compared to women with any CVD (22.2%), particularly among women with CHF and PAD (33% and 29.3%, respectively)..
A significantly ( p < .0001) higher proportion of women with any CVD reported history of hypertension requiring pills (82.2%), high cholesterol requiring pills (48.7%), treated diabetes (18.7%), hip fracture after 55 years of age (7.1%), and arthritis (80.2%), compared to women with no CVD, as follows: 68.1%, 34.4%, 12.4%, 5.4%, and 76.4%, respectively. Recent medication use also differed between women with any CVD diagnosis versus no CVD diagnosis, including statin use (61.1% vs 41.5%, respectively), particularly among women with CHD (73.5%), NSAIDS use (36.3% vs 31.3%); aspirin use (58.6% vs 44.6%); and use of warfarin (7.0% vs 1.6%), particularly among women with CHF (17.0%).
Table 2 presents the linear regression analysis on PF scores, simultaneously adjusting for each covariate presented in Table 1 , for women with no CVD, any CVD, and by specific CVD condition. After adjusting for potential confounders, significant predictors of lower physical function in women with any and with each specific CVD diagnosis were: older age at the time of PF assessment; higher body mass index; lower recreational physical activity; poorer self-reported general health; history of hip fractures after age 55 years; history of arthritis; and recent use of NSAIDS.
Table 2.
Least Square Means of SF-36 Physical Functioning Score (mean [ SE ]) by Different Categories of Predictor Within Each CVD Condition
| Predictor | CVD Absent | Total CVD Present | CHD Present | Stroke Present | VTE Present | CHF Present | PAD Present | |
|---|---|---|---|---|---|---|---|---|
| Demographics | ||||||||
| Age at visit with physical function | 80–84 | 62.6 (0.2)* | 51.1 (0.4)* | 52.2 (0.5)* | 47.6 (0.9)* | 50.9 (0.7)* | 41.7 (1.1)# | 43.5 (1.0)# |
| 85–89 | 57.3 (0.2) | 45.7 (0.5) | 45.8 (0.6) | 43.2 (1.1) | 47.2 (1.0) | 36.7 (1.3) | 42.4 (1.3) | |
| 90+ | 49.7 (0.5) | 40.1 (0.8) | 39.5 (1.2) | 38.6 (1.8) | 41.4 (1.9) | 33.9 (2.1) | 34.2 (2.2) | |
| Race/ethnicity | White (not of Hispanic origin) | 59.6 (0.1)* | 47.6 (0.3)# | 48.3 (0.4) | 44.5 (0.7) | 48.6 (0.6) | 38.4 (0.8) | 41.5 (0.8) |
| Black or African American | 65.1 (0.7) | 51.8 (1.3) | 53.2 (1.8) | 47.0 (2.8) | 51.5 (2.9) | 48.2 (3.6) | 43.0 (3.1) | |
| Asian or Pacific Islander | 61.1 (1.0) | 50.4 (2.5) | 48.9 (3.2) | 53.4 (5.1) | 51.0 (7.5) | 32.4 (15) | 49.5 (7.4) | |
| Hispanic/Latino | 64.6 (1.1) | 53.6 (2.7) | 50.8 (3.6) | 44.5 (6.1) | 64.0 (6.4) | 41.7 (6.7) | 57.4 (7.4) | |
| American Indian/ Alaskan Native | 61.1 (2.9) | 47.7 (5.3) | 45.6 (6.9) | 54.5 (10) | 65.9 (15) | 32.1 (12) | 48.7 (15) | |
| Other | 63.3 (1.4) | 48.6 (2.8) | 48.0 (4.2) | 47.2 (5.7) | 46.7 (5.6) | 25.9 (9.6) | 50.1 (8.5) | |
| Education: high school or less | Yes | 61.2 (0.3)* | 49.0 (0.6)^ | 49.4 (0.7) | 45.3 (1.3) | 49.1 (1.2) | 38.4 (1.7) | 41.6 (1.5) |
| No | 59.7 (0.2) | 47.6 (0.3) | 48.3 (0.4) | 44.7 (0.7) | 48.8 (0.6) | 38.8 (0.9) | 42.0 (0.9) | |
| Life style | ||||||||
| Smoking status | Never | 60.3 (0.2)^ | 47.8 (0.4) | 48.7 (0.5) | 44.3 (0.9) | 48.8 (0.7) | 39.2 (1.1) | 41.6 (1.1) |
| Past | 59.5 (0.2) | 48.1 (0.4) | 48.4 (0.5) | 45.5 (1.0) | 48.8 (0.9) | 38.3 (1.2) | 41.9 (1.0) | |
| Current | 59.7 (1.3) | 49.3 (2.5) | 47.2 (3.4) | 47.2 (5.4) | 58.5 (6.1) | 34.9 (7.5) | 45.6 (4.8) | |
| BMI (kg/m 2 ) | <25 | 64.0 (0.2)* | 51.2 (0.5)* | 51.9 (0.7)* | 46.6 (1.0)# | 51.9 (1.0)* | 43.3 (1.4)# | 45.9 (1.3)# |
| 25–29 | 59.4 (0.2) | 48.5 (0.4) | 49.3 (0.6) | 45.6 (1.1) | 50.3 (0.9) | 38.7 (1.4) | 40.2 (1.3) | |
| ≥30 | 52.2 (0.3) | 43.0 (0.5) | 43.4 (0.7) | 40.6 (1.4) | 44.5 (1.0) | 34.5 (1.4) | 38.8 (1.5) | |
| Recreational physical activity (min/wk) | First quartile | 49.6 (0.3)* | 38.5 (0.5)* | 38.7 (0.7)* | 35.8 (1.1)* | 39.4 (1.0)* | 31.4 (1.2)* | 33.5 (1.2)* |
| Second quartile | 58.4 (0.3) | 48.6 (0.6) | 48.7 (0.8) | 45.6 (1.3) | 49.0 (1.2) | 41.8 (1.6) | 43.1 (1.5) | |
| Third quartile | 62.5 (0.3) | 51.9 (0.6) | 53.4 (0.8) | 48.5 (1.3) | 52.4 (1.2) | 42.3 (1.7) | 47.4 (1.7) | |
| Fourth quartile | 68.9 (0.3) | 59.1 (0.6) | 59.9 (0.9) | 56.7 (1.6) | 59.1 (1.2) | 52.6 (2.3) | 54.4 (2.0) | |
| Psycho-social traits | ||||||||
| Subjective well-being, happy | Most to all of the time | 60.3 (0.2)# | 48.2 (0.4) | 48.9 (0.5) | 45.6 (0.8) | 48.7 (0.7) | 39.9 (1.1) | 42.3 (1.0) |
| Some to a good bit of time | 59.5 (0.3) | 47.2 (0.5) | 47.6 (0.7) | 43.1 (1.2) | 49.2 (1.1) | 37.6 (1.4) | 41.3 (1.4) | |
| None to a little of the time | 57.6 (0.7) | 48.5 (1.2) | 50.1 (1.7) | 46.2 (3.0) | 48.7 (2.6) | 35.0 (3.2) | 41.3 (3.0) | |
| Social support score | First quartile | 60.0 (0.3) | 48.1 (0.6) | 48.1 (0.8) | 46.6 (1.3) | 48.5 (1.2) | 36.6 (1.8) | 45.2 (1.6) |
| Second quartile | 59.5 (0.3) | 47.6 (0.6) | 48.1 (0.8) | 45.5 (1.3) | 47.3 (1.2) | 38.6 (1.6) | 40.7 (1.5) | |
| Third quartile | 59.9 (0.3) | 47.1 (0.5) | 48.0 (0.7) | 42.5 (1.2) | 49.0 (1.1) | 38.2 (1.4) | 41.3 (1.4) | |
| Fourth quartile | 60.4 (0.3) | 49.1 (0.6) | 50.2 (0.8) | 45.2 (1.4) | 50.7 (1.2) | 41.8 (1.7) | 40.0 (1.7) | |
| Depression | No | 60.0 (0.1) | 48.1 (0.3)^ | 48.8 (0.4)^ | 44.9 (0.7) | 48.9 (0.6) | 38.5 (0.8) | 42.3 (0.8) |
| Yes | 59.0 (0.6) | 46.0 (1.0) | 45.7 (1.4) | 44.5 (2.6) | 48.3 (2.1) | 40.8 (2.6) | 38.1 (2.6) | |
| In general self-reported health is | Excellent | 75.4 (0.5)* | 67.6 (1.4)* | 68.8 (2.0)* | 62.6 (3.5)* | 69.2 (2.8)* | 52.0 (5.2)* | 67.2 (4.9)* |
| Very good | 67.6 (0.2) | 59.3 (0.5) | 59.3 (0.8) | 56.3 (1.3) | 60.9 (1.1) | 52.6 (1.9) | 55.8 (1.7) | |
| Good | 55.7 (0.2) | 46.9 (0.4) | 48.2 (0.5) | 44.9 (0.9) | 45.7 (0.8) | 40.2 (1.1) | 42.1 (1.1) | |
| Fair | 40.2 (0.4) | 34.2 (0.6) | 36.2 (0.9) | 30.7 (1.4) | 33.1 (1.4) | 29.8 (1.5) | 30.9 (1.6) | |
| Poor | 24.7 (1.3) | 20.9 (1.8) | 20.1 (2.3) | 18.8 (4.5) | 31.7 (4.4) | 16.3 (3.8) | 16.2 (4.1) | |
| Medical history prior to physical functioning assessment | ||||||||
| History of hypertension requiring pills | No | 61.4 (0.3)* | 49.4 (0.7)^ | 50.2 (1.0) | 46.3 (1.7) | 51.2 (1.2)^ | 39.9 (2.1) | 41.4 (1.9) |
| Yes | 59.3 (0.2) | 47.6 (0.3) | 48.3 (0.4) | 44.6 (0.7) | 48.1 (0.7) | 38.6 (0.8) | 42.0 (0.8) | |
| History of high cholesterol requiring pills | No | 59.9 (0.2) | 47.9 (0.4) | 49.0 (0.6) | 44.9 (0.9) | 48.4 (0.8) | 39.1 (1.1) | 42.1 (1.1) |
| Yes | 60.1 (0.3) | 47.9 (0.4) | 48.3 (0.5) | 44.8 (1.0) | 49.6 (1.0) | 38.3 (1.3) | 41.7 (1.1) | |
| History of treated diabetes mellitus | No | 60.1 (0.1) | 48.2 (0.3)^ | 49.1 (0.4)^ | 45.1 (0.7) | 49.0 (0.6) | 39.7 (0.9)# | 41.6 (0.9) |
| Yes | 59.3 (0.4) | 46.5 (0.6) | 46.7 (0.8) | 43.7 (1.5) | 48.1 (1.5) | 35.7 (1.7) | 43.0 (1.7) | |
| History of hip fracture ≥55 years | No | 60.5 (0.1)* | 48.5 (0.3)* | 49.1 (0.4)* | 45.4 (0.7)# | 49.4 (0.6)# | 39.7 (0.8)# | 42.6 (0.8)# |
| Yes | 51.2 (0.6) | 40.2 (1.0) | 41.5 (1.5) | 38.0 (2.3) | 42.1 (2.1) | 28.8 (2.8) | 34.0 (2.7) | |
| History of arthritis | No | 64.9 (0.3)* | 52.9 (0.6)* | 53.5 (0.8)* | 49.1 (1.4)# | 53.9 (1.4)# | 43.4 (2.0)^ | 47.4 (2.1)# |
| Yes | 58.5 (0.2) | 46.7 (0.3) | 47.3 (0.4) | 43.6 (0.7) | 47.9 (0.6) | 37.8 (0.8) | 41.0 (0.8) | |
| Recent medication use | ||||||||
| Recent use statin | No | 59.7 (0.2) | 47.4 (0.5) | 48.5 (0.7) | 43.7 (1.0) | 49.5 (0.8) | 36.9 (1.3) | 41.5 (1.3) |
| Yes | 60.3 (0.2) | 48.3 (0.4) | 48.6 (0.4) | 45.6 (0.9) | 48.2 (0.9) | 40.2 (1.1) | 42.2 (1.0) | |
| Recent use NSAIDS | No | 61.2 (0.2)* | 49.8 (0.3)* | 50.5 (0.5)* | 46.3 (0.8)# | 51.2 (0.7)* | 40.8 (1.0)# | 44.0 (1.0)# |
| Yes | 57.2 (0.3) | 44.6 (0.5) | 45.1 (0.6) | 41.9 (1.1) | 45.2 (0.9) | 35.7 (1.3) | 38.8 (1.2) | |
| Recent use aspirin | No | 60.0 (0.2) | 48.1 (0.4) | 49.4 (0.6) | 43.4 (1.0) | 49.8 (0.8) | 38.5 (1.2) | 41.5 (1.2) |
| Yes | 59.9 (0.2) | 47.8 (0.4) | 48.1 (0.5) | 45.8 (0.8) | 48.0 (0.8) | 38.9 (1.0) | 42.2 (1.0) | |
| Recent use warfarin | No | 60.1 (0.1)* | 48.1 (0.3)* | 48.8 (0.4)* | 45.4 (0.7)# | 48.8 (0.6) | 39.2 (0.8) | 41.7 (0.8) |
| Yes | 55.3 (1.1) | 45.3 (1.0) | 44.0 (1.7) | 39.1 (2.2) | 49.3 (1.8) | 36.4 (1.9) | 45.3 (3.1) | |
Notes : This analysis adjusted for all other covariate(s), ie, all categorical variables in Table 1 . Statistical significance was indicated by three symbols: * p < .0001; # p < .01; ^ p < .05. For each predictor, statistical significance symbol was labeled on the first category of that predictor. For example, within CVD absent women, age at visit with physical function was statistically significant ( p < .0001) after adjusting for other covariates. Those who were at the age of 80–84 had an adjusted average physical functioning score of 62.6, while those who were at age of 85–89 had an adjusted average physical function score of 57.3, those who were 90 and older an adjusted average of 49.7. The symbol “*“ beside 62.6 (0.2) indicates these differences were statistically significant at level of 0.0001. BMI = body mass index; CHF = congestive heart failure; CVD = cardiovascular disease; HCD = coronary heart disease; PAD = peripheral arterial disease; VTE = venous thromboembolism.
Odds ratios for the highest versus lowest tertiles of PF score, and corresponding 95% confidence intervals (CI), were calculated for the variables presented in Table 2 and are presented in Table 3 . With age 80–84 years as the referent group for age, women aged 85–89 had about half the likelihood of being in the upper PF tertile regardless of CVD diagnosis and for women aged 90 and older, the OR was 17% for those with no CVD and 26% for women with any CVD diagnosis. Compared to the white referent group, black and Hispanic women had a greater chance of a PF score in the upper tertile whether they had no or any CVD diagnosis; whereas, the ORs were not significant in Asians/Pacific Islanders, except for stroke, or in Native Americans (likely due to small numbers). In fact, compared to white participants, Hispanic/Latino women with any CVD had 3.49 OR of reporting a PF score in the upper tertile. With normal weight (body mass index < 25kg/m 2 as the referent, being overweight or obese reduced the chance of being in the upper tertile of PF by about 50% and 80% among women with no CVD and by approximately 33% and 70%, respectively, among women with any CVD. For recreational physical activity (with the lowest quartile as the reference group), women in the highest quartile of activity had a 10-fold greater chance of being in the top tertile of PF and women in the middle two quartiles had 2.5–6.5 greater chance of being in the top tertile with ORs being slightly higher among women with any CVD, and by CVD category, compared to women with no CVD. Lower subjective well-being, but not depression, was significantly associated with lower PF in participants with no CVD diagnosis, but not in women with any CVD. Self-rated health was associated with a large decline in PF for all categories below “excellent,” with participants with good, fair, or poor self-reported health having less than 10% chance of being in the highest tertile of PF regardless of the presence or absence of CVD. History of hip fracture at age 55 and above also produced a powerful reduction in the likelihood of reporting the highest tertile of PF and, overall, did not interact with the presence of CVD; however, the chance of being in the highest PF category was less than 10% for women with CHF. History of arthritis was also associated with reduced PF similarly in the no CVD and any CVD groups, with PAD in the presence of arthritis being associated with the lowest PF scores. In terms of medications, statin use was associated with about an 11% increase in PF scores in the upper tertile in women with no CVD and 22% increase with any CVD diagnosis, while NSAIDS and warfarin use were associated with an approximately a 50% or greater decrease in the likelihood of reporting PF scores in the upper tertile, for both no CVD and any CVD groups.
Table 3.
Odds Ratios and Corresponding 95% Confidence Intervals for Being in the Highest Tertile of Physical Functioning Score Versus the Lowest Tertile From Fully Adjusted Multinomial Regression Models by CVD Conditions
| Predictors | CVD Absent | Total CVD Present | CHD Present | Stroke Present | VTE Present | CHF Present | PAD Present | |
|---|---|---|---|---|---|---|---|---|
| Odds Ratio (95% CI) | Odds Ratio (95% CI) | Odds Ratio (95% CI) | Odds Ratio (95% CI) | Odds Ratio (95% CI) | Odds Ratio (95% CI) | Odds Ratio (95% CI) | ||
| Demographics | ||||||||
| Age at visit with physical functioning | 85–89 | 0.48 (0.44, 0.53)* | 0.52 (0.43, 0.62)* | 0.44 (0.35, 0.57)* | 0.62 (0.42, 0.91)# | 0.59 (0.40, 0.87)# | 0.48 (0.26, 0.89) | 0.76 (0.43, 1.35) |
| 90+ | 0.17 (0.15, 0.21) | 0.26 (0.19, 0.35) | 0.23 (0.15, 0.35) | 0.20 (0.10, 0.43) | 0.30 (0.15, 0.61) | 0.63 (0.27, 1.45) | 0.30 (0.12, 0.76) | |
| Race/ethnicity | Black or African American | 2.20 (1.78, 2.72)* | 1.88 (1.28, 2.77)# | 2.02 (1.14, 3.56) | 1.23 (0.54, 2.81) | |||
| Asian or Pacific Islander | 1.13 (0.83, 1.53) | 1.82 (0.90, 3.70) | 1.15 (0.43, 3.05) | 4.99 (1.32, 18.9) | ||||
| Hispanic/Latino | 2.02 (1.44, 2.84) | 3.49 (1.66, 7.34) | 2.10 (0.71, 6.23) | 2.82 (0.55, 14.5) | ||||
| American Indian or Alaskan Native | 1.42 (0.61, 3.29) | 0.75 (0.12, 4.68) | 0.94 (0.10, 8.65) | 1.58 (0.10, 25.2) | ||||
| Other | 1.47 (0.96, 2.25) | 1.23 (0.52, 2.88) | 1.09 (0.33, 3.64) | 2.28 (0.43, 12.1) | ||||
| Above high school | 0.85 (0.76, 0.94)# | 0.85 (0.70, 1.03) | 0.84 (0.64, 1.09) | 0.95 (0.62, 1.47) | 1.01 (0.66, 1.53) | 0.84 (0.44, 1.61) | 1.05 (0.56, 1.96) | |
| Life style | ||||||||
| Smoking status | Past | 0.88 (0.81, 0.96)^ | 0.99 (0.84, 1.17) | 1.00 (0.79, 1.26) | 1.16 (0.80, 1.67) | 0.92 (0.65, 1.31) | 0.90 (0.53, 1.54) | |
| Current | 0.85 (0.57, 1.25) | 1.07 (0.52, 2.23) | 0.80 (0.29, 2.24) | 1.95 (0.50, 7.59) | 3.93 (0.66, 23.6) | 1.11 (0.21, 5.78) | ||
| BMI (kg/m 2 ) | 25–29 | 0.53 (0.48, 0.59)* | 0.66 (0.55, 0.80)* | 0.72 (0.55, 0.93)* | 0.82 (0.54, 1.23) | 0.75 (0.50, 1.13)# | 0.45 (0.24, 0.85)* | 0.35 (0.19, 0.66)# |
| At least 30 | 0.21 (0.18, 0.23) | 0.31 (0.25, 0.39) | 0.28 (0.20, 0.38) | 0.56 (0.33, 0.94) | 0.35 (0.22, 0.56) | 0.30 (0.15, 0.59) | 0.36 (0.18, 0.75) | |
| Recreational physical activity (min/wk) | Second quartile | 2.59 (2.30, 2.93)* | 3.23 (2.54, 4.10)* | 3.55 (2.54, 4.98)* | 2.46 (1.46, 4.15)* | 3.42 (2.01, 5.80)* | 2.52 (1.16, 5.46)* | 2.49 (1.20, 5.18)* |
| Third quartile | 4.61 (4.09, 5.20) | 5.33 (4.21, 6.74) | 6.56 (4.71, 9.14) | 3.64 (2.20, 6.02) | 6.30 (3.72, 10.6) | 4.11 (2.00, 8.43) | 5.36 (2.53, 11.4) | |
| Fourth quartile | 11.7 (10.2, 13.4) | 12.3 (9.50, 15.8) | 14.8 (10.3, 21.3) | 10.7 (6.10, 18.6) | 12.6 (7.44, 21.5) | 12.4 (5.50, 27.9) | 13.3 (6.03, 29.5) | |
| Psycho-social traits | ||||||||
| Subjective well-being, happy | Some to a good bit of time | 0.88 (0.80, 0.98)# | 0.95 (0.78, 1.16) | 0.99 (0.75, 1.30) | 0.75 (0.49, 1.16) | 1.13 (0.74, 1.72) | 0.88 (0.47, 1.68) | 1.06 (0.55, 2.06) |
| None to a little of the time | 0.73 (0.59, 0.90) | 1.20 (0.80, 1.79) | 1.23 (0.69, 2.20) | 1.17 (0.50, 2.74) | 1.33 (0.54, 3.27) | 0.57 (0.15, 2.17) | 1.59 (0.51, 4.98) | |
| Social support score | Second quartile | 0.98 (0.87, 1.11) | 1.04 (0.82, 1.33) | 1.29 (0.92, 1.81) | 0.96 (0.58, 1.59) | 0.75 (0.44, 1.26) | 1.00 (0.43, 2.35) | 0.45 (0.20, 0.99) |
| Third quartile | 1.03 (0.91, 1.16) | 0.98 (0.78, 1.25) | 1.19 (0.86, 1.67) | 0.66 (0.39, 1.11) | 0.93 (0.57, 1.52) | 0.95 (0.43, 2.12) | 0.63 (0.30, 1.33) | |
| Fourth quartile | 1.07 (0.94, 1.21) | 1.26 (0.98, 1.62) | 1.64 (1.16, 2.33) | 0.94 (0.55, 1.61) | 1.19 (0.71, 2.01) | 1.40 (0.61, 3.24) | 0.58 (0.26, 1.31) | |
| Depression | 0.90 (0.75, 1.08) | 0.90 (0.64, 1.28) | 0.74 (0.45, 1.23) | 0.96 (0.41, 2.22) | 1.15 (0.56, 2.37) | 1.33 (0.46, 3.80) | 1.05 (0.40, 2.72)^ | |
| In general self-reported health is | Very good | 0.37 (0.30, 0.46)* | 0.36 (0.22, 0.58)* | 0.22 (0.10, 0.50)* | 0.66 (0.26, 1.69)* | 0.28 (0.10, 0.78)* | 1.01 (0.23, 4.49)* | 0.19 (0.03, 1.08)* |
| Good | 0.08 (0.07, 0.10) | 0.08 (0.05, 0.13) | 0.06 (0.02, 0.12) | 0.20 (0.08, 0.50) | 0.04 (0.01, 0.11) | 0.28 (0.06, 1.20) | 0.03 (0.01, 0.19) | |
| Fair | 0.01 (0.01, 0.02) | 0.02 (0.01, 0.03) | 0.01 (0.01, 0.03) | 0.03 (0.01, 0.10) | 0.01 (0.00, 0.04) | 0.08 (0.02, 0.39) | 0.01 (0.00, 0.04) | |
| Poor | 0.00 (0.00, 0.01) | 0.00 (0.00, 0.02) | 0.00 (0.00, 0.02) | 0.02 (0.00, 0.24) | 0.02 (0.00, 0.19) | 0.00 (0.00, 0.00) | 0.00 (0.00, 0.00) | |
| Medical history prior to physical functioning assessment | ||||||||
| History of hypertension requiring pills | 0.75 (0.68, 0.82)* | 0.75 (0.61, 0.92)^ | 0.73 (0.53, 1.00) | 0.71 (0.44, 1.14) | 0.65 (0.43, 0.96) | 0.73 (0.36, 1.50) | 1.17 (0.59, 2.30) | |
| History of high cholesterol requiring pills | 0.99 (0.90, 1.10) | 0.92 (0.78, 1.10) | 0.80 (0.63, 1.01) | 0.90 (0.61, 1.32) | 1.23 (0.82, 1.86) | 1.28 (0.70, 2.35) | 0.95 (0.53, 1.68) | |
| History of treated diabetes mellitus | 0.92 (0.81, 1.05) | 0.73 (0.58, 0.92)^ | 0.73 (0.54, 0.99) | 0.65 (0.39, 1.08) | 0.72 (0.43, 1.23) | 0.53 (0.25, 1.10) | 1.32 (0.68, 2.57) | |
| History of hip fracture ≥55 years | 0.31 (0.25, 0.37)* | 0.37 (0.26, 0.54)* | 0.43 (0.26, 0.73)# | 0.39 (0.18, 0.85)^ | 0.41 (0.20, 0.84)^ | 0.07 (0.01, 0.56)^ | 0.26 (0.08, 0.91) | |
| History of arthritis | 0.41 (0.37, 0.46)* | 0.46 (0.38, 0.56)* | 0.44 (0.34, 0.59)* | 0.49 (0.32, 0.75)# | 0.43 (0.27, 0.69)# | 0.56 (0.29, 1.11) | 0.28 (0.14, 0.57)# | |
| Recent use of medications | ||||||||
| Recent use of statin | 1.11 (1.00, 1.23) | 1.22 (1.01, 1.46) | 1.07 (0.82, 1.40) | 1.41 (0.95, 2.10) | 0.79 (0.53, 1.18) | 1.55 (0.84, 2.86) | 1.20 (0.67, 2.16) | |
| Recent use of NSAIDS | 0.56 (0.51, 0.61)* | 0.51 (0.43, 0.61)* | 0.52 (0.40, 0.67)* | 0.50 (0.33, 0.75)# | 0.45 (0.31, 0.65)* | 0.53 (0.30, 0.95)^ | 0.53 (0.30, 0.94)^ | |
| Recent use of aspirin | 1.00 (0.92, 1.09) | 0.96 (0.82, 1.14) | 0.91 (0.71, 1.15) | 1.36 (0.94, 1.97) | 0.78 (0.55, 1.11) | 0.84 (0.49, 1.44) | 1.09 (0.64, 1.84) | |
| Recent use of warfarin | 0.40 (0.28, 0.56)* | 0.51 (0.36, 0.73)# | 0.53 (0.29, 0.96)^ | 0.26 (0.12, 0.55)# | 0.91 (0.50, 1.67) | 0.55 (0.26, 1.18) | 0.58 (0.11, 2.96) | |
Notes : The odds ratios in the table have the following interpretation: Using age as an example: With CVD absent, women 85–89 years old compared to those <85 years old had a 48% chance to be in the highest tertile of physical functioning vs the lowest tertile, while those 90+ years old had an even lower 17% chance. Overall statistical significance was indicated by three symbols appearing in the first category: * p < .0001; # p < .01; ^ p < .05. All significant effects are in bold type. Due to small numbers, race/ethnicity was omitted from models for VTE, CHF, and PAD; in addition, smoking status was omitted for CHF. BMI = body mass index; CHF = congestive heart failure; CVD = cardiovascular disease; HCD = coronary heart disease; PAD = peripheral arterial disease; VTE = venous thromboembolism.
Discussion
In light of previous reports linking reduced physical function, assessed clinically and by self-report, with increased CVD ( 9–13 ), it was expected that older WHI women with CVD would report lower PF than those with no CVD. It is well established that CVD incidence increases with age and PF decreases with age; therefore, it was also not surprising that younger age was associated with higher PF in these older women; however, there was virtually nothing in the literature to predict the likelihood of reporting a higher PF by women aged 85–89 or 90 and older, versus those aged 80–84. It was therefore interesting to find that higher PF was half as likely for those aged 85–89 with or without CVD diagnoses. Women aged 90 and older were respectively 17% and 26% as likely to report higher PF compared to 80- to 84-year-old women with and without CVD.
We observed higher PF scores in African American and Hispanic women compared to white women in our cohort, regardless of CVD status. It seems plausible that they may have faced conditions that raise risks of morbidity and mortality in younger U.S. minority populations and may be “survivors” with greater resiliency; however, many other variables may have influenced this particular observation. Minority women in WHI differ demographically from their counterparts in the wider U.S. population; therefore, it is unclear how our observations relate to older African American and Hispanic women in the general population.
The fact that a high proportion of women in this older cohort reported high PF, not only among the 78% with no CVD diagnosis group, but also among those with a diagnosis of CHD and stroke, is important to recognize. As 55% of U.S. women are expected to live to at least age 80 and the majority of women with CVD are older than 80 years ( 1 ) and given the projected growth of the older U.S. women in coming decades ( 2 ), determining factors that may underlie higher PF in older women may enable us to identify possible targets for prevention and interventions that could improve the aging process ( 4–8 ). Consistent with our cross-sectional findings, physical inactivity and obesity were significant predictors of adverse changes in health quality of life, including PF, over a 7-year prospective study of nearly 2,000 postmenopausal women aged 60–79 years ( 19 ). In our cohort of women aged 80 and older, being in the highest quartile of recreational activity was associated with a 10-fold greater chance of being in the top versus bottom tertile of PF, and being in the middle two recreational activity quartiles had an OR of 2.5–6.5 greater likelihood of reporting higher PF, with slightly higher ORs among women with any CVD (and by individual CVD diagnoses) compared to no CVD. While an inability to engage in recreational activities may drive these relationships, the Lifestyle Interventions and Independence for Elders trial of 1,635 sedentary adults, aged 70–89 years (67% women) with physical limitations, provided strong evidence that a structured, moderate-intensity physical activity intervention may reduce major mobility disability over 2.6 years ( 20 ). Worth noting, about 8% of the Lifestyle Interventions and Independence for Elders participants had a history of myocardial infarction and 6%–71% had a history of stroke at baseline, and about 71% had hypertension. In our older WHI women, being overweight or obese also reduced the chance of being in the upper tertile of PF, by about 50% and 80% respectively, among women with no CVD, and by 33% and 70%, among women with any CVD, suggesting that weight loss might be another reasonable intervention to increase PF in older women. In the Cooperative Lifestyle Intervention Program randomized trial of nearly 300 overweight and obese older adults aged 60–79, with or at risk for CVD and with self-reported limitations in mobility (67% women), compared to both control and PA only, reduction in body weight by an 18-month physical activity (PA) + weight loss (WL) intervention was associated with improved mobility assessed by a 400-m walk time ( 21 ).
In general, other predictors of reduced PF were similar and of similar magnitude in participants with and without CVD; however, a lower sense of well-being, which was more prevalent in women with CVD than women with no CVD, was significantly associated with lower PF in women with no CVD, but not in women with any CVD. On the other hand, self-rated health was associated with a large decline in PF for all categories below “excellent” regardless of CVD presence or absence, with participants who reported good, fair or poor self-related health having less than 10% chance of being in the highest tertile of PF. Depression was not associated with PF in our older cohort, regardless of CVD status, in contrast with a small study of myocardial infarction patients, aged 65 and older, which found depression score to be one of the best independent predictors of lower PF scores in coronary patients ( 22 ). The same study also reported that peak aerobic capacity was one of the best predictors of low PF and suggested increasing exercise as a means to prevent or treat disability in these patients.
It is not surprising that history of hypertension, high cholesterol requiring pills, and diabetes are all higher in older women with any CVD diagnosis versus no CVD, and that women with CVD are more likely to have recently used statins, aspirin, or warfarin; however, less obvious might be the higher history of hip fracture at age 55 and above and of arthritis, which may also relate to higher aspirin and NSAIDS use.
CHF and PAD are particularly strongly related to low PF. When combined with the additional health burden of history of hip fracture at age 55, which was also associated with a very low likelihood of reporting high PF, women with CHF had a less than 10% likelihood of reporting high PF. Similarly, in women with PAD and history of arthritis, which was also associated with greatly reduced PF, regardless of CVD status, mean PF scores were the lowest reported in the cohort. Whether physical activity and/or weight loss interventions could increase PF in these groups would be particularly interesting to determine. Systematic reviews have concluded that intensive, supervised exercise programs can result in functional gains following hip fracture ( 23 , 24 ), with a subsequent report of modest improvement in physical function after 6 months of home-based functionally oriented exercises in 232 older adults (mean age: 77–79 years; 69% women) who had completed traditional rehabilitation after a hip fracture ( 25 ). A meta-analysis of studies in adults with arthritis and other rheumatic disease, primarily women aged 50 and older, has also indicated that community deliverable exercise programs improve physical function in this group ( 26 ). We are unaware, however, of any exercise or other lifestyle, for example, weight loss, studies of patients with both CVD, and hip fracture or arthritis, particularly CHF or PAD patients with these additional health issues.
While this cross-sectional analysis cannot address how changes in PF relate to the development of CVD or how new CVD diagnoses relate to PF, nor why CVD is associated with low PF, it shows that most factors that we found to be associated with higher PF in women free of CVD are also associated with higher PF in women with CVD, including those with CVD diagnoses associated with the lowest PF, that is, CHF and PAD. Some studies have shown improvement in SF-36 PF scores with increasing time since incident CVD diagnosis ( 27 , 28 ) and others have not ( 29 ). Future WHI analyses will address prospective relationships of baseline PF and incident CVD.
Among the limitations of these analyses are absence of a measure of severity of disease or symptoms (eg, dyspnea, fibrillation, angina), the interventions that may have occurred, such as valve replacement, pacemakers, coronary artery bypass grafting or stents, and the timing of these interventions, as well as the time between events (CHD, stroke, VTE, acute CHF event, and hospitalization for symptoms of PAD), all of which could affect PF. Future research should consider these and other influences (eg, nutrition, pain) on physical function in an effort to improve quality of life among the oldest population with heart disease.
On the other hand, this analysis has considerable strengths; in particular, the ability to study PF among older women with specific CVD diagnoses due to the large number of women aged 80 and older in the multi-ethnic WHI cohort and the length of follow-up, during which CVD diagnoses prior to age 80 accumulated. The richness of the sociodemographic, psychsocial, medical history, and medication data also offers unique insights into potential confounders of the relationships of PF to CVD diagnoses. Future analyses will take advantage of the prospective relationships of baseline and changes in PF to incident CVD as the original 50- to 79-year-old cohort aged into their current 80 and over status and can assess how baseline and changes in recreational activity and/or body weight relate to PF in older women.
Funding
The Women’s Health Initiative (WHI) program is funded by the National Heart, Lung, and Blood Institute, National Institutes of Health, U.S. Department of Health and Human Services through contracts N01WH22110, 24152, 32100-2, 32105-6, 32108-9, 32111-13, 32115, 32118-32119, 32122, 42107-26, 42129-32, and 44221. SMR is supported by the Intramural Research Program, National Institute on Aging, and National Institutes of Health. JSG is supported by the Alzheimer’s Association New Investigator NIRG-11-204070 and Extendicare Foundation. The active study drug and placebo were supplied by Wyeth-Ayerst Research Laboratories, Philadelphia, Pennsylvania. The Women’s Health Initiative Memory Study was funded in part by Wyeth Pharmaceuticals as an ancillary study to the WHI. Wyeth Pharmaceuticals did not participate in the design and conduct of the studies, in the collection, analysis, and interpretation of the data, or in preparation, review or approval of this manuscript.
Short List of WHI Investigators
Program Office: (National Heart, Lung, and Blood Institute, Bethesda, MD) Elizabeth Nabel, Jacques Rossouw, Shari Ludlam, Joan McGowan, Leslie Ford, and Nancy Geller.
Clinical Coordinating Center: (Fred Hutchinson Cancer Research Center, Seattle, WA) Ross Prentice, Garnet Anderson, Andrea LaCroix, Charles L. Kooperberg, Ruth E. Patterson, Anne McTiernan; (Medical Research Labs, Highland Heights, KY) Evan Stein; (University of California at San Francisco, San Francisco, CA) Steven Cummings.
Clinical Centers: (Albert Einstein College of Medicine, Bronx, NY) Sylvia Wassertheil-Smoller; (Baylor College of Medicine, Houston, TX) Aleksandar Rajkovic; (Brigham and Women’s Hospital, Harvard Medical School, Boston, MA) JoAnn E. Manson; (Brown University, Providence, RI) Charles B. Eaton; (Emory University, Atlanta, GA) Lawrence Phillips; (Fred Hutchinson Cancer Research Center, Seattle, WA) Shirley Beresford; (George Washington University Medical Center, Washington, DC) Lisa Martin; (Los Angeles Biomedical Research Institute at Harbor- UCLA Medical Center, Torrance, CA) Rowan Chlebowski; (Kaiser Permanente Center for Health Research, Portland, OR) Yvonne Michael; (Kaiser Permanente Division of Research, Oakland, CA) Bette Caan; (Medical College of Wisconsin, Milwaukee, WI) Jane Morley Kotchen; (MedStar Research Institute/Howard University, Washington, DC) Barbara V. Howard; (Northwestern University, Chi- cago/Evanston, IL) Linda Van Horn; (Rush Medical Center, Chicago, IL) Henry Black; (Stanford Prevention Research Center, Stanford, CA) Marcia L. Stefanick; (State University of New York at Stony Brook, Stony Brook, NY) Dorothy Lane; (The Ohio State University, Columbus, OH) Rebecca Jackson; (University of Alabama at Birmingham, Birmingham, AL) Cora E. Lewis; (University of Arizona, Tucson/ Phoenix, AZ) Cynthia A Thomson; (University at Buffalo, Buffalo, NY) Jean Wactawski-Wende; (University of California at Davis, Sacramento, CA) John Robbins; (University of California at Irvine, CA) F. Allan Hubbell; (University of California at Los Angeles, Los Angeles, CA) Lauren Nathan; (University of California at San Diego, LaJolla/ Chula Vista, CA) Robert D. Langer; (University of Cincinnati, Cincinnati, OH) Margery Gass; (University of Florida, Gainesville/Jacksonville, FL)
References
- 1. Siegel RL, Miller KD, Jemal A . Cancer Statistics, 2015 . Cancer J Clin . 2015. ; 65 ( 1 ): 5 – 29 . doi:10.3322/caac.21254 [DOI] [PubMed] [Google Scholar]
- 2. Administration on Aging (AoA): Projected Future Growth of the Older Population . http://www.aoa.acl.gov/Aging_Statistics/future_growth/future_growth.aspx . Accessed July 26, 2016.
- 3. Painter P, Stewart AL, Carey S . Physical functioning: definitions, measurement, and expectations . Adv Ren Replace Ther . 1999. ; 6 : 110 – 123 . doi:10.1016/S1073-4449(99)70028-2. PMID: 10230878 [DOI] [PubMed] [Google Scholar]
- 4. Butler RN, Gleason HP. Productive Aging: Enhancing Vitality in Later Life . New York, NY: : Springer; ; 1985. . [Google Scholar]
- 5. Benfante R, Reed D, Brody J . Biological and social predictors of health in an aging cohort . J Chron Dis . 1985. ; 38 : 385 – 395 . doi:10.1016/0021-9681(85)90134-1 [DOI] [PubMed] [Google Scholar]
- 6. Curb JD, Guralnik JM, LaCroix AZ, et al. Effective aging: meeting the challenge of growing older . J Am Geriatr Soc . 1990. ; 38 ( 7 ): 827 – 828 . doi:10.1111/j.1532-5415.1990.tb01478.x [DOI] [PubMed] [Google Scholar]
- 7. Rowe JW, Kahn RL . Human aging: usual and successful . Science . 1987. ; 237 : 143 – 149 . PMID: 3299702 [DOI] [PubMed] [Google Scholar]
- 8. Berkman LF, Seeman TE, Albert M, et al. High, usual and impaired functioning in community-dwelling older men and women: findings from the MacArthur Foundation Research Network on Successful Aging . J Clin Epidemiol . 1993. ; 46 ( 10 ): 1129 – 1140 . doi:10.1016/0895-4356(93)90112-E. PMID: 8410098 [DOI] [PubMed] [Google Scholar]
- 9. Manson JE, Greenland P, LaCroix AZ, et al. Walking compared with vigorous exercise for the prevention of cardiovascular events in women . N Engl J Med . 2002. ; 347 ( 10 ): 716 – 725 . doi:10.1056/NEJMoa021067. PMID: 12213942 [DOI] [PubMed] [Google Scholar]
- 10. Sergi G, Verones N, Fontana L, et al. Pre-frailty and risk of cardiovascular disease in elderly men and women: the Pro.V.A. Study . J Am Coll Cardiol . 2015. ; 65 ( 10 ): 976 – 983 . doi:10.1016/j.jacc.2014.12.040. PMID: 25766943 [DOI] [PubMed] [Google Scholar]
- 11. Newman AB, Simonsick EM, Naydeck BL, et al. Association of long-distance corridor walk performance with mortality, cardiovascular disease, mobility limitation, and disability . JAMA . 2006. ; 295 ( 17 ): 2018 – 2026 . doi:10.1001/jama.295.17.2018. PMID: 16670410 [DOI] [PubMed] [Google Scholar]
- 12. Khoudary SRE, Chen H-Y, Barinas-Mitchell E, et al. Simple physical performance measures and vascular health in late midlife women: the Study of Women across the nation . Intern J Cardiol . 2015. ; 182 : 115 – 120 . doi:10.1016/j.ijcard.2014.12.042 [DOI] [PMC free article] [PubMed] [Google Scholar]
- 13. Hoeven TA, Leening MJG, Bindels PJ, et al. Disability and not osteoarthritis predicts cardiovascular disease: a prospective population-based cohort study . Ann Rheum Dis . 2015. ; 74 ( 4 ): 752 – 756 . doi:10.1136/annrheumdis-2013-204388. [DOI] [PubMed] [Google Scholar]
- 14. The Women’s Health Initiative Study Group . Design of the women’s health initiative clinical trial and observational study . Control Clin Trials . 1998. ; 19 ( 1 ): 61 – 109 . doi:10.1016/S0197-2456(97)00078-0. PMID: 9492970 [DOI] [PubMed] [Google Scholar]
- 15. Ware JE, Jr, Sherbourne CD . The MOS 36-item short-form health survey (SF-36). I. Conceptual framework and item selection . Med Care . 1992. ; 30 : 473 – 483 . PMID: 1593914 [PubMed] [Google Scholar]
- 16. Curb JD, McTiernan A, Heckbert SR, et al. Outcomes ascertainment and adjudication methods in the Women’s Health Initiative . Ann. Epidemiol . 2003. ; 13 ( 9 suppl ): S122 – S128 . doi:10.1016/S1047-2797(03)00048-6 PMID: 14575944 [DOI] [PubMed] [Google Scholar]
- 17. Women’s Health Initiative: Manuals and Documents - see Section 8 (Outcomes) for WHI (1993-2005) and Extension Study 1 (2005-2010) . https://www.whi.org/studydoc/WHI%20and%20ES1%20Manual%20of%20Operations/2010–2015%20Extension%20Study%202/01-Extension%20Study%202%20Protocol.pdf . Accessed July 26, 2015.
- 18. Scheier MF, Carver CS, Bridges MW . Distinguishing optimism from neuroticism (and trait anxiety, self-mastery, and self-esteem): a reevaluation of the life orientation test . J Pers Soc Psychol . 1994. ; 67 : 1063 – 1078 . doi:10.1037/0022-3514.67.6.1063. PMID: 7815302 [DOI] [PubMed] [Google Scholar]
- 19. Dale CE, Bowling A, Adamson J, et al. Predictors of patterns of change in health-related quality of life in older women over 7 years: evidence from a prospective cohort study . Age Ageing . 2013. ; 42 : 312 – 318 . doi:10.1093/ageing/aft029. PMID: 23537589 [DOI] [PubMed] [Google Scholar]
- 20. Pahor M, Guralnik JM, Ambrosius WT, et al. Effect of structured physical activity on prevention of major mobility disability in older adults: the LIFE Study Randomized Clinical Trial . JAMA . 2014. ; 311 ( 23 ): 2387 – 2396 . doi:10.1001/jama.2014.5616. PMID: 24866862 [DOI] [PMC free article] [PubMed] [Google Scholar]
- 21. Beavers KM, Beavers DP, Nesbit BA, et al. Effect of an 18-month physical activity and weight loss intervention on body composition in overweight and obese older adults . Obesity . 2014. ; 22 : 325 – 331 . doi:10.1002/oby.20607. PMID: 23963786 [DOI] [PMC free article] [PubMed] [Google Scholar]
- 22. Ades PA, Savage PD, Tischler MD, Poehlman ET, Dee J, Niggel J . Determinants of disability in older coronary patients . Am Heart J . 2002. ; 143 : 151 – 156 . doi:10.1067/mhj.2002.119379. PMID: 11773926 [DOI] [PubMed] [Google Scholar]
- 23. Handoll HHG, Sherrington C, Mak JCS . Interventions for improving mobility after hip fracture sugery in adults (Review) . Cochrane Database Syst Rev . 2011. ( 3 ). Art. No.: CD001704. doi:10.1002/14651858.CD001704.pub4 . doi:10.1002/14651858. PMID: 21412873 [DOI] [PubMed] [Google Scholar]
- 24. Auais MA, Eilayyan O, Mayo NE . Extended exercise rehabilitation after hip fracture improves patients’ physical function: a systematic review and meta-analysis . Phys Ther . 2012. ; 92 : 1437 – 1451 . doi:10.2522/ptj.20110274. PMID: 22822235 [DOI] [PubMed] [Google Scholar]
- 25. Chmelo E, Nicklas B, Davis C, Miller GD, Legault C, Messier S . Physical activity and physical function in older adults with knee osteoarthritis . J Phys Act Health . 2013. ; 10 : 777 – 783 . PMID: 23307503 [DOI] [PMC free article] [PubMed] [Google Scholar]
- 26. Latham NK, Harris BA, Bean JF, et al. Effect of a home-based exercise program on functional recovery following rehabilitation after hip fracture: a randomized clinical trial . JAMA . 2014. ; 311 ( 7 ): 700 – 708 . doi:10.1001/jama.2014.469. PMID: 24549550 [DOI] [PMC free article] [PubMed] [Google Scholar]
- 27. Agarwal S, Schechter C, Zaman A . Assessment of functional status and quality of life after percutaneous coronary revascularization in octogenarians . Age Ageing . 2009. ; 38 : 748 – 751 . doi:10.1093/ageing/afp174. PMID: 19755713 [DOI] [PubMed] [Google Scholar]
- 28. Kristofferzon ML, Löfmark R, Carlsson M . Coping, social support and quality of life over time after myocardial infarction . J Adv Nurs . 2005. ; 52 : 113 – 124 . doi: 10.1111/j.1365-2648.2005.03571 PMID: 16164472 [DOI] [PubMed] [Google Scholar]
- 29. van Jaarsveld CH, Sanderman R, Miedema I, Ranchor AV, Kempen GI . Changes in health-related quality of life in older patients with acute myocardial infarction or congestive heart failure: a prospective study . J Am Geriatr Soc . 2001. ; 49 : 1052 – 1058 . doi:10.1046/j.1532-5415.2001.49208 [DOI] [PubMed] [Google Scholar]