

Abstract
Background
Adrenomedullin (ADM) is a circulating vasoactive peptide involved in vascular homeostasis and endothelial function. Single nucleotide polymorphisms of the ADM gene are associated with blood pressure variability, and elevated levels of plasma midregional proadrenomedullin (MR-pro-ADM) are associated with cardiovascular diseases.
Methods and Results
We investigated the sources of variability of ADM gene expression and plasma MR-pro-ADM concentrations in the general population, and their relationship with markers of atherosclerosis. MR-pro-ADM levels were assessed in 4155 individuals who underwent evaluation of carotid intima-media thickness and arterial rigidity (reflection index and stiffness index). In a subsample of 1372 individuals, ADM gene expression was assessed as part of a transcriptomic study of circulating monocytes. Nongenetic factors explained 45.8% and 7.5% of MR-pro-ADM and ADM expression variability, respectively. ADM expression correlated with plasma C-reactive protein, interleukin-receptor 1A, and myeloperoxidase, whereas MR-pro-ADM levels correlated with C-terminal proendothelin-1, creatinine, and N-terminal pro–B-type natriuretic peptide. Genome-wide association study of ADM expression and MR-pro-ADM levels both identified a single locus encompassing the ADM gene. ADM expression was associated with 1 single nucleotide polymorphism rs11042717 (P=2.36×10⁻¹²), whereas MR-pro-ADM was associated with 2 single nucleotide polymorphisms with additive effects, rs2957692 (P=1.54×10⁻¹³) and rs2957717 (P=4.24×10⁻⁸). Reflection index was independently associated with rs11042717 (P<10−4) and ADM expression (P=0.0002) but not with MR-pro-ADM. Weaker associations were observed for stiffness index. Intima-media thickness was not related to ADM single nucleotide polymorphisms or expression.
Conclusions
These results support an involvement of the ADM gene in the modulation of peripheral vascular tone.
Keywords: adrenomedullin, gene expression, genome wide association scan, vascular stiffness
Adrenomedullin (ADM) is a potent vasodilator and angiogenic peptide involved in cardiovascular and renal protection through autocrine, paracrine, and endocrine pathways. It is produced by a large variety of cells, not only endothelial and vascular smooth muscle cells but also inflammatory cells. Its expression is inducible by shear stress, oxidative stress, and hypoxia. The synthesis and secretion of ADM are stimulated by several proatherogenic and proinflammatory factors, such as angiotensin II, endothelin-1, aldosterone, interleukin-1α (IL-1α) and interleukin-1β, and tumor necrosis factor-α and tumor necrosis factor-β.1,2
In humans, plasma concentrations of ADM are increased in various disease states, including acute myocardial infarction, hypertension, chronic renal failure, and congestive heart failure.1 Because the reliable quantification of ADM in plasma is hindered by several technical difficulties, it has been proposed to use midregional pro-ADM (MR-pro-ADM), a stable peptide present in an equimolar balance with ADM, as a surrogate marker in epidemiological studies.3 Increased MR-pro-ADM plasma levels have been related to future cardiovascular events,4–8 left ventricular hypertrophy,9,10 mortality in congestive heart failure,11 and vascular dysfunction.12–14
The human ADM gene is located on chromosome 11, and genetic polymorphisms in its DNA sequence are associated with blood pressure levels and susceptibility to hypertension.15–17 The contribution of the ADM locus to blood pressure variability in the general population is further supported by the results of genome-wide association studies (GWASs).18,19 All these findings concur to support a causal role of ADM in the cause of cardiovascular diseases although the underlying molecular mechanisms are not yet fully elucidated.
Here, we report the results of an integrative study conducted in a population-based cohort combining information on ADM issued from several levels, including genome-wide genotype data, ADM gene expression in circulating monocytes, and MR-pro-ADM levels in plasma. The aim of this study was to investigate the genetic and nongenetic sources of variability of ADM gene expression and plasma MR-pro-ADM levels and to assess their relationship with markers of atherosclerosis.
Methods
Study Population
A detailed description of the study population is provided elsewhere.20 Study participants of both sexes aged 35 to 74 years were successively enrolled into the Gutenberg Health Study (GHS), a community-based single-center cohort study in the Rhein-Main region in Western mid-Germany. Participants were of European origin. All subjects gave written informed consent. Ethical approval was given by the local ethics committee and by the local and federal data safety commissioners. Hypertension and diabetes mellitus were defined as previously.21
Biological Measurements
Plasma creatinine (Abbott), NT-pro–B-type natriuretic peptide (Roche), C-reactive protein (Abbott), myeloperoxidase (Prognostix), IL-18 (MBL), IL-1 receptor antagonist (R&D Systems), and C-terminal proendothelin-1 (BRAHMS) levels were measured using commercially available assays according to manufacturer’s recommendations. Plasma MR-pro-ADM levels were measured using the commercially available immunolumino-metric assay (BRAHMS AG, Henningsdorf/Berlin, Germany).3
Carotid Arteries Ultrasound
Ultrasound exploration of carotid arteries was performed using an 11 to 3 MHz linear array transducer of the i33 system (Philips, Bove, the Netherlands).21 Intima-media thickness (IMT) was measured as recommended 1 cm before carotid bulb, bilaterally at the far wall. The IMT phenotype used in the present analysis was the average of right and left IMT measurements.
Evaluation of Vascular Tone and Arterial Stiffness
Reflection index (RI) reflecting vascular tone of small arteries and stiffness index (SI) reflecting large artery stiffness were measured by Pulse Trace 2000 device (Micro Medical Ltd., Rochester, United Kingdom) as described elsewhere.22
Genotyping and Imputation
Genome-wide genotyping was performed using the Affymetrix Genome-Wide Human Single Nucleotide Polymorphism (SNP) array 6.0 (http://www.affymetrix.com). Genotyping was performed separately in cohort GHS I including 2990 individuals first enrolled in GHS and in cohort GHS II including 1165 individuals subsequently enrolled. Calling of genotypes was performed separately in each cohort.20 Genome-wide imputation of genotypes was performed in cohorts GHS I and GHS II separately using MACH (version 1.0.18.c) and minimac (release 2012-03-14) software with the 1000 Genomes release of February 2012 reference data set (hg19/build37). Only SNPs with good imputation quality (r2>0.3) were kept. Imputation-based GWAS was performed using mach2qtl (version 1.1.0, 2011-05-23).
ADM Gene Expression Measurement
Expression level of the ADM gene was assessed from circulating monocytes in 1372 individuals of cohort GHS I as part of a genome-wide expression study using the Illumina HT-12 version 3 Beadchip (http://www.Illumina.com). Detailed protocol for separation of monocytes, RNA preparation, and microarray hybridization is reported elsewhere.20 ADM gene expression was detected by a single probe located in the 3′ untranslated region sequence of the gene (ILMN_1708934) and which had a perfect quality score according to ReMOAT (http://remoat.sysbiol.cam.ac.uk/). After preprocessing and quantile normalization, data were transformed using an arcsinh-transformation.
Statistical Analysis
R software (version 2.13.0; The R Foundation for Statistical Computing) and SAS software (version 9.3; SAS Institute Inc, Cary, NC) were used for statistical analysis. Association of ADM expression and plasma MR-pro-ADM with cardiovascular risk factors (age, sex, body mass index [BMI], type 2 diabetes mellitus, hypertension, and current smoking) was assessed by linear regression analysis. Association of ADM expression and plasma MR-pro-ADM levels with circulating biomarkers and vascular phenotypes was assessed by Pearson correlation coefficients. Partial correlations were adjusted for age, sex, BMI, and smoking. Independent predictors of ADM expression and plasma MR-pro-ADM levels were selected by stepwise regression analysis. All biomarkers were log-transformed to remove positive skewness. In regression of vascular phenotypes on SNPs, genotypes were introduced as categorical variables (2 df). Because the 2 SNPs had a dominant effect on vascular phenotypes, their independent effect was tested by jointly introducing them as binary variables in the regression model. SNP×SNP interaction was tested by introducing a product term in the model (1 df).
The GWAS of plasma MR-pro-ADM levels was performed separately in each cohort using PLINK.23 After quality control filters, 629 283 SNPs were common to both cohorts. Age- and sex-adjusted MR-pro-ADM levels were analyzed assuming additive allele effects for each SNP. The validity of this assumption was then formally tested for the SNPs found associated with phenotype. The results of both cohorts were combined in a meta-GWAS using METAL24 with a fixed-effect model relying on an inverse-variance weighting. To identify additional signals after accounting for the effect of the hit SNP of the meta-GWAS, a conditional analysis adjusting for the hit SNP was performed. Conditional analyses were repeated until no more significant association was found. The GWAS of age- and sex-adjusted ADM expression levels was performed with PLINK in the subsample of cohort GHS I with expression measurements.
The r2 coefficient of linkage disequilibrium (LD) between SNPs was estimated by maximum-likelihood method. Regional association plots were obtained using SNAP.25 Power was calculated using Quanto (http://hydra.usc.edu/gxe/). A P value <0.05 was considered significant, except for GWAS where the commonly used genome-wide significance level was applied (P<5×10⁻⁸). The potential functionality of SNPs was investigated using the HaploReg software (http://www.broadinstitute.org/mammals/haploreg/haploreg.php).
Results
Plasma MR-pro-ADM levels were measured in 4155 individuals of whom 1372 also had a measurement of monocyte ADM gene expression. Descriptive characteristics of the 2 samples are shown in Table I in the Data Supplement, and associations of MR-pro-ADM levels and ADM gene expression with risk factors are shown in Table II in the Data Supplement.
Independent correlates of ADM gene expression were sex, BMI, age, and smoking, which all together explained 7.5% of the variability of expression. Independent correlates of plasma MR-pro-ADM were age, BMI, smoking, sex, hypertension, and diabetes mellitus, which all together explained 45.8% of the variability of plasma levels. The correlation between monocyte ADM gene expression and plasma MR-pro-ADM levels was relatively modest (r=0.13 after adjustment for risk factors).
GWAS of ADM Gene Expression
The GWAS of ADM gene expression was performed in 1372 individuals. At a genome-wide significance level, 31 SNPs were associated with ADM gene expression (herein referred to as eSNPs), all located on chromosome 11p15 in a 609-kb region overlapping the SBF2 and ADM genes (Figure 1). The lead eSNP rs11042717 was located in an intron of SBF2, 23 kb upstream from the transcription start site of the ADM gene. The minor allele C frequency (0.45) was associated with increased ADM gene expression in a codominant fashion (P=2.36×10⁻¹²). After conditioning on rs11042717, no other SNP was significantly associated with ADM expression. Imputation analysis did not reveal any stronger hit than rs11042717. The rs11042717 effect was independent of cardiovascular risk factors and accounted for 3.2% of ADM expression variability. We looked for potential interaction of genotype with age, sex, BMI, or smoking but none reached statistical significance. None of the ADM-associated SNPs were associated with SBF2 expression (P>0.55), and SBF2 expression did not correlate to ADM expression (P=0.35).
Figure 1.
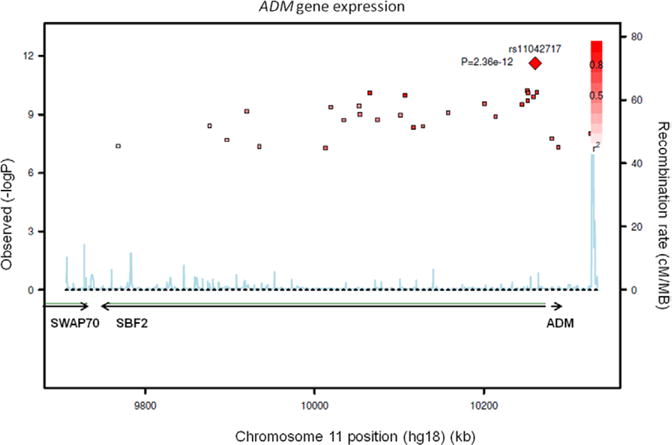
Regional association plot of monocyte ADM gene expression with single nucleotide polymorphisms (SNPs) of the 11p15 locus encompassing the SBF2 and ADM genes. The left vertical axis shows the P value (−log10) of association, the right vertical axis shows the recombination rate in the region (cM/Mb). The best SNPs associated with ADM gene expression (eSNPs) is shown by a red diamond. Other eSNPs significantly associated with the expression are shown by squares whose color goes from deep red to light pink according to decreasing linkage disequilibrium (r2) with the best eSNP.
The eSNP rs11042717 was associated with plasma MR-pro-ADM levels (P=0.0002). The minor allele C was associated with increased levels and explained 1% of variability. The effect of rs11042717 on MR-pro-ADM levels was weakened by adjustment for ADM expression but remained significant (P=0.009).
GWAS of Plasma MR-Pro-ADM Levels
The GWAS of MR-pro-ADM levels was performed in 4155 individuals. At a genome-wide significance level, 34 SNPs were associated with plasma MR-pro-ADM levels (herein referred to as pSNPs), all located at the 11p15 locus already associated with ADM expression. The lead pSNP rs2957692 was located in the 3′ region of the ADM gene (Figure 2), and its minor allele G (minor allele frequency, 0.39) was associated with increased MR-pro-ADM levels in a codominant fashion (P=1.54×10⁻¹³). Conditional analysis on rs2957692 revealed 3 additional pSNPs associated with MR-pro-ADM levels, all at the 11p15 locus, the strongest signal being observed with the pSNP rs2957717 (P=4.24×10⁻⁸). The minor allele T of rs2957717 (minor allele frequency, 0.30) was associated with decreased MR-pro-ADM levels. After conditioning on both rs2957692 and rs2957717, no other SNP was significantly associated with MR-pro-ADM levels. The 2 pSNPs, rs2957717 and rs2957692, located 14 kb apart from each other, were not in LD (r2=0.0006). They had additive effects on MR-pro-ADM levels and accounted together for 1.5% of the variability of MR-pro-ADM levels. There was no interaction of either SNP with age, sex, BMI, or smoking.
Figure 2.
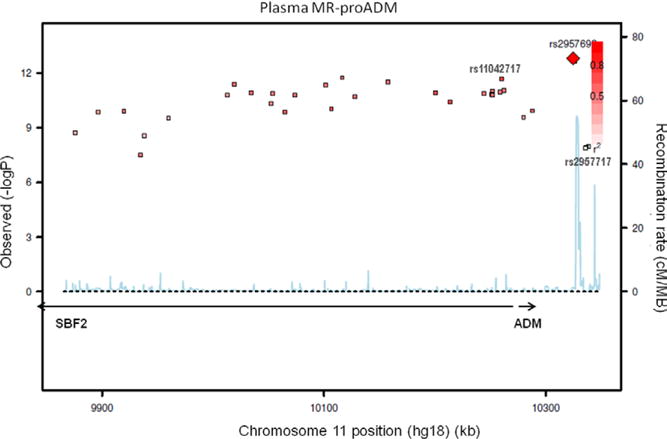
Regional association plot of plasma midregional proadrenomedullin (MR-pro-ADM) with single nucleotide polymorphisms of the 11p15 locus encompassing the SBF2 and ADM genes (see legend of Figure 1).
The lead pSNP rs2957692 was in strong LD with the lead eSNP rs11042717 (r2=0.67). In a regression analysis, including rs11042717 and the 2 pSNPs rs2957692 and rs2957717, only the 2 pSNPs remained significantly associated with plasma MR-pro-ADM.
The imputation-based GWAS identified the same region as the original one. The strongest hit was observed with an imputed SNP rs7925720 (minor allele frequency, 0.37; P=8.28×10⁻¹⁵). The rs7925720 was in nearly complete association with the typed lead pSNP rs2957692 (r2=0.95) and explained almost the same proportion of the variability of MR-pro-ADM (1.05% versus 0.96%). Because of the nearly complete association between the 2 pSNPs, it was impossible to disentangle their respective roles.
Association of ADM Gene Expression and Plasma MR-Pro-ADM Levels With Vascular Phenotypes
ADM gene expression negatively correlated with RI (r=−0.13 and −0.08 before and after adjustment for risk factors), whereas it was not associated with SI and IMT (Table 1). Plasma MR-pro-ADM levels were positively correlated with SI and IMT in raw analyses, but these correlations disappeared after adjustment for risk factors (Table 1).
Table 1.
Correlation of ADM Gene Expression and Plasma MR-Pro-ADM Levels With Vascular Parameters (n=1372)
|
ADM Gene Expression
|
Plasma MR-Pro-ADM
|
P Value | ||||||
|---|---|---|---|---|---|---|---|---|
| Raw Correlation | P Value | Adjusted Correlation* | P Value | Raw Correlation | P Value | Adjusted Correlation* | ||
| RI | −0.134 | <0.0001 | −0.082 | 0.003 | 0.023 | 0.412 | −0.023 | 0.398 |
| SI | −0.040 | 0.135 | −0.033 | 0.234 | 0.251 | <0.0001 | −0.005 | 0.856 |
| IMT | −0.009 | 0.726 | −0.045 | 0.093 | 0.376 | <0.0001 | 0.026 | 0.344 |
IMT indicates Intima-media thickness; MR-Pro-ADM, midregional proadrenomedullin; RI, reflection index; and SI, stiffness index.
Adjusted for age, sex, body mass index, and smoking. Data are Pearson correlation coefficients.
Association of Vascular Phenotypes With SNPs at the ADM Locus
In 4155 individuals, RI was significantly associated with the 3 ADM SNPs identified by GWAS of plasma and expression levels (Table 2). When the 3 SNPs were introduced simultaneously in a regression model, rs2957717 and rs11042717 showed independent effects on RI, whereas rs2957692 was no longer significant. The rs11042717/TT and rs2957717/TT genotypes were both independently associated with reduced RI (P<10−4 and P=0.009, respectively; P=0.18 for interaction between the 2 SNPs). Further adjustment on plasma MR-pro-ADM and ADM gene expression maintained the association of RI with rs11042717, whereas the effect of rs2957717 was no longer significant. However, it should be noted that this last analysis had a reduced statistical power because it was restricted to the 1372 individuals with ADM expression. In the final model, including simultaneously cardiovascular risk factors, plasma MR-pro-ADM levels, ADM expression, and rs11042717/TT genotype, ADM expression was negatively associated with RI independently of genotype, whereas plasma MR-pro-ADM levels was not associated with RI (Table 3).
Table 2.
Association of ADM SNPs With RI and SI in the Total Sample (n=4155)
| SNP | Genotype | n | RI, %
|
SI, m/s
|
||||
|---|---|---|---|---|---|---|---|---|
| Adjusted Mean* | SE | P Value | Adjusted Mean* | SE | P Value | |||
| rs11042717 | CC | 874 | 67.4 | 0.47 | <10−4 | 9.42 | 0.09 | 0.0009 |
| CT | 1998 | 67.6 | 0.31 | 9.42 | 0.06 | |||
| TT | 1201 | 65.5 | 0.40 | 9.08 | 0.08 | |||
| rs2957717 | CC | 1945 | 66.8 | 0.32 | 0.006 | 9.27 | 0.06 | 0.004 |
| TC | 1726 | 67.5 | 0.34 | 9.45 | 0.06 | |||
| TT | 357 | 65.0 | 0.74 | 8.98 | 0.14 | |||
| rs2957692 | AA | 1498 | 66.2 | 0.36 | 0.025 | 9.13 | 0.07 | 0.002 |
| GA | 1895 | 67.4 | 0.32 | 9.43 | 0.06 | |||
| GG | 645 | 67.5 | 0.55 | 9.45 | 0.10 | |||
ADM indicates adrenomedullin; RI, reflection index; SI, stiffness index; and SNP, single nucleotide polymorphism.
Adjusted for age, sex, body mass index, and smoking
Table 3.
Results of Linear Regression Analysis of RI on ADM Genotype, Plasma MR-Pro-ADM and ADM Expression (n=1372)
| Model | rs11042717 (TT vs CT+CC)
|
MR-Pro-ADM (log)
|
ADM Expression
|
||||||
|---|---|---|---|---|---|---|---|---|---|
| Estimate* | SE | P Value | Estimate* | SE | P Value | Estimate* | SE | P Value | |
| Genotype only | −3.75 | 0.85 | <10−4 | … | … | … | … | … | … |
| Genotype+MR-pro-ADM | −3.86 | 0.86 | <10−4 | −2.88 | 2.13 | 0.18 | … | … | … |
| Genotype+ADM expression | −4.33 | 0.86 | <10−4 | … | … | … | −4.03 | 1.05 | 10−4 |
| Genotype+MR-pro-ADM+ADM expression | −4.39 | 0.86 | <10−4 | −2.05 | 2.13 | 0.34 | −3.95 | 1.06 | 2×10⁻⁴ |
MR-Pro-ADM indicates midregional proadrenomedullin; and RI, reflection index.
Estimate of linear regression coefficients adjusted for age, sex, body mass index, and smoking.
The 3 SNPs were associated with SI in a similar fashion (Table 2). When including in the same model, MR-pro-ADM levels, ADM expression, and rs11042717/TT genotype, only the genotype remained associated with SI (Table 4). The association, however, was weaker than with RI. Both indexes reflect vascular rigidity and they were highly correlated (r=0.52; P<10−4 after adjustment for risk factors). In multivariate regression, RI remained significantly associated with rs11042717 after adjustment for SI, whereas the association of SI with SNP did not persist after adjustment for RI. The IMT phenotype was not associated with any of the 3 SNPs (data not shown).
Table 4.
Results of Linear Regression Analysis of SI on ADM Genotype, Plasma MR-Pro-ADM and ADM Expression (n=1372)
| Model | rs11042717 (TT vs CT+CC)
|
MR-Pro-ADM (log)
|
ADM Expression
|
||||||
|---|---|---|---|---|---|---|---|---|---|
| Estimate* | SE | P Value | Estimate* | SE | P Value | Estimate* | SE | P Value | |
| Genotype only | −0.36 | 0.16 | 0.02 | … | … | … | … | … | … |
| Genotype+MR-pro-ADM | −0.38 | 0.16 | 0.02 | −0.18 | 0.40 | 0.66 | … | … | … |
| Genotype+ADM expression | −0.41 | 0.16 | 0.01 | … | … | … | −0.32 | 0.20 | 0.12 |
| Genotype+MR-pro ADM+ADM expression | −0.42 | 0.16 | 0.01 | −0.11 | 0.41 | 0.78 | −0.32 | 0.20 | 0.11 |
MR-Pro-ADM indicates midregional proadrenomedullin.
Estimate of linear regression coefficients adjusted for age, sex, body mass index, and smoking.
For purpose of replication, we interrogated the data of a meta-GWAS of carotid-femoral pulse wave velocity (CFPWV), a standard measure of arterial stiffness.26 None of the ADM SNPs were associated with CFPWV (all P>0.20). Conversely, we examined whether the SNP rs7152623 found associated with CFPWV in the meta-GWAS26 was related to RI and SI GHS, but neither association was significant (P=0.85 and 0.84, respectively).
Association of ADM Gene Expression and Plasma MR-Pro-ADM Levels With Circulating Biomarkers
All biomarkers except IL-18 were significantly associated with ADM gene expression (Table 5). The strongest correlations were observed with C-reactive protein, IL1-Ra, and myeloperoxidase, which were the only biomarkers associated with ADM expression after adjustment for cardiovascular risk factors. In a stepwise regression, including cardiovascular risk factors (age, sex, BMI, and smoking), and circulating bio-markers, the independent predictors of ADM gene expression were C-reactive protein, sex, IL1-Ra, myeloperoxidase, and MR-pro-ADM levels, which all together explained 15.4% of the variability of expression.
Table 5.
Correlation of ADM Gene Expression and Plasma MR-Pro-ADM Levels With Circulating Biomarkers (n=1372)
|
ADM Gene Expression
|
Plasma MR-Pro-ADM
|
|||||||
|---|---|---|---|---|---|---|---|---|
| Raw Correlation | P Value | Adjusted Correlation* | P Value | Raw Correlation | P Value | Adjusted Correlation* | P Value | |
| Creatinine | −0.103 | 0.0001 | 0.007 | 0.811 | 0.313 | <0.0001 | 0.405 | <0.0001 |
| CRP | 0.254 | <0.0001 | 0.205 | <0.0001 | 0.288 | <0.0001 | 0.128 | <0.0001 |
| NT-proBNP | 0.073 | 0.009 | 0.010 | 0.715 | 0.423 | <0.0001 | 0.325 | <0.0001 |
| MPO | 0.180 | <0.0001 | 0.160 | <0.0001 | 0.073 | 0.007 | 0.026 | 0.343 |
| IL-18 | 0.012 | 0.651 | 0.041 | 0.146 | 0.156 | <0.0001 | 0.077 | 0.006 |
| IL1-Ra | 0.260 | <0.0001 | 0.188 | <0.0001 | 0.359 | <0.0001 | 0.242 | <0.0001 |
| CT-proET-1 | 0.065 | 0.016 | 0.042 | 0.137 | 0.675 | <0.0001 | 0.622 | <0.0001 |
| MR-pro-ADM | 0.176 | <0.0001 | 0.128 | <0.0001 | … | … | … | … |
CT-proET-1 indicates C-terminal proendothelin-1; CRP, C-reactive protein; IL, interleukin; MPO, myeloperoxidase; MR-pro-ADM, midregional proadrenomedullin; and NT-proBNP, NT-pro–B-type natriuretic peptide.
Adjusted for age, sex, body mass index, and smoking. Data are Pearson correlation coefficients.
Associations of circulating biomarkers with plasma MR-pro-ADM levels were radically different from those of ADM expression (Table 5). After adjustment for risk factors, the strongest correlations were observed with C-terminal proendothelin-1, creatinine, and NT-pro–B-type natriuretic peptide, none being associated with ADM expression. By contrast, plasma MR-pro-ADM levels did not correlate with myeloperoxidase. The independent predictors of MR-pro-ADM levels selected by stepwise regression were C-terminal proendothelin-1, BMI, age, NT-pro–B-type natriuretic peptide, IL1-Ra, creatinine, ADM expression, smoking, and sex. These factors accounted for 71.7% of the variability of plasma MR-pro-ADM levels, the major part being attributable to C-terminal proendothelin-1.
Discussion
The present study is the first large-scale investigation of ADM integrating data from multiple sources (ie, DNA sequence variability, gene expression in monocytes, and plasma protein levels). This integrative analysis shed new light on the role of ADM in cardiovascular pathophysiology.
The GWAS of ADM expression and plasma MR-pro-ADM revealed a strong effect of the ADM locus on both phenotypes. No other locus was detected at a genome-wide level for either phenotype, which does not exclude the possibility of more modest genetic contributors that would not have passed the GWAS stringent level of significance. A recent GWAS in 3444 Europeans reported 2 loci associated with plasma MR-pro-ADM, KLKB1 encoding prekallikrein and F12 encoding factor XII, these 2 loci being even more strongly associated with MR-pro-ADM than the ADM locus itself.27 In our study, the lead SNP rs4253238 at the KLKB1 locus had a nominal P value of 0.065. The lead SNP rs2731672 at the F12 locus was not correctly imputed in GHS, but there was no significant SNP in the region (all P>0.10). Yet, the power for replicating these signals in the 4155 individuals of GHS was ≈100%. Confirmation of these loci in further studies is warranted.
ADM expression was associated with a single cis eSNP rs11042717 located upstream from the ADM gene sequence in an intron of the nearby SBF2 gene. The rs11042717 is in almost complete association (r2=0.87) with the rs11042725, a SNP not genotyped in the present study and whose functional role on ADM expression has been suggested by reporter gene assays.28 The rs11042725 SNP is in the 5′ region of the ADM gene and according to the HaploReg software, it is located within a strong enhancer when tested in human umbilical vein endothelial cells, which supports a role in expression regulation. However, in the imputation-based GWAS, the rs11042725 did not yield a stronger signal than rs11042717. The rs11042717 is also in almost complete association with the lead pSNP of plasma MR-pro-ADM, rs2957692. The HaploReg software did not predict any functional role for either SNP. Because of the strong LD between all these SNPs, it is impossible to disentangle their effect. Experimental studies are required to understand the underlying functional mechanisms.
The GWAS of MR-pro-ADM identified a second pSNP rs2957717 that was not in LD with the other SNPs and had independent additive effect on MR-pro-ADM. Unlike the lead pSNP, rs2957717 was not associated with monocyte ADM expression, emphasizing the existence of a likely different regulation mechanism in monocytes and endothelial cells. Other possible mechanisms of genetic control consistent with a location of the SNP in the 3′ untranslated region may be those involved in protein degradation, stability, or clearance. According to HaploReg, the rs2957717 SNP is located in an intron of the nearby AMPD3 gene, which codes for an erythrocyte-specific AMP deaminase. Given the erythroid specificity of this isoform, the functional role of AMPD3 in endothelial cells is unlikely.
The association of ADM SNPs with RI and SI suggests a causal involvement of ADM in the modulation of vascular tone. Because ADM SNPs were associated with mono-cyte ADM expression and plasma MR-pro-ADM levels, a hypothesis would be that the SNP effect is mediated by one or both of these proximal phenotypes. However, the association was not modified by adjustment on plasma levels and even strengthened by adjustment on monocyte gene expression, indicating that the hypothesis of mediation by these intermediate traits was not supported. A likely explanation is that genetic variants exert their effect through modulation of ADM expression in other sites, especially the vascular endothelium. It is also known that the colocalization of cis eSNPs and disease-associated variants at the same locus are not sufficient to infer a causal mechanism because there could be 2 distinct causal variants in LD with the SNP.29 However, circulating MR-pro-ADM was not associated with RI and its association with SI disappeared after adjustment for cardiovascular risk factors. In the Framingham Heart Study, which is comparable with GHS in terms of sample size and study population, plasma adrenomedullin was not associated with several measures of arterial stiffness, including CFPWV.30 The only correlation was found with pulse pressure, and exclusively in men.30 This suggests that circulating adrenomedullin, despite being predominantly of endothelial origin, does not exactly reflect the in situ vascular synthesis. Functional experiments in endothelial cells are required to understand the molecular mechanisms involved in the genetic control of vascular tonus.
At variance with the present study, the ADM locus was not found in a large-scale meta-GWAS of CFPWV, a standard measure of arterial stiffness.26 However, we failed to replicate the BCL11B locus identified in the meta-GWAS,26 despite a 92% power in the GHS study. These discrepancies are likely to be explained by differences in phenotypes because CFPWV measures aortic stiffness, whereas RI is a measure of peripheral vasodilation and relative wave reflection, and SI has been shown to correlate with pulse wave velocity poorly.31
There are limitations in our study that should be considered. ADM expression was assessed in monocytes and MR-pro-ADM levels were assessed in plasma, whereas circulating ADM levels mainly originate from endothelial synthesis. The circulating levels of MR-pro-ADM may not reflect the autocrine and paracrine activities of ADM that may play a major role within the vascular wall. ADM expression and MR-pro-ADM levels were assessed by a single measure and did not account for time-variability. SNPs included in GWAS were biased toward high allele frequency and rare variants of interest that were not correctly imputed may have been missed. The RI and SI scores are surrogate measures of arterial stiffness that may lack sensitivity/specificity.
In conclusion, we showed that genetic variants at the ADM locus influence ADM gene expression in monocytes and circulating levels of MR-pro-ADM. These variants are also associated with modulation of vascular tone, mainly of peripheral arteries. The molecular mechanisms mediating this association need to be elucidated in further experimental work. Additional studies will be required to evaluate whether these variants are related to the occurrence of cardiovascular diseases and whether ADM should be considered as a target for therapy.
Supplementary Material
CLINICAL PERSPECTIVE.
Adrenomedullin (ADM) is a potent vasodilator and angiogenic peptide involved in cardiovascular and renal protection through autocrine, paracrine, and endocrine pathways. It is produced by a large variety of cells, not only endothelial and vascular smooth muscle cells but also inflammatory cells. Elevated circulating levels of midregional proadrenomedullin, a surrogate measure of plasma ADM levels, have been consistently associated with increased cardiovascular risk in epidemiological studies. However, whether this association is causal or consequential is unclear. To gain further insight into the role of ADM in cardiovascular pathophysiology, we performed an integrative study combining genome-wide genotype data, gene expression from circulating monocytes, plasma midregional proadrenomedullin levels, and markers of arterial stiffness in a population-based cohort, including 1372 individuals. By testing association with >600 000 variants covering the whole genome, we identified a region encompassing the ADM gene, which was highly associated with both ADM gene expression and plasma midregional proadrenomedullin. The ADM variant showing the strongest association was also associated with reflection index, a marker of peripheral vascular tone. These results support a causal involvement of ADM in the modulation of vascular tone. The molecular mechanisms mediating this association need to be elucidated in experimental work. Additional studies will be required to evaluate whether the same variants are related to the occurrence of cardiovascular diseases and whether ADM should be considered as a target for therapy.
Acknowledgments
Sources of Funding
The Gutenberg Health Study is funded through the government of Rheinland-Pfalz (http://www.rlp.de/; Stiftung Rheinland-Pfalz für Innovation, contract AZ 961–386261/733), the research programs Wissen schafft Zukunft and Schwerpunkt Vaskuläre Prävention of the Johannes Gutenberg-University of Mainz (http://www.uni-mainz.de/), and its contract with Boehringer Ingelheim (http://www.boehringer-ingelheim.de/) and PHILIPS Medical Systems (http://www.health-care.philips.com/), including an unrestricted grant for the Gutenberg Health Study. Specifically, the research reported in this article was supported by the National Genome Network NGFNplus (http://www.ngfn.de/en/start.html; contract 01GS0833 and 01GS0831) by the Bundesministerium für Bildung und Forschung, and a joint funding grant from the Bundesministerium für Bildung und Forschung, and the Agence Nationale de la Recherche, France (http://www.agence-nationale-recherche.fr; contract Bundesministerium für Bildung und Forschung 01KU0908A and ANR 09 GENO 106 01). Dr Beygui was supported by a grant from the Fondation pour la Recherche Médicale (contract ING20091218112).
Footnotes
The Data Supplement is available at http://circgenetics.ahajournals.org/lookup/suppl/doi:10.1161/CIRCGENETICS.113.000456/-/DC1.
Disclosures
Dr Blankenberg is member of the BRAHMS GmbH medical advisory board. Assays for measuring MR-pro-ADM were provided by BRAHMS for free. Dr Mitchell is owner of Cardiovascular Engineering, Inc, a company that designs and manufactures devices that measure vascular stiffness. The company uses these devices in clinical trials that evaluate the effects of diseases and interventions on vascular stiffness. The other authors report no conflicts.
References
- 1.Jougasaki M, Burnett JC., Jr Adrenomedullin: potential in physiology and pathophysiology. Life Sci. 2000;66:855–872. doi: 10.1016/s0024-3205(99)00358-6. [DOI] [PubMed] [Google Scholar]
- 2.Tsuruda T, Burnett JC., Jr Adrenomedullin: an autocrine/paracrine factor for cardiorenal protection. Circ Res. 2002;90:625–627. doi: 10.1161/01.res.0000015462.11528.28. [DOI] [PubMed] [Google Scholar]
- 3.Morgenthaler NG, Struck J, Alonso C, Bergmann A. Measurement of midregional proadrenomedullin in plasma with an immunoluminometric assay. Clin Chem. 2005;51:1823–1829. doi: 10.1373/clinchem.2005.051110. [DOI] [PubMed] [Google Scholar]
- 4.Brouwers FP, de Boer RA, van der Harst P, Struck J, de Jong PE, de Zeeuw D, et al. Influence of age on the prognostic value of mid-regional pro-adrenomedullin in the general population. Heart. 2012;98:1348–1353. doi: 10.1136/heartjnl-2012-302390. [DOI] [PubMed] [Google Scholar]
- 5.Khan SQ, O’Brien RJ, Struck J, Quinn P, Morgenthaler N, Squire I, et al. Prognostic value of midregional pro-adrenomedullin in patients with acute myocardial infarction: the LAMP (Leicester Acute Myocardial Infarction Peptide) study. J Am Coll Cardiol. 2007;49:1525–1532. doi: 10.1016/j.jacc.2006.12.038. [DOI] [PubMed] [Google Scholar]
- 6.Schnabel RB, Schulz A, Messow CM, Lubos E, Wild PS, Zeller T, et al. Multiple marker approach to risk stratification in patients with stable coronary artery disease. Eur Heart J. 2010;31:3024–3031. doi: 10.1093/eurheartj/ehq322. [DOI] [PubMed] [Google Scholar]
- 7.Tzikas S, Keller T, Ojeda FM, Zeller T, Wild PS, Lubos E, et al. MR-pro-ANP and MR-proADM for risk stratification of patients with acute chest pain. Heart. 2013;99:388–395. doi: 10.1136/heartjnl-2012-302956. [DOI] [PubMed] [Google Scholar]
- 8.Wild PS, Schnabel RB, Lubos E, Zeller T, Sinning CR, Keller T, et al. Midregional proadrenomedullin for prediction of cardiovascular events in coronary artery disease: results from the AtheroGene study. Clin Chem. 2012;58:226–236. doi: 10.1373/clinchem.2010.157842. [DOI] [PubMed] [Google Scholar]
- 9.Bhandari SS, Davies JE, Struck J, Ng LL. The midregional portion of pro-adrenomedullin is an independent predictor of left ventricular mass index in hypertension. Metabolism. 2010;59:7–13. doi: 10.1016/j.metabol.2009.06.019. [DOI] [PubMed] [Google Scholar]
- 10.Coutinho T, Al-Omari M, Mosley TH, Jr, Kullo IJ. Biomarkers of left ventricular hypertrophy and remodeling in blacks. Hypertension. 2011;58:920–925. doi: 10.1161/HYPERTENSIONAHA.111.178095. [DOI] [PMC free article] [PubMed] [Google Scholar]
- 11.Adlbrecht C, Hülsmann M, Strunk G, Berger R, Mörtl D, Struck J, et al. Prognostic value of plasma midregional pro-adrenomedullin and C-terminal-pro-endothelin-1 in chronic heart failure outpatients. Eur J Heart Fail. 2009;11:361–366. doi: 10.1093/eurjhf/hfp004. [DOI] [PubMed] [Google Scholar]
- 12.Coutinho T, Turner ST, Mosley TH, Kullo IJ. Biomarkers associated with pulse pressure in African-Americans and non-Hispanic whites. Am J Hypertens. 2012;25:145–151. doi: 10.1038/ajh.2011.193. [DOI] [PMC free article] [PubMed] [Google Scholar]
- 13.Kita T, Kitamura K, Hashida S, Morishita K, Eto T. Plasma adrenomedullin is closely correlated with pulse wave velocity in middle-aged and elderly patients. Hypertens Res. 2003;26:887–893. doi: 10.1291/hypres.26.887. [DOI] [PubMed] [Google Scholar]
- 14.Schnabel RB, Wild PS, Schulz A, Zeller T, Sinning CR, Wilde S, Kunde J, et al. Multiple endothelial biomarkers and noninvasive vascular function in the general population: the Gutenberg Health Study. Hypertension. 2012;60:288–295. doi: 10.1161/HYPERTENSIONAHA.112.191874. [DOI] [PubMed] [Google Scholar]
- 15.Chen S, Lu X, Zhao Q, Wang L, Li H, Huang J. Association of adrenomedullin gene polymorphisms and blood pressure in a Chinese population. Hypertens Res. 2013;36:74–78. doi: 10.1038/hr.2012.132. [DOI] [PubMed] [Google Scholar]
- 16.Ishimitsu T, Tsukada K, Minami J, Ono H, Matsuoka H. Variations of human adrenomedullin gene and its relation to cardiovascular diseases. Hypertens Res. 2003;26:S129–S134. doi: 10.1291/hypres.26.s129. [DOI] [PubMed] [Google Scholar]
- 17.Li Y, Staessen JA, Li LH, Gao PJ, Thijs L, Brand E, et al. Blood pressure and urinary sodium excretion in relation to the A-1984G adrenomedullin polymorphism in a Chinese population. Kidney Int. 2006;69:1153–1158. doi: 10.1038/sj.ki.5000213. [DOI] [PubMed] [Google Scholar]
- 18.Ehret GB, Munroe PB, Rice KM, Bochud M, Johnson AD, Chasman DI, et al. Genetic variants in novel pathways influence blood pressure and cardiovascular disease risk. Nature. 2011;478:103–109. doi: 10.1038/nature10405. [DOI] [PMC free article] [PubMed] [Google Scholar]
- 19.Wain LV, Verwoert GC, O’Reilly PF, Shi G, Johnson T, Johnson AD, et al. LifeLines Cohort Study; EchoGen consortium; AortaGen Consortium; CHARGE Consortium Heart Failure Working Group; KidneyGen consortium; CKDGen consortium; Cardiogenics consortium; CardioGram Genome-wide association study identifies six new loci influencing pulse pressure and mean arterial pressure. Nat Genet. 2011;43:1005–1011. doi: 10.1038/ng.922. [DOI] [PMC free article] [PubMed] [Google Scholar]
- 20.Zeller T, Wild P, Szymczak S, Rotival M, Schillert A, Castagne R, et al. Genetics and beyond–the transcriptome of human monocytes and disease susceptibility. PLoS One. 2010;5:e10693. doi: 10.1371/journal.pone.0010693. [DOI] [PMC free article] [PubMed] [Google Scholar]
- 21.Neumann JT, Tzikas S, Funke-Kaiser A, Wilde S, Appelbaum S, Keller T, et al. Association of MR-proadrenomedullin with cardiovascular risk factors and subclinical cardiovascular disease. Atherosclerosis. 2013;228:451–459. doi: 10.1016/j.atherosclerosis.2013.03.006. [DOI] [PubMed] [Google Scholar]
- 22.Schnabel RB, Schulz A, Wild PS, Sinning CR, Wilde S, Eleftheriadis M, et al. Noninvasive vascular function measurement in the community: cross-sectional relations and comparison of methods. Circ Cardiovasc Imaging. 2011;4:371–380. doi: 10.1161/CIRCIMAGING.110.961557. [DOI] [PubMed] [Google Scholar]
- 23.Purcell S, Neale B, Todd-Brown K, Thomas L, Ferreira MA, Bender D, et al. PLINK: a tool set for whole-genome association and population-based linkage analyses. Am J Hum Genet. 2007;81:559–575. doi: 10.1086/519795. [DOI] [PMC free article] [PubMed] [Google Scholar]
- 24.Willer CJ, Li Y, Abecasis GR. METAL: fast and efficient meta-analysis of genomewide association scans. Bioinformatics. 2010;26:2190–2191. doi: 10.1093/bioinformatics/btq340. [DOI] [PMC free article] [PubMed] [Google Scholar]
- 25.Johnson AD, Handsaker RE, Pulit SL, Nizzari MM, O’Donnell CJ, de Bakker PI. SNAP: a web-based tool for identification and annotation of proxy SNPs using HapMap. Bioinformatics. 2008;24:2938–2939. doi: 10.1093/bioinformatics/btn564. [DOI] [PMC free article] [PubMed] [Google Scholar]
- 26.Mitchell GF, Verwoert GC, Tarasov KV, Isaacs A, Smith AV, Yasmin, et al. Common genetic variation in the 3′-BCL11B gene desert is associated with carotid-femoral pulse wave velocity and excess cardiovascular disease risk: the AortaGen Consortium. Circ Cardiovasc Genet. 2012;5:81–90. doi: 10.1161/CIRCGENETICS.111.959817. [DOI] [PMC free article] [PubMed] [Google Scholar]
- 27.Verweij N, Mahmud H, Mateo Leach I, de Boer RA, Brouwers FP, Yu H, et al. Genome-wide association study on plasma levels of midregional-proadrenomedullin and C-terminal-pro-endothelin-1. Hypertension. 2013;61:602–608. doi: 10.1161/HYPERTENSIONAHA.111.203117. [DOI] [PubMed] [Google Scholar]
- 28.Glubb DM, McHugh PC, Deng X, Joyce PR, Kennedy MA. Association of a functional polymorphism in the adrenomedullin gene (ADM) with response to paroxetine. Pharmacogenomics J. 2010;10:126–133. doi: 10.1038/tpj.2009.33. [DOI] [PubMed] [Google Scholar]
- 29.Wallace C, Rotival M, Cooper JD, Rice CM, Yang JH, McNeill M, et al. Cardiogenics Consortium Statistical colocalization of monocyte gene expression and genetic risk variants for type 1 diabetes. Hum Mol Genet. 2012;21:2815–2824. doi: 10.1093/hmg/dds098. [DOI] [PMC free article] [PubMed] [Google Scholar]
- 30.Levy D, Hwang SJ, Kayalar A, Benjamin EJ, Vasan RS, Parise H, et al. Associations of plasma natriuretic peptide, adrenomedullin, and homocysteine levels with alterations in arterial stiffness: the Framingham Heart Study. Circulation. 2007;115:3079–3085. doi: 10.1161/CIRCULATIONAHA.106.652842. [DOI] [PubMed] [Google Scholar]
- 31.Salvi P, Magnani E, Valbusa F, Agnoletti D, Alecu C, Joly L, et al. Comparative study of methodologies for pulse wave velocity estimation. J Hum Hypertens. 2008;22:669–677. doi: 10.1038/jhh.2008.42. [DOI] [PubMed] [Google Scholar]
Associated Data
This section collects any data citations, data availability statements, or supplementary materials included in this article.