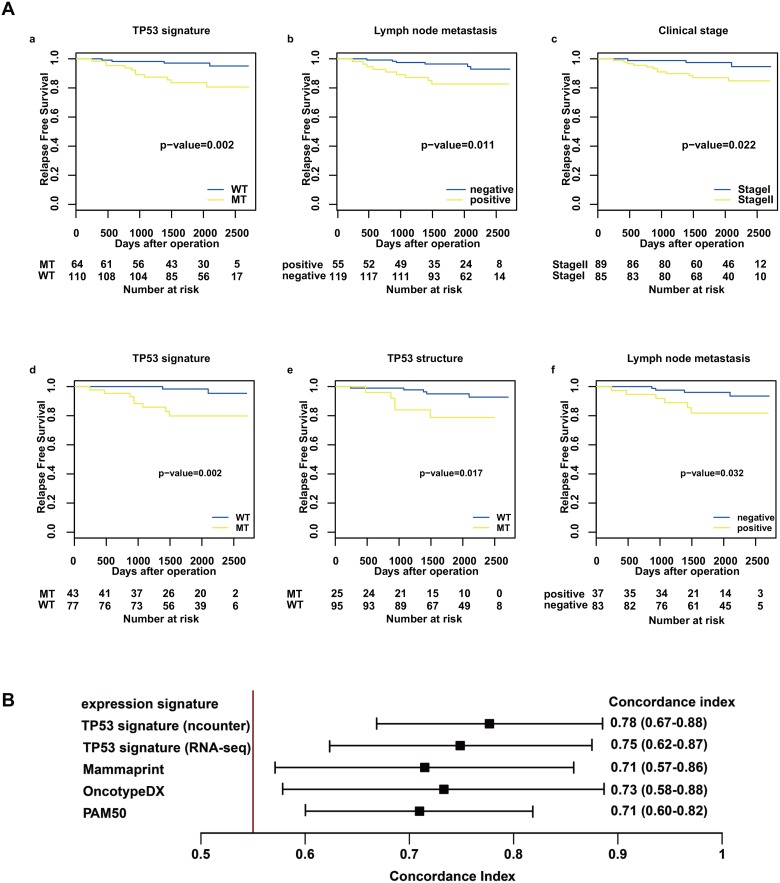
Figure 2. Relapse-free survival analysis in the nCounter validation cohort and concordance index for RFS and risk score.
(A) shows RFS after operation stratified by TP53 signature status (a, d), TP53 structural status (e), stage (c), and lymph node status (b, f) using the Kaplan–Meier method. The differences between the curves of the two subgroups were assessed using the log-rank test. The results from the nCounter validation cohort are shown in a, b, and c, and the results from the nCounter and RNA-seq cohort are shown in d, e, and f. (B) shows concordance index for RFS and risk score. Predictive performance for RFS was compared among risk scores of the following gene expression profiles: TP53 signature, OncotypeDX, Mammaprint, and PAM50. The risk score of TP53 signature was calculated using count data from both nCounter and RNA-seq.

