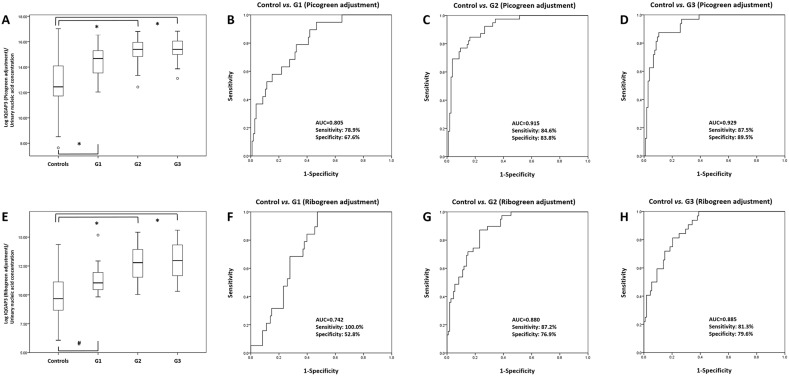
Figure 7. Receiver operating characteristics curve analysis of IQGAP3 urinary cell-free NA expression in bladder cancer patients and normal controls according to tumor grade.
IQGAP3 urinary cell-free NA levels in the BC patients with G1, G2, and G3 tumors were significantly higher than those in normal controls (PicoGreen-adjusted values) (A). The AUCs for IQGAP3 in G1, G2, and G3 tumors (compared with controls) were 0.805, 0.915, and 0.929, respectively (B-D). IQGAP3 urinary cell-free NA levels in the BC patients with G1, G2, and G3 tumors were also significantly higher than those in normal controls (RiboGreen-adjusted values) (E). The AUCs for IQGAP3 in G1, G2, and G3 tumors (compared with controls) were 0.742, 0.880, and 0.885, respectively (F-H). AUC, area under the curve. *: P<0.001, #: P=0.001

