Abstract
The present study aimed to compare the expression levels of excitatory amino acid transporters (EAATs) and growth status of piglets weaned at 10–20 days after birth with suckling piglets. A total of 40 hybrid piglets (Landrace × Large White × Duroc) born to 40 different sows, with similar body weight were selected for the present study. They were randomly divided into two groups (n=20 per group): Control group (suckling piglets) and experimental group (weaned piglets, reared in isolation). The experiment lasted for 10 days. At the end of the experiment, 12 piglets were randomly selected from each group and the jejunum and the ileum were collected in order to determine excitatory amino acid carrier 1 (EAAC1) expression levels and free amino acid content. The present study determined that early weaning significantly reduced EAAC1 gene and protein (57 and 73 kDa) expression levels and glutamate transporter associate protein 3–18 (GTRAP3-18; 50 kDa) in the jejunum and the ileum compared with the suckling group (P<0.05). Weaning led to an increased content of free glutamic acid (Glu) and total amino acids in the jejunum; however, content of free Glu and total amino acids in the ileum was significantly reduced (P<0.05). Early weaning reduced the expression of EAAC1 and GTRAP3-18, which was possibly due to the amino acid absorption and transport disorder in the small intestine due to the Glu deficiency.
Keywords: piglet, weaning, excitatory amino acid transporter 1, small intestine
Introduction
Glutamic acid (Glu) is an important source of energy in the mucosa and the conditionally essential amino acid in early weaned piglets (1). Glu has an important function in the growth and repair of intestinal mucosa. The absorption of Glu in the intestine requires specific transporters. Excitatory amino acid transporters (EAATs) are Na+-dependent high-affinity Glu transporters (2), that maintain the Glu balance of the nervous system. Excitatory amino acid carrier 1 (EAAC1) belongs to EAAT family and its transport rate is ~10 times of that of other transporters in the nervous system (3). EAAC1 is also expressed in other non-nervous tissues such as the small intestine. EAAC1 expression is negatively regulated by glutamate transporter associate protein 3–18 (GTRAP3-18). In various types of human cancer and epilepsy, GTRAP3-18 inhibits Glu transport via EAAC1 by binding to the C-terminal of EAAC1, leading to Glu poisoning in the nervous system (4). It is of note that, GTRAP3-18 may bind specifically to EAAC1 although not to other EAATs (5). EAAC1 expression is associated with the expression of GTRAP3-18. Previous studies have focused on EAAC1 in the nervous system as opposed to the intestine (6,7). A previous study determined that deletion of the EAAC1 gene may lead to the loss of age-dependent dopaminergic neurons and an increase in oxidative stress in mice (8). In patients with Alzheimer's disease, abnormal EAAC1 accumulation was located in the hippocampal neurons (9). Fu et al (10) cloned the jejunal EAAC1 protein in suckling piglets and investigated the dynamic changes of EAAC1 protein expression, which was low in the ileum of piglets with low birth weight (10). These previous findings imply that EAAC1 expression may be associated with abnormal development or the stress and disease status of the piglets. Low EAAC1 expression may reduce the transport rate of Glu and impair development and absorption function of the mucosa in piglets (10). Weaning induces stress piglet stress and the uptake of maternal Glu is interrupted. The present study aimed to investigate the changes of the expression levels of EAAC1 and its regulatory protein GTRAP3-18 in the jejunum and ileum of weaned piglets. The effect of weaning on EAAC1 expression was analyzed; therefore, providing insight into the underlying molecular mechanism of intestinal mucosa repair and potential measures that may be implemented in order to improve the growth performance of weaned piglets.
Materials and methods
Grouping and feeding management
The experiment was performed at Pig Breeding Demonstration Base (Qiqihar, China) in May 2010. A total of 40 hybrid piglets (Landrace × Large White × Duroc) born to 40 different sows, with similar body weight were selected. A single-factor experiment design was adopted. The piglets were randomly divided into two groups (n=20 per group): Control group (suckling piglets) and experimental group (weaned piglets, reared in isolation). The experiment continued for 10 days once the piglets were 10 days old.
The suckling piglets were reared by sows in the piglet house for the first 10 days of life. Following this, the weaned piglets were then reared in a nursery piglet house for a further 10 days. Weaned piglets were fed with corn-soybean meal-based starter diet for 10 days, 3 times daily (morning, noon and evening), and allowed free access to water. Each weaned piglet was fed in a separate cage and the quantity of food consumed by each weaned piglet (the feed-to-gain ratio) was calculated by weighing the amount of food originally provided and the amount of food leftover each morning. The weaned piglets were weighed on the first day they were fed separately (10 days old) and on the last day when the study was complete (20 days old). The composition and the nutrition of the basal diet are presented in Table I.
Table I.
Weaning diet of piglets used in the present study (dry basis).
| A, Contents | |
|---|---|
| Ingredient | Quantity (%) |
| Lactose | 15 |
| Glucose | 8.52 |
| Corn | 15.95 |
| Soybean | 56.00 |
| L-threonine | 0.00 |
| Corn oil | 0.8 |
| Limestone | 1.05 |
| CaHPO4 | 1.58 |
| Iodized salt | 0.5 |
| Vitamin-mineral premix | 0.5 |
| Lincomycin antibiotic | 0.1 |
| B, Nutrition | |
| Ingredient | Quantity |
| CP (%) | 26.0 |
| DE (MJ/kg) | 14.27 |
| P (%) | 0.92 |
| Ca (%) | 0.68 |
| Ca:P | 0.74 |
| Arginine (mg/kg) | 1.87 |
| Histidine (mg/kg) | 0.69 |
| Isoleucine (mg/kg) | 1.16 |
| Leucine (mg/kg) | 2.07 |
| Lysine (mg/kg) | 1.63 |
| Methionine (mg/kg) | 0.37 |
| Cysteine (mg/kg) | 0.42 |
| Phenylalanine (mg/kg) | 1.28 |
| Tyrosine (mg/kg) | 0.99 |
| Threonine (mg/kg) | 1.02 |
| Tryptophan (mg/kg) | 0.35 |
| Valine (mg/kg) | 1.22 |
The nursery piglet house provided a closed environment with good ventilation and cement flooring. Segregated early weaning (SEW) was adopted with 1 piglet per pen. An infrared heat lamp was hung 0.8 m above the ground at the corner of the pen. The ground directly under the lamp was paved with a 0.5×1 m heat-absorbing pad to ensure the warmth of the piglets. The present study was approved by the Ethics Committee of Northeast Agricultural University (Harbin, China) (approval no. SYXK (Hei) 2012–2067).
Sample collection and processing
On the morning of the 11th day, 12 piglets were randomly selected from each group (n=24). Piglets were sedated and maintained under anesthesia by inhalation of 8% anesthetic isoflurane via a facial mask. The abdominal cavity was opened to harvest the jejunum and ileum, which were washed with ice-cold normal saline. Samples were collected from the middle of the intestine and preserved in liquid nitrogen, as previously described (5). The samples were ground with liquid nitrogen to powder using a mortar and subsequently preserved at −80°C. At the end of tissue sampling, piglets were euthanized via an intra-cardiac injection of 50 mg/kg sodium pentobarbital (Schering-Plough Canada, Inc., Pointe-Claire, QC, Canada) (11).
Sample preparation
Cryopreserved homogenate small intestine sample weighing ~1.3 g was used and mixed with homogenate buffer (50 mM D-mannitol, 10 mM HEPES and 2.0 µg·ml-1 each of aprotinin, leupetin, pepstatin A, N-tosyl-L-phenylalanine chloromethyl-ketone, N-a-p-tosyl-L-lysine ketone and 0.20 mM PMSF, pH 7.4; all Sigma; Merck KGaA, Darmstadt, Germany) at the proportion of 1 g/20 ml. Subsequently, the sample was thawed in the homogenate buffer containing the protease inhibitor. The sample was homogenized using a multi-layer homogenizer at 1,523 × g for 3 min at 4°C (with a ~20 sec pause every min). The homogenate was weighed and the total volume was recorded with 2 ml cryopreserved at −80°C. The endoplasm sample was prepared by Mg2+ precipitation and differential centrifugation at 4°C as previously described (5). The remaining endoplasm sample was used for further differential centrifugation to obtain the apical membrane of the cells. Briefly, the remaining supernatant was mixed with 1 M MgCl2 to produce 10 mM MgCl2, stirred on ice for 15 min and then centrifuged at 4°C and 2,400 × g for 15 min. After discarding the top foam layer, the resultant supernatant was centrifuged at 4°C and 19,000 × g for 30 min using the Ti 55.2 rotor on a Beckman L8-55 Ultracentrifuge to generate crude apical membrane pellets. The supernatant obtained was regarded as the cytosolic fraction and sampled for protein content analyses as well as western blotting analyses of the abundance of target proteins. The crude apical membrane pellets were then suspended in 15 ml of membrane suspension buffer (300 mM D-mannitol, 25 mM HEPES and 2.0 µg·ml-1 each of aprotinin, leupetin, pepstatin A, N-tosyl-L-phenylalanine chloromethyl-ketone, N-α-p-tosyl-L-lysine ketone and 0.20 mM PMSF, pH 7.4) and centrifuged at 4°C and 39,000 × g for 30 min to generate the final apical membrane vesicle pellets. The final pellets were re-suspended with a 25-gauge needle in 5 ml of the same membrane suspension buffer to yield the apical membrane fraction samples for protein content and western blotting analyses.
Detection of EAATs expression levels
The protein concentration assay was performed with PMSF buffer (Sigma; Merck KGaA) as previously described (6). Protein in the homogenate, endoplasm and apical membrane of the cells was quantified using a Bradford assay dye reagent (Bio-Rad Laboratories, Inc., Hercules, CA, USA) and proteins in fetal bovine serum (grade IV) as the standard. A total of 20 µg protein/lane was loaded and separated on a 10% SDS-PAGE gel.
Western blotting
Western blotting was performed using 1 µg/µl protein sample and β-actin as the internal control. Proteins were transferred to PVDF membranes, which were blocked at room temperature for 1 h with 6% non-fat dry milk powder dissolved in 1X TBS (25 mM Tris-HCl, 0.15 M NaCl, pH 7.4) and then incubated at 4°C with primary antibodies overnight. The primary antibody for EAAC1 was goat anti-human EAAC1 polyclonal antibody (cat. no. sc-7761; Santa Cruz Biotechnology, Inc., Dallas, TX, USA) diluted to 1:2,000, the primary antibody for GTRAP3-18 was mouse anti-human GTRAP3-18 polygonal antibody (cat. no. H00010550-A01; Abnova, Atlanta, GA, USA) diluted to 1:2,000; primary antibody to β-actin was mouse anti-human monoclonal antibody (cat. no. VMA00014; Bio-Rad Laboratories, Inc.) diluted to 1:10,000. The membranes were then incubated at room temperature for 1 h with the purified secondary antibody rabbit anti-human IgG (cat. no. STAR195; Bio-Rad Laboratories, Inc.) diluted to 1:10,000.
Detection of gene expression
The primers for the target genes and the housekeeping gene were designed using Primer Premier version 5.0 software (Premier Biosoft International, Palo Alto, CA, USA) based on GenBank cDNA sequences (Table II). The primers were synthesized by Invitrogen; Thermo Fisher Scientific, Inc. (Waltham, MA, USA). To avoid contamination of the primers by non-specific genomic DNA, mRNA sequences from all samples were aligned against the pig genome using Spidey v0.7 software (now Splign software; https://www.ncbi.nlm.nih.gov/sutils/splign/splign.cgi). Each primer contained 2 exons. Total RNA was extracted from the samples using TRIzol (Invitrogen; Thermo Fisher Scientific, Inc.) as previously described (6). Following digestion with DNA enzyme (Invitrogen; Thermo Fisher Scientific, Inc.), cDNA synthesis was performed using iScript cDNA synthesis kit (Bio-Rad, Laboratories, Inc.) according to the manufacturer's protocol. Quantitative polymerase chain reaction (qPCR) was performed using iQ SYBR-Green supermix (Qiagen, Inc., Valencia, CA, USA) with total reaction volume of 25 µl. The procedures of reverse transcription (RT)-qPCR were as follows: RT at 50°C for 30 min, denaturation at 95°C for 15 min, amplification and quantification for 45 cycles, denaturation at 95°C for 15 sec, annealing at 54°C for 15 sec, extension at 72°C for 15 sec; plotting of dissociation curve, 60–99°C, temperature rise at 0.1°C/sec, with fluorescence detection. The relative expression ratio of target gene to the housekeeping gene was calculated as follows:
Table II.
Primer sequences and product size.
| Gene | Forward (5′→3′) | Reverse (5′→3′) | Size (bp) | GenBank no. |
|---|---|---|---|---|
| EAAC1 | CAAACTGGGCCTTTACATGG | TGTTGCTGAACTGGAGGAGA | 169 | AY195622 |
| GTRAP3-18 | CTGGTATTCACGGGCTTTGT | CCCCCAAACATGGATATGAG | 131 | NM_001048073 |
| β-actin | GGATGCAGAAGGAGATCACG | ATCTGCTGGAAGGTGGACAG | 150 | AY550069 |
EAAC1, excitatory amino acid carrier 1; GTRAP3-18, glutamate transporter associate protein 3–18.
R=2-Cq (target gene-housekeeping gene) (12)
where R is relative expression ratio of the target gene; Cq is the quantification cycle value. Under this threshold cycle value, the target gene and the β-actin housekeeping gene were amplified by over 30 fluorescence units. The optimal RT-qPCR efficiency was obtained from the formula of −1+10 (−1/slope) with serial dilution of RNA. The efficiency was consistent for the target gene and β-actin. Experiments were repeated three times with three duplicates of each.
Quantification of free amino acids in the small intestine of piglets
High-performance liquid chromatography (HPLC) was performed as previously described (13). Briefly, HPLC was performed using the LC-9A liquid chromatograph system (Shimadzu Corporation, Kyoto, Japan). The analytical column Inertsil ODS-2 (150×4.6 mm ID 5lm; GL Sciences, Inc., Tokyo, Japan) was fixed at 40°C and connected through a corresponding guard column (10×4.0 mm ID 5 lm; GL Sciences, Inc.) with a HPLC workstation; the flow rate of the eluate was 1.0 ml/min. All samples were injected into the column with an Auto Injector (Shimadzu Corporation). An RF-530 fluorescence spectromonitor (Shimadzu Corporation) was used with excitation and emission set at 380 and 510 nm, respectively. The signals from the detector were recorded on a Chromatopac C-R4A (Shimadzu Corporation). O-phthalaldehyde was used as an internal standard.
Statistical analysis
The protein expression levels were expressed relative to the expression levels of the EAAC1 and GTRAP3-18 genes. The protein blots were scanned and analyzed using Quantity One software v19.0 (Bio-Rad Laboratories, Inc.). The optical density was calculated. The relative expression of the target protein was characterized as the optical density ratio of the target gene to β-actin. One-way analysis of variance was performed using SAS version 9.2 (SAS Institute, Inc., Cary, NC, USA). Data were expressed as the mean ± standard deviation. P<0.05 was considered to indicate a statistically significant difference. The findings of the present study were plotted as histograms and curves using The Scientific Fig. Processor software (Fig. P Software Incorporated, Hamilton, ON, Canada).
Results
Effect of weaning on growth performance
Weaned piglets were fed 148.50±16.90 g/day (n=20) with feed-to-gain ratio of 3.58±2.34 during the experiment. The weaned piglets showed had significantly reduced body weight at the end of the experiment, compared with the suckling piglets (P<0.05) and the daily weight gain of the weaned piglets was also significantly lower (P<0.001; Table III). Therefore, early weaning had a negative impact on the growth performance of piglets.
Table III.
Effect of weaning on growth performance of piglets.
| Characteristic | Suckling | Weaning | SEM |
|---|---|---|---|
| Initial body weight (kg) | 4.18 | 4.77 | 0.16 |
| Terminal body weight (kg) | 7.68 | 5.19a | 0.24 |
| Average daily gain (g/day) | 350 | 41.50b | 24.49 |
| Average daily food intake (g/day) | – | 148.50 | 16.90 |
| ADFI/ADG (g/g) | – | 3.58 | 2.34 |
Data are presented as mean ± SEM, n=20.
P<0.05
P<0.01 vs. the suckling group. SEM, standard error of the mean.
Effect of weaning on EAAC1 protein expression
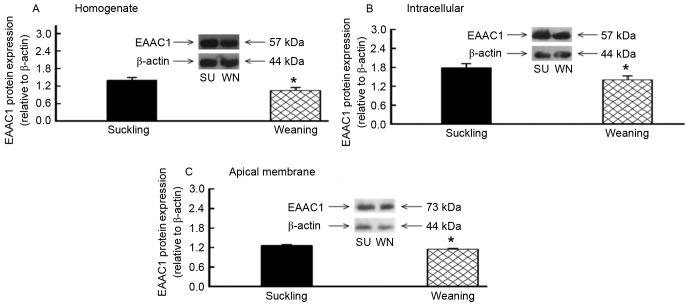
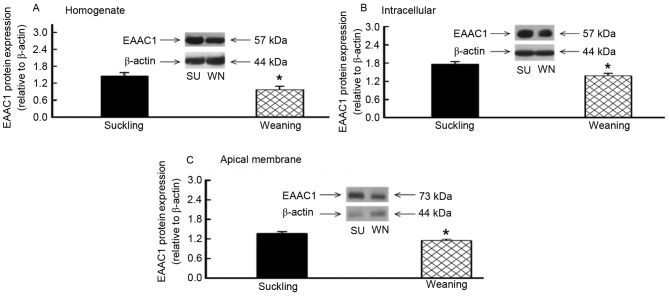
EAAC1 protein content was detected in the homogenate, endoplasm and apical membrane of the small intestine using western blotting. The molecular weight of the EAAC1 was 57 kDa in the homogenate and endoplasm and 73 kDa in the apical membrane of the cells. With β-actin as the internal control, the EAAC1 protein expression in the homogenate, endoplasm and apical membrane of the jejunum was significantly reduced, by 25, 21 and 9%, respectively (P<0.05; Fig. 1). The EAAC1 protein expression in the homogenate, endoplasm and apical membrane of the ileum was also significantly reduced, by 32, 22 and 14%, respectively (P<0.05; Fig. 2). Therefore, EAAC1 protein was expressed in the small intestine of piglets, and its expression levels were reduced following early weaning.
Figure 1.
EAAC1 protein expression levels in the (A) homogenate (B) intracellular and (C) apical membrane of jejunum in piglets. *P<0.05 vs. suckling. SU, suckling; WN, weaning; EAAC1, excitatory amino acid carrier 1.
Figure 2.
EAAC1 protein expression levels in the (A) homogenate (B) intracellular and (C) apical membrane of ileum in piglets. *P<0.05 vs. suckling. SU, suckling; WN, weaning; EAAC1, excitatory amino acid carrier 1.
Effect of early weaning on EAAC1 mRNA expression
EAAC1 mRNA expression was compared between the suckling piglets and the weaned piglets, as presented in Table IV. β-actin was used as an internal reference, the EAAC1 mRNA expression in the jejunum of the weaned piglets decreased by 88% as compared with the suckling piglets (P<0.05); the EAAC1 mRNA expression in the ileum of the weaned piglets decreased by 73% (P<0.05).
Table IV.
Intestinal excitatory amino acid carrier 1 mRNA levels (relative to β-actin) in piglets.
Data are presented as mean ± SEM, n=12.
P<0.05 vs. the suckling group. SEM, standard error of the mean.
Correlations of EAAC1 protein and mRNA expression levels in different parts of the small intestine
Pearson's correlation was used to determine that the EAAC1 protein and mRNA expression levels in the homogenate (r=0.52; P=0.042; n=24), endoplasm (r=0.56; P=0.021; n=24) and apical membrane of cells (r=0.49; P=0.008; n=24) in the jejunum were positively correlated for weaned and suckling piglets. Additionally, the EAAC1 protein expression in the homogenate of the jejunum was positively correlated with the endoplasm of the jejunum. The EAAC1 protein expression in the endoplasm of the jejunum was positively correlated with that in the apical membrane of the cells for weaned and suckling piglets. The EAAC1 mRNA and protein expression levels in the homogenate (r=0.51; P=0.021; n=24), endoplasm (r=0.51; P=0.016; n=24) and apical membrane of cells (r=0.41; P=0.016; n=24) in the ileum were positively correlated for weaned and suckling piglets. EAAC1 protein expression in the homogenate of ileum was positively correlated with that in the endoplasm of the ileum. The EAAC1 protein expression in the endoplasm of ileum was positively correlated with that in the apical membrane of the cells (P<0.05) for weaned and suckling piglets.
Effect of early weaning on GTRAP3-18 protein expression
The molecular weight of GTRAP3-18 in the homogenate, endoplasm and apical membrane of cells in the jejunum and ileum was 50 kDa, as presented in Figs. 3 and 4. β-actin was used as an internal reference and the GTRAP3-18 protein expression in the homogenate, endoplasm and apical membrane of the jejunum of the weaned piglets was reduced by 15, 28 and 55% when compared with the suckling piglets (P<0.05; Fig. 3). The GTRAP3-18 protein expression in the homogenate, endoplasm and apical membrane of the ileum was also significantly reduced by 16, 7 and 27%, respectively (P<0.05; Fig. 4).
Figure 3.
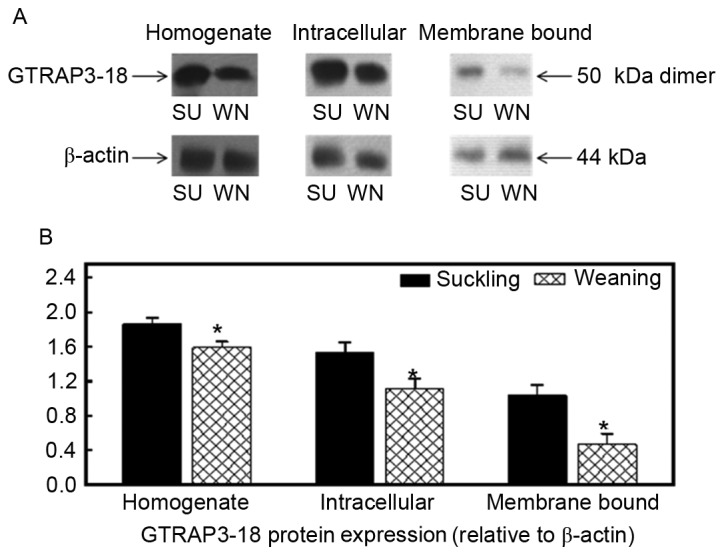
GTRAP3-18 protein expression in the jejunum of piglets was determined using (A) western blotting. (B) Quantification of western blotting. *P<0.05 vs. suckling. SU, suckling; WN, weaning; GTRAP3-18, glutamate transporter associate protein 3–18.
Figure 4.
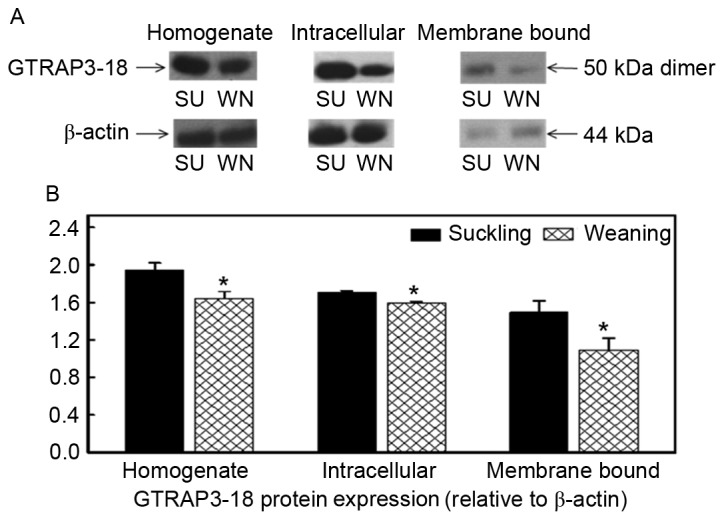
GTRAP3-18 protein expression in the ileum of piglets. was determined using (A) western blotting. (B) Quantification of western blotting. *P<0.05 vs. suckling. SU, suckling; WN, weaning; GTRAP3-18, glutamate transporter associate protein 3–18.
Effect of early weaning on GTRAP3-18 mRNA expression
The GTRAP3-18 mRNA expression levels in the small intestine of the weaned piglets and suckling piglets are presented in Table V. With β-actin as internal reference, the GTRAP3-18 mRNA expression in the jejunum of the weaned piglets was reduced by 70% compared with the suckling piglets (P<0.05) and expression in the ileum of the weaned piglets was reduced by 52% (P<0.05).
Table V.
Intestinal glutamate transporter associate protein 3–18 mRNA levels (relative to β-actin) in piglets.
Data are presented as mean ± SEM, n=12.
P<0.05 vs. the suckling group. SEM, standard error of the mean.
Correlations of GTRAP3-18 expression levels in different parts of the small intestine
Pearson's correlation revealed that the GTRAP3-18 protein and mRNA expression levels in the homogenate (r=0.33; P=0.027; n=24), endoplasm (r=0.54; P=0.019; n=24) and apical membrane of cells (r=0.56; P=0.028; n=24) in the jejunum were positively linearly correlated for weaned and suckling piglets. Additionally, the GTRAP3-18 protein expression in the homogenate of the jejunum was positively correlated with that in the endoplasm and apical membrane of the jejunum. The GTRAP3-18 protein expression in the endoplasm of the jejunum was positively correlated with that in the apical membrane of the cells (P<0.05) for weaned and suckling piglets. The GTRAP3-18 protein and mRNA expression in the homogenate (r=0.42; P=0.014; n=24), endoplasm (r=0.42; P=0.047; n=24) and apical membrane of cells (r=0.15; P=0.029; n=24) in the ileum were positively linearly correlated (P<0.05) for weaned and suckling piglets. GTRAP3-18 protein expression in the homogenate of ileum was positively correlated with that in the endoplasm and apical membrane of the ileum. The GTRAP3-18 protein expression in the endoplasm of ileum was positively linearly correlated with that in the apical membrane of the cells (P<0.05) for the weaned and suckling piglets.
Effect of early weaning on free amino acid content in the jejunum
Compared with the suckling piglets, The Glu content in the jejunum was significantly greater in the weaned piglets compared with the suckling piglets (by 26%; P<0.05; Fig. 5). However, no significant difference was identified between the content of glutamine (Gln), the substrate for the ASC amino-acid transporter 2 (ASCT2) protein in the weaned and suckling piglets. The contents of other free amino acids, including threonine, glycine and ornithine, increased by 57, 88 and 53%, respectively (P<0.05; Fig. 5).
Figure 5.
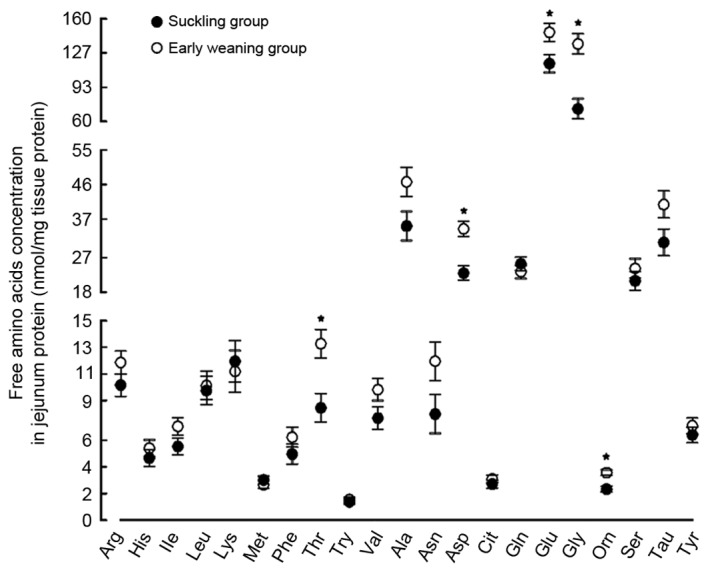
Effect of weaning on free amino acid content in the jejunum of piglets. *P<0.05 vs. suckling.
Effect of early weaning on free amino acid content in the ileum
The changes of the free amino acid content in the ileum of the weaned piglets and the suckling piglets were opposite to those observed in the jejunum. The Glu content, the substrate for the EAAC1 protein, were reduced by 43% in the weaned piglets (P<0.05). However, the content of Gln, the substrate for the ASCT2 protein, was reduced by 52% in the weaned piglets (P<0.05). The contents of the remaining free amino acids, including lysine, methionine, phenylalanine, trypophan, arginine, taurine and tyrosine, were all reduced by >42% (P<0.05; Fig. 6).
Figure 6.
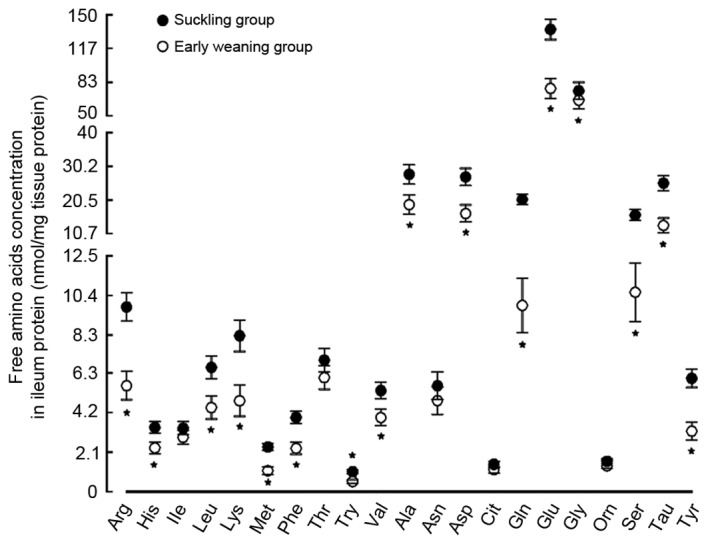
Effect of weaning on free amino acid content in the ileum of piglets. *P<0.05 vs. suckling.
Discussion
Weaning may induce a series of changes in the morphology of piglets, including nutritional level, digestion and metabolism (14), stress, neuroendocrine (15) and gene functions. Daily weight gain following weaning is an important apparent indicator of the piglet's growth. If the daily weight gain does not change considerably after weaning as compared with the suckling piglets, this means that the daily diet had sufficient nutrients for the piglets and they have adapted to weaning with normal intestinal development. However, in practice, ~10% of the weaned piglets die from physiological stress of two major sources, the change of the external environment and abnormal intestinal mucosa development due to a novel feeding diet. Weaning may induce changes of gastrointestinal functions and affects the regulation of gut-brain axis (16). The quantity of feed consumed by the piglets frequently decreases following weaning due to changes in nutrition and environment. The gastrointestinal tract is underdeveloped in piglets and weaning may lead to a decline in their growth performance. In the present study, the piglets in SEW treatment group exhibited signs of weaning-associated stress. The daily feeding quantity was 148.5 g, which was lower compared with the standard of 240 g/day in the requirements of swine from the National Research Council (NRC). Additionally, the daily weight gain of the weaned piglets was significantly lower compared with the suckling piglets of the same age (P<0.001). Gu et al (17) determined that weaning-associated stress may lead to significant structural and functional changes of the intestine, thus affecting the normal growth of piglets.
EAAC1 is a crucial Glu transporter with wide distribution in the entire cell body. A previous study (6) focused on Glu transport by EAAC1 in the central nervous system as opposed to the intestinal mucosa of piglets. The present study detected the EAAC1 protein and mRNA expression levels were significantly reduced in the intestine of weaned piglets compared with the suckling piglets. Watabe et al (18) revealed that GTRAP3-18 was a negative regulator of EAAC1 and intracellular glutathione content using HEK293 cells (18). Additionally, GTRAP3-18 had a sequential impact on the susceptibility to oxidative stress. Differentiation, heat stress and oxidative stress may also lead to the separation of GTRAP3-18 protein (6). This involves the upregulation of GTRAP3-18 protein or mRNA expression in response to oxidative stress. The present study determined that early weaning reduced the protein and mRNA expression of GTRAP3-18 in piglets, which was contrary to the response to heat and oxidative stress. In order to manage the increased stress, the piglets require more Glu from their daily diet for intestinal mucosa repair. The findings of a previous study revealed that the increased efficiency of Glu uptake may led to the downregulation of GTRAP3-18 protein expression levels (18). Increased Glu content in the jejunum led to reduced GTRAP3-18 protein expression in the jejunum, which was in accordance with previous findings by Lin et al (19). However, the Glu content and GTRAP3-18 expression in the ileum was reduced in weaned piglets. The function of GTRAP3-18 in stress and disease of piglets remains to be fully elucidated (5).
Glu is the excitatory amino acid transported by EAAC1. The present study determined that weaning led to a reduction in the content of free amino acids in the ileum and an increase of free amino acids in the jejunum of the weaned piglets. Previous studies revealed that EAAC1 was primarily expressed in the jejunum (20) and the efficiency of Glu transmembrane transport in the intestine was regulated by EAAC1 (21). Therefore, it is possible that the Glu transport efficiency was increased in the jejunum of weaned piglets in order to compensate for the reduced Glu uptake. In the meantime, EAAC1 was consumed and the EAAC1 expression was reduced. Conversely, the EAAC1 expression in the ileum was reduced, leading to lower Glu transport efficiency. The content of free Glu in the ileum was reduced in the weaned piglets compared with the suckling piglets. It is of note that the Glu content is not solely determined by transport, but also by the Glu-Gln cycle.
In conclusion, the present study determined that EAAC1 expression was reduced in the jejunum of the weaned piglets and the consumed EAAC1 was associated with the increased transport of Glu in the jejunum of the weaned piglets. Therefore, the content of amino acids such as Glu was increased in the jejunum. This was accompanied by the reduced expression of GTRAP3-18, the regulator of EAAC1. As EAAC1 expression was downregulated in the ileum of the weaned piglets, the Glu transport rate was reduced, leading to reduction of amino acid content, such as Glu in the ileum.
Acknowledgements
The present study was supported by the China Postdoctoral Science Foundation (grant no. 2013M531011) and the Heilongjiang Province Natural Science Foundation of China (grant nos. C201444 and C2015040).
References
- 1.Ruth MR, Field CJ. The immune modifying effects of amino acids on gut-associated lymphoid tissue. J Anim Sci Biotechnol. 2013;4:27. doi: 10.1186/2049-1891-4-27. [DOI] [PMC free article] [PubMed] [Google Scholar]
- 2.Bianchi MG, Bardelli D, Chiu M, Bussolati O. Changes in the expression of the glutamate transporter EAAT3/EAAC1 in health and disease. Cell Mol Life Sci. 2014;71:2001–2015. doi: 10.1007/s00018-013-1484-0. [DOI] [PMC free article] [PubMed] [Google Scholar]
- 3.Aoyama K, Nakaki T. Neuroprotective properties of the excitatory amino acid carrier 1 (EAAC1) Amino Acids. 2013;45:133–142. doi: 10.1007/s00726-013-1481-5. [DOI] [PubMed] [Google Scholar]
- 4.Butchbach ME, Lai L, Lin CL. Molecular cloning, gene structure, expression profile and functional characterization of the mouse glutamate transporter (EAAT3) interacting protein GTRAP3-18. Gene. 2002;292:81–90. doi: 10.1016/S0378-1119(02)00669-8. [DOI] [PubMed] [Google Scholar]
- 5.Aoyama K, Nakaki T. Inhibition of GTRAP3-18 may increase neuroprotective glutathione (GSH) synthesis. Int J Mol Sci. 2012;13:12017–12035. doi: 10.3390/ijms130912017. [DOI] [PMC free article] [PubMed] [Google Scholar]
- 6.Jang BG, Won SJ, Kim JH, Choi BY, Lee MW, Sohn M, Song HK, Suh SW. EAAC1 gene deletion alters zinc homeostasis and enhances cortical neuronal injury after transient cerebral ischemia in mice. J Trace Elem Med Biol. 2012;26:85–88. doi: 10.1016/j.jtemb.2012.04.010. [DOI] [PubMed] [Google Scholar]
- 7.Aoyama K, Watabe M, Nakaki T. Modulation of neuronal glutathione synthesis by EAAC1 and its interacting protein GTRAP3-18. Amino Acids. 2012;42:163–169. doi: 10.1007/s00726-011-0861-y. [DOI] [PubMed] [Google Scholar]
- 8.Berman AE, Chan WY, Brennan AM, Reyes RC, Adler BL, Suh SW, Kauppinen TM, Edling Y, Swanson RA. N-acetylcysteine prevents loss of dopaminergic neurons in the EAAC1-/-mouse. Ann Neurol. 2011;69:509–520. doi: 10.1002/ana.22162. [DOI] [PMC free article] [PubMed] [Google Scholar]
- 9.Duerson K, Woltjer RL, Mookherjee P, Leverenz JB, Montine TJ, Bird TD, Pow DV, Rauen T, Cook DG. Detergent-insoluble EAAC1/EAAT3 aberrantly accumulates in hippocampal neurons of Alzheimer's disease patients. Brain Pathol. 2009;19:267–278. doi: 10.1111/j.1750-3639.2008.00186.x. [DOI] [PMC free article] [PubMed] [Google Scholar]
- 10.Fu D, Yang H, Kong X, Blachier F, Wang W, Yin Y. Molecular cloning and expression profiling of excitatory amino acid carrier 1 in suckling Huanjiang mini-piglets with large or small body weight at birth. Mol Biol Rep. 2013;40:3341–3350. doi: 10.1007/s11033-012-2409-y. [DOI] [PubMed] [Google Scholar]
- 11.Bregendahl K, Yang X, Liu L, Yen JT, Rideout TC, Shen Y, Werchola G, Fan MZ. Fractional 485 protein synthesis rates are similar when measured by intraperitoneal or intravenous flooding 486 doses of L-[ring-2H5]phenylalanine in combination with a rapid regimen of sampling in piglets. J Nutr. 2008;138:1976–1981. doi: 10.1093/jn/138.10.1976. [DOI] [PubMed] [Google Scholar]
- 12.Livak KJ, Schmittgen TD. Analysis of relative gene expression data using real-time quantitative PCR and the 2(-Delta Delta C(T)) method. Methods. 2001;25:402–408. doi: 10.1006/meth.2001.1262. [DOI] [PubMed] [Google Scholar]
- 13.Thiele B, Stein N, Oldiges M, Hofmann D. Direct analysis of underivatized amino acids in plant extracts by LC-MS-MS. Methods Mol Biol. 2012;828:317–328. doi: 10.1007/978-1-61779-445-2_25. [DOI] [PubMed] [Google Scholar]
- 14.Takita M, Kikusui T. Early weaning influences short-term synaptic plasticity in the medial prefrontal-anterior basolateral amygdala pathway. Neurosci Res. 2006;103:48–53. doi: 10.1016/j.neures.2015.08.003. [DOI] [PubMed] [Google Scholar]
- 15.Xiong X, Yang H, Tan B, Yang C, Wu M, Liu G, Kim SW, Li T, Li L, Wang J, et al. Differential expression of proteins involved in energy production along the crypt-villus axis in early-weaning pig small intestine. Am J Physiol Gastrointest Liver Physiol. 2015;309:G229–G237. doi: 10.1152/ajpgi.00095.2015. [DOI] [PubMed] [Google Scholar]
- 16.Candeias EM, Sebastião IC, Cardoso SM, Correia SC, Carvalho CI, Plácido AI, Santos MS, Oliveira CR, Moreira PI, Duarte AI. Gut-brain connection: The neuroprotective effects of the anti-diabetic drug liraglutide. World J Diabetes. 2015;6:807–827. doi: 10.4239/wjd.v6.i6.807. [DOI] [PMC free article] [PubMed] [Google Scholar]
- 17.Gu X, Li D, She R. Effect of weaning on small intestinal structure and function in the piglet. Arch Tierernahr. 2002;56:275–286. doi: 10.1080/00039420214345. [DOI] [PubMed] [Google Scholar]
- 18.Watabe M, Aoyama K, Nakaki T. A dominant role of GTRAP3-18 in neuronal glutathione synthesis. J Neurosci. 2008;28:9404–9413. doi: 10.1523/JNEUROSCI.3351-08.2008. [DOI] [PMC free article] [PubMed] [Google Scholar]
- 19.Lin CI, Orlov I, Ruggiero AM, Dykes-Hoberg M, Lee A, Jackson M, Rothstein JD. Modulation of the neuronal glutamate transporter EAAC1 by the interacting protein GTRAP3-18. Nature. 2001;410:84–88. doi: 10.1038/35065084. [DOI] [PubMed] [Google Scholar]
- 20.Burrin DG, Stoll B. Metabolic fate and function of dietary glutamate in the gut. Am J Clin Nutr. 2009;90:850S–856S. doi: 10.3945/ajcn.2009.27462Y. [DOI] [PubMed] [Google Scholar]
- 21.Fan MZ, Matthews JC, Etienne NM, Stoll B, Lackeyram D, Burrin DG. Expression of apical membrane L-glutamate transporters in neonatal porcine epithelial cells along the small intestinal crypt-villus axis. Am J Physiol Gastrointest Liver Physiol. 2004;287:G385–G398. doi: 10.1152/ajpgi.00232.2003. [DOI] [PubMed] [Google Scholar]


