Death rates are widely used as a convenient way of summarising important aspects of health in a population. However, they are not always easy to interpret, and even when techniques such as standardisation are used the impact of premature death may be difficult to assess. Cohort analysis provides summary information that takes account of age at death and that can be displayed graphically in a readily understood format. First used in 1870 by the statistician William Farr, this straightforward technique deserves wider use.1
It is widely accepted that deprivation increases the risk of early death. However, the age at which death from specific causes occurs and the relative contributions of these causes to mortality are rarely described clearly.2 We used data on survival in a cohort of middle aged people, divided into groups according to deprivation, to examine the relation between age, deprivation, and causes of death in a straightforward and graphical way.
Methods and results
From census projections the General Register Office for Scotland provided information on the number of people who were born in 1920 and who survived to the end of 1974. For each year from 1975 to the end of 1997 we looked at all registered deaths by specific cause and used postcodes of residence at time of death to assign Carstairs deprivation scores to each person.3 We grouped the scores into five standard groups on the basis of the distribution of deprivation scores in the total population. A disease specific survival chart was then built up for each of the deprivation groups, on the basis of two assumptions: firstly, that the census projections of people in the total population who were born in 1920 and who survived to the end of 1974 can be assumed to be equally distributed among the five deprivation groups; and secondly, that a person's Carstairs score at death represents their deprivation during the last years of their life. (Scottish studies indicate that level of deprivation changes little among people of this age group.4)
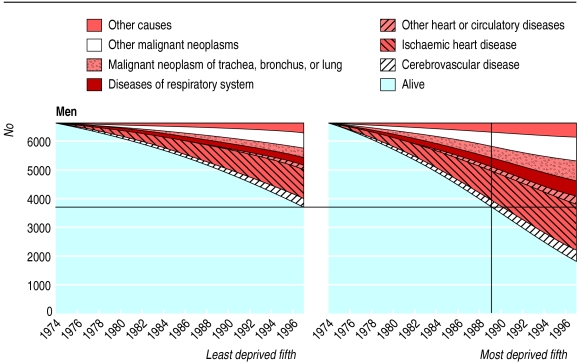
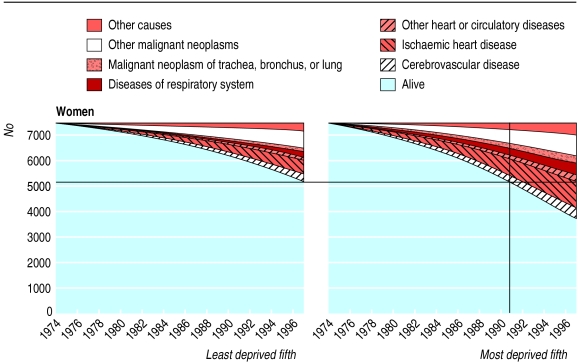
The number of people born in 1920 who were still alive at the end of 1974 was 70 365 (33 208 men (47%), 37 157 women). Over the next 23 years about half of these people died (19 912 men (28% of the original total) and 15 202 women (22%)). Deprivation had a strong effect on mortality: 44% of men in the least deprived fifth had died by the end of 1997, compared with 72% of men in the most deprived fifth (fig 1); in women the corresponding figures were 30% and 50% (fig 2). Men in the most deprived fifth reached an equivalent mortality seven years on average earlier than men in the least deprived fifth, and the equivalent difference in women was six years.
Figure 1.
Survival from 1974 to end of 1997 of men born in 1920 and who were alive at end of 1974 (cumulative outcome in terms of cause of death)
Figure 2.
Survival from 1974 to end of 1997 of women born in 1920 and who were alive at end of 1974 (cumulative outcome in terms of cause of death)
Comment
Cohort survival graphs are a good way to show that deprived people die from the same conditions as affluent people but some years earlier overall. The risk of premature death in middle age is much greater in the most deprived fifth than in the least deprived. The proportion of deaths from conditions related to smoking, such as lung cancer and respiratory disease, is slightly greater in the most deprived fifth. In women the proportion of deaths from malignant neoplasms is greater in the least deprived fifth than in the most deprived. The graphs clearly show that no specific diseases are related to deprivation; rather, it is as though deprived people have the same mortality pattern as affluent people who are seven years older. The car analogy of Graham Watt, professor of general practice at the University of Glasgow, is helpful: “More miles on the clock” (G Watt, personal communication, 1999).
The composition of the cohort changed markedly from 1974 to 1997, with a much greater proportion of survivors in 1997 being in the least deprived fifth than in the most deprived (27% and 14%, respectively, of men and 23% and 17% of women).
These effects of deprivation on premature death may not be obvious in tables or histograms.2Our cohort survival graphs, which can be constructed without complex links between records, clearly show the relation between deprivation and mortality.
Acknowledgments
We thank the General Register Office for providingthe mortality and population data and David Murphy of the Information and Statistics Division for his help in the initial analyses.
Footnotes
Editorial by Krishnan et al
Competing interests: None declared.
References
- 1.Langmuir AD. William Farr: founder of modern concepts of surveillance. Int J Epidemiol. 1976;5:13–18. doi: 10.1093/ije/5.1.13. [DOI] [PubMed] [Google Scholar]
- 2.Loevinsohn BP. Data utilization and analytical skills among mid-level health programme managers in a developing country. Int J Epidemiol. 1994;23:194–200. doi: 10.1093/ije/23.1.194. [DOI] [PubMed] [Google Scholar]
- 3.Carstairs V, Morris R. Deprivation and health in Scotland. Aberdeen: Aberdeen University Press; 1991. [Google Scholar]
- 4.Hart CL, Smith GD, Blane D. Social mobility and 21 year mortality in a cohort of Scottish men. Soc Sci Med. 1998;47:1121–1130. doi: 10.1016/s0277-9536(98)00061-6. [DOI] [PubMed] [Google Scholar]


