

Abstract
Introduction
The Alzheimer’s Disease Research Summits of 2012 and 2015 incorporated experts from academia, industry, and nonprofit organizations to develop new research directions to transform our understanding of Alzheimer’s disease (AD) and propel the development of critically needed therapies. In response to their recommendations, big data at multiple levels are being generated and integrated to study network failures in disease. We used metabolomics as a global biochemical approach to identify peripheral metabolic changes in AD patients and correlate them to cerebrospinal fluid pathology markers, imaging features, and cognitive performance.
Methods
Fasting serum samples from the Alzheimer’s Disease Neuroimaging Initiative (199 control, 356 mild cognitive impairment, and 175 AD participants) were analyzed using the AbsoluteIDQ-p180 kit. Performance was validated in blinded replicates, and values were medication adjusted.
Results
Multivariable-adjusted analyses showed that sphingomyelins and ether-containing phosphatidylcholines were altered in preclinical biomarker-defined AD stages, whereas acylcarnitines and several amines, including the branched-chain amino acid valine and α-aminoadipic acid, changed in symptomatic stages. Several of the analytes showed consistent associations in the Rotterdam, Erasmus Rucphen Family, and Indiana Memory and Aging Studies. Partial correlation networks constructed for Aβ1–42, tau, imaging, and cognitive changes provided initial biochemical insights for disease-related processes. Coexpression networks interconnected key metabolic effectors of disease.
Discussion
Metabolomics identified key disease-related metabolic changes and disease-progression-related changes. Defining metabolic changes during AD disease trajectory and its relationship to clinical phenotypes provides a powerful roadmap for drug and biomarker discovery.
Keywords: Metabolomics, Metabonomics, Pharmacometabolomics, Pharmacometabonomics, Biomarkers, Serum, Metabolism, Systems biology, Biochemical networks, Precision medicine, Alzheimer’s disease, Dementia, Branched-chain amino acids, Sphingomyelins, Phospholipids, Acylcarnitines
1. Introduction
Alzheimer’s disease (AD) is the most common cause of dementia. An anticipated 136 million people will be affected by dementia by 2050, presenting major global health and economic challenges. There are currently no treatments that modify AD; hence, AD remains the largest unmet medical need within neurological disorders [1,2].
Many biochemical processes are affected in AD, including amyloid precursor protein metabolism, phosphorylation of tau protein, oxidative stress, impaired energetics, mitochondrial dysfunction, inflammation, membrane lipid dysregulation, and neurotransmitter pathway disruption [3,4]. Impaired cerebral glucose uptake occurs decades before the onset of cognitive dysfunction in AD [5], and neurotoxicity associated with Aβ is thought to participate in impaired neuronal energetics including mitochondrial dysfunction and release of reactive oxygen species. Growing evidence supports the concept that insulin resistance can contribute to AD pathogenesis, and therefore, AD could be regarded as a metabolic disease mediated in part by brain insulin and insulin-like growth factor resistance [3]. Mapping the trajectory of biochemical changes in AD is therefore becoming a priority as filling knowledge gaps about disease mechanisms and their link to metabolic processes can lead to developing much-needed biomarkers and therapies [3]. How does peripheral metabolism, diet, gut microbiome, and exposome impact the metabolic heath of the brain, and thus cognitive function? Which pathways are affected by genes that have been implicated in AD, such as presenilin 1 (PSEN1) and PS2 or apolipoprotein E (APOE) genes? Biochemical information elucidating these questions is critical for developing drugs that target enzymes and transporters which regulate metabolism.
Metabolomics provides powerful tools for mapping global biochemical changes in disease and treatment [6–10]. In contrast to classical biochemical approaches that focus on single metabolites or reactions, metabolomics and lipidomics approaches simultaneously identify and quantify hundreds to thousands of metabolites [11–19]. Measurement of large numbers of metabolites enables network analysis approaches and provides means to identify critical metabolic drivers in disease pathophysiology [20]. Initial small-scale metabolomics studies in AD have highlighted metabolic alterations including ceramide–sphingomyelin pathways [10], glycero-phosphatidylcholines (aa = diacyl, ae = acyl–alkyl) [PC] [15,21], PE plasmalogens [22,23], amines [24], and mitochondrial defects [25] among others [13,14]. Metabolic networks have linked central perturbations in norepinephrine and purines with elevated cerebrospinal fluid (CSF) tau, and changes in tryptophan and methionine to decreased Aβ levels [18]. More recently, the ARIC Neurocognitive Study identified PC aa C36:1 as being linked to lower risk of dementia; however, no metabolite from the panel measured added significantly to prediction of dementia beyond routine clinical variables [26]. A recent plasma–pathology correlative study found that plasma ceramides C16:0, C18:1, C20:0, and C24:1 and monohexosylceramides C18:1 and C24:1 were elevated in those with autopsy-confirmed AD pathology [27], but these metabolites did not differentiate AD from dementia with Lewy bodies. An autopsy study of frontal cortex metabolites from AD patients versus controls showed six central metabolic pathways were altered along with glycerophospholipid metabolism and aspartate metabolism. A metabolomics study in an AD mouse model (APPswe/PS1deltaE9 double transgenic) found abnormalities in polyamine metabolism, essential amino acids, branched-chain amino acids (BCAAs), and serotonin, as well as phospholipid and acylcarnitine homeostasis with brain changes preceding those in the blood [28]. Although these studies highlight specific metabolic underpinnings of AD, not all metabolomics findings have been replicated. For example, a metabolomics study of two separate cohorts—the Baltimore Longitudinal Study of Aging, and the Age, Gene/Environment Susceptibility-Reykjavik Study—did not replicate an earlier finding [11,12,15].
Earlier metabolomics studies had major limitations, including not accounting for important confounds such as impact of medications use; small studies that lacked evaluation across data sets; limited ability to connect peripheral metabolic changes with central changes to define what might be related, and lack of attempts to connect metabolic changes within a pathway and network context. Network biology and “network medicine” approaches have become important tools to dissect molecular mechanisms triggering neurodegeneration [29]. This approach accounts for the fact that complex diseases arise from alterations in multiple genes, proteins, and metabolites, and a network may be described as an interaction map among the wide range of biological entities which contribute to disease. As many of the metabolites that are associated with AD are interconnected through metabolic pathways, cofactors, and common intermediates, changes to one metabolite can entail several others, as well as have downstream effects on other coregulated pathways. A systems biology approach integrating metabolites and their interrelations (for instance quantified by partial correlations) in metabolic networks can provide important mechanistic insights about how biochemical reactions are dysregulated during different stages of disease. In contrast to looking at single dysregulated metabolite at a time, the visualization of changes in the metabolic network captures the totality of influences on interconnected biochemical reactions in far more informative ways and allows one to follow these changes over disease stages.
In this large study, we profiled baseline serum samples from the Alzheimer’s Disease Neuroimaging Initiative–1 (ADNI-1) cohort where vast data exist on each patient including cognitive decline and imaging changes over many years, information on CSF markers, genetics, and other omics data. We used CSF biomarkers to define early metabolic changes in cognitively normal participants who have CSF pathology and to evaluate metabolic signatures that might be related to Aβ1–42 and tau pathology. Using partial correlation networks, we defined progressive metabolic changes that accompany changes in CSF Aβ1–42, CSF tau, brain structure, and cognition [30], whereas coexpression networks were used to connect key metabolic changes implicated in disease. The relationship of metabolites with longitudinal cognitive and imaging changes helped us define metabolic signatures correlated with disease progression. Key associations were also present in multiple independent cohorts. We believe that the systems approach taken in our study to elucidate metabolic changes along different stages during the progression of AD will transform our understanding of disease mechanisms and lead to valuable peripheral biomarkers that can inform and accelerate clinical trials.
2. Methods
2.1. Study cohorts and samples
2.1.1. ADNI-1 baseline samples
ADNI shipped 831 samples with unique identifiers belonging to 807 subjects. These initial identifiers were different from the ADNI subject identifiers. There were duplicate aliquots from the same CSF draw for 24 subjects to help us evaluate analytical performance. Only after the final raw data were submitted to ADNI, the information was obtained to link the samples identifier to the subject RID and identify the duplicates.
Data were obtained from the ADNI database in September 2015 (http://adni.loni.usc.edu). ADNI-1 was launched in 2004 by the National Institute on Aging (NIA), the National Institute of Biomedical Imaging and Bioengineering, the Food and Drug Administration, private pharmaceutical companies, and nonprofit organizations [31]. ADNI-1 patients underwent extensive clinical and cognitive testing, including the Alzheimer’s Disease Assessment Scale–Cognition (ADAS-Cog13), which was used as a measure of general cognition in this analysis. AD dementia diagnosis was established based on the NINDS-ADRDA criteria for probable AD. Mild cognitive impairment (MCI) participants did not meet these AD criteria and had largely intact functional performance, meeting predetermined criteria for amnestic MCI [31]. Controls were cognitively normal (CN) (Supplementary Table 1). Additional details of participant selection criteria and protocol are available at http://www.adni-info.org and in the methods in the Supplementary Materials. The study was approved by institutional review boards of all participating institutions, and written informed consent was obtained from all participants and/or authorized representatives before study commencement.
2.1.2. Rotterdam and Erasmus Rucphen Family cohorts
Participants from the Erasmus Rucphen Family (ERF) study (N = 905) were metabolically profiled from fasting blood samples using the Biocrates AbsoluteIDQ-p150 kit platform (Supplementary Table 2) [32], which measures a subset of metabolites from the P180 and excludes many of the amines. A previously described quality control (QC) protocol was applied [32]. Valine was measured in fasting blood samples using the Brainshake platform [33] in 2752 participants from the Rotterdam large prospective cohort study [34]. Participants of the ERF study underwent a standardized cognitive test battery at the study center on the same day blood was drawn (Supplementary Table 2) [35]. Participants of the Rotterdam study underwent cognitive tests at the time of valine measurement, and all participants were followed up for AD clinical diagnosis [36], as previously described in detail [37].
The general cognitive ability or “g-factor” was calculated using previously described methods in dementia-free participants with available cognitive tests in the ERF study (N = 905) and Rotterdam Study (N = 2480) [38]. In short, the g-factor is a general cognitive function phenotype created by principal component analysis of multiple cognitive tests. A higher g-factor is associated with a higher general cognitive function, in contrast to the cognitive measure used for analysis of the ADNI-1 cohort, the ADAS-Cog13.
2.1.3. The Indiana Memory and Aging Study
The Indiana Memory and Aging Study (IMAS) is an ongoing longitudinal study investigating multimodal neuroimaging, cognition, fluid biomarkers, and genetics in early prodromal stages of AD with follow-up visits every 18 months [39–42]. IMAS participants included CN participants, euthymic older adults with subjective cognitive decline in the absence of significant psychometric deficits, and patients with amnestic MCI or probable AD (Supplementary Table 3). Because of limited sample size compared to other cohorts, analyses were limited to assessment of [11C] Pitts-burgh compound B (PiB) positron emission tomography (PET) amyloid status. Thirty-four participants had PET scans to measure brain Aâ load; 30 participants underwent [11C]PiB PET scans on a Siemens HR + PET scanner; and 4 participants underwent [18F]Florbetapir PET scans on a Siemens mCT. For the [11C]PiB PET, participants underwent either a 90-minute dynamic scan starting at time of tracer injection or a 50-minute dynamic scan after a 40-minute uptake period after injection of approximately 10 mCi of [11C]PiB. The [18F] Florbetapir PET scans were collected as a 30-minute dynamic scan after a 40-minute uptake period after an injection of approximately 10 mCi of [18F]Florbetapir. [11C]PiB and [18F]Florbetapir scans were motion-corrected and normalized to Montreal Neurologic Institute space using parameters from a same time point structural magnetic resonance imaging (MRI) scan. For the [11C]PiB PET images, a 40- to 90-minute standardized uptake value ratio (SUVR) image was created by averaging the appropriate frames and intensity normalizing to mean cerebellar gray-matter uptake. For the [18F]Florbetapir PET, a 40- to 70-minute SUVR image was created by averaging the appropriate frames and intensity normalizing to mean whole cerebellar uptake. Finally, amyloid positivity was defined as a mean [11C]PiB PET SUVR of ≥1.37 or a mean [18F]Florbetapir SUVR of ≥1.20 from a cortical gray-matter region of interest. These cutoffs were determined by simultaneous processing of the ADNI [11C] PiB and [18F]Florbetapir PET images using the same pipeline and adjusting the locally derived cutoffs to best match either the previously reported [11C]PiB PET cutoff of mean cortical SUVR ≥1.5 [43] or the [18F]Florbetapir PET cutoff of SUVR ≥1.10 [44], respectively. A side-by-side comparison of the three cohorts, including sample sizes, baseline cognitive diagnoses, and studied outcomes in each cohort, is offered in Supplementary Table 4.
2.2. AbsoluteIDQ-p180 kit metabolite measurements
Metabolites were measured with a targeted metabolomics approach using the AbsoluteIDQ-p180 kit (BIOCRATES Life Science AG, Innsbruck, Austria), with an ultra-performance liquid chromatography (UPLC)/MS/MS system [Acquity UPLC (Waters), TQ-S triple quadrupole MS/MS (Waters)] which provides measurements of up to 186 endogenous metabolites quantitatively (amino acids and biogenic amines) and semiquantitatively (acylcarnitines, sphingomyelins, PCs, and lyso-glycero-phosphatidylcholines (a = acyl) [lysoPCs] across multiple classes) (see methods in Supplementary Materials). The AbsoluteIDQ-p180 kit has been fully validated according to European Medicine Agency Guidelines on bioanalytical method validation. In addition, plates include an automated technical validation to approve the validity of the run and provide verification of the actual performance of the applied quantitative procedure including instrumental analysis. The technical validation of each analyzed kit plate was performed using MetIDQ software based on results obtained and defined acceptance criteria for blank, zero samples, calibration standards and curves, low/medium/high-level QC samples, and measured signal intensity of internal standards over the plate. This is a highly useful platform that was used in hundreds of publications, including several studies in AD [11,12,15].
Deidentified samples were analyzed following the manufacturer’s protocol, with metabolomics laboratories blinded to diagnosis and pathological data. Serum samples from all 807 ADNI-1 participants were analyzed, but after QC, a smaller number of participants were included in the analysis (Supplementary Fig. 1). Three participants were excluded because of incomplete clinical data, 70 samples were excluded because of nonfasting status, and two samples were excluded during the multivariate outlier detection step (see the following), leaving 732 participants included in the final analyses. Each assay plate included two sets of replicates: (1) A set of duplicates obtained by pooling the first 72 samples in the study (QC pool duplicates) and (2) 20 blinded analytical duplicates (blinded duplicates).
2.3. P180 QC
Metabolites with >40% of measurements below the lower limit of detection (LOD) were excluded from the analysis. Metabolite values were scaled across the different plates using the QC pool duplicates. LOD values were imputed using each metabolite’s LOD/2 value. Using the blinded duplicates, we selected metabolites with a coefficient of variation <20% and an intraclass correlation coefficient >0.65. Based on the QC process, 32 of the flow injection analysis metabolites and 14 of the UPLC metabolites were excluded from further analysis (Supplementary Table 5). We checked for the presence of multivariate outlier participants by evaluating the first and second principal components in each platform. Two multivariate outliers were beyond 7 standard deviations and were therefore excluded. For the participants with duplicated measurements, we used the average values of the two measured values in further analyses.
2.4. CSF Aβ1–42 and tau biomarkers
Lumbar puncture was performed in the mornings after an overnight fast. Aβ1–42, total tau (t-tau), and tau phosphorylated at threonine 181 (p-tau181) were measured using the multiplex xMAP Luminex platform (Luminex Corp, Austin, TX) with Innogenetics immunoassay kit-based reagents (INNO-BIA AlzBio3; Ghent, Belgium; for research use– only reagents) (methods in Supplementary Materials) [45]. CSF samples were available and measured for 48.8% of the CN, 52% of the MCI, and 54.9% of the AD participants. Aβ1–42-defined groups were classified as normal or pathological based on the previously published concentration (192 pg/mL) [46].
2.5. MRI measures
A 1.5-T MRI nonaccelerated sagittal volumetric 3D magnetization-prepared rapid gradient-echo MRI images were acquired at each performance site for the ADNI-1 participants (http://www.adni-info.org; http://adni.loni.usc.edu). Only images that passed QC evaluations were included. Cortical gray-matter volumes were processed using the FreeSurfer version 4.4 image processing framework (http://surfer.nmr.mgh.harvard.edu/) [47]. FreeSurfer ventricular volume of MRI scans that passed the QC was adjusted for total intracranial volume and used for longitudinal analyses. The Spatial Pattern of Abnormality for Recognition of Early Alzheimer’s Disease (SPARE-AD), an index that captures brain atrophy related to AD and has shown association with AD CSF biomarker and clinical measures, and was calculated for the baseline visit of ADNI-1 participants, was assessed in the present analysis [48,49].
2.6. Medication adjustment
In the ADNI and IMAS cohort, 41 major medication classes used to treat psychiatric (including different categories of benzodiazepines, antipsychotics, and antidepressants) and cardiovascular conditions (including different categories of antihypertensives, cholesterol treatment, and antidiabetics), as well as dietary supplements (Co-Q10, fish oil, nicotinic acid, and acetyl L-carnitine), were systematically coded and available for model-based evaluations of the influence of each drug type on metabolite levels (methods in Supplementary Materials). Intake of any medication within a category was coded as present or absent. Dose effect was not evaluated. The list of the studied medication categories and the percentage of subjects taking these medications in each of the diagnostic categories for the ADNI cohort is listed in Supplementary Table 6.
2.7. Statistical analysis
Metabolites with a skewness >2 [50] that showed a departure of the normality distribution (D’Agostino test P-value <.05) [50,51] were log10 transformed to normalize their distribution. We implemented a two-stage regression approach, whereby metabolites were first adjusted for confounding medications and dietary supplements in a linear regression model. For each metabolite, medications were backward-selected via Bayesian information criteria to select an optimal combination of medications for preventing confounding while limiting model complexity. One AD medication class, that is, anticholinesterases, were excluded from this process due to highly significant correlations (Spearman’s ρ = 63.4%, P = 1.28 × 10−83) of these medications with diagnosis (for details, see methods in Supplementary Materials). The residuals for each metabolite were then carried forward to test associations with clinical outcomes.
The cross-sectional association with categorical outcomes (clinical diagnosis and CSF Aβ1–42 group) was studied using a logistic regression model. For the cross-sectional quantitative outcomes (t-tau/Aβ1–42 ratio, SPARE-AD, and ADAS-Cog13), a linear regression model was applied. Age and gender were forced covariates in all the models associating with clinical variables, and education was also forced into the models for ADAS-Cog13 and clinical diagnosis, whereas APOE ε4 was backward-selected based on Bayesian information criteria for each outcome (see methods in Supplementary Materials and Supplementary Table 7). Diagnosis was not included as a covariate in the models in the primary analyses that studied Aβ1–42, t-tau/Aβ1–42 ratio, SPARE-AD, and ADAS-Cog13 associations. The P-values were Bonferroni corrected to adjust for multiple comparisons and a corrected .05 two-tailed P-value was considered significant. A Cox hazard model including age, gender, APOE ε4 presence, and education as covariates was used to evaluate the association of metabolite levels with progression from MCI to AD with a median follow-up of 3.0 years (interquartile range [IQR]: 2.0–6.1). A mixed-effects model that included age, gender, education, APOE ε4 presence, time, and metabolite level as independent variables was used to study longitudinal associations between the metabolites and volumetric MRI changes (transformed to normalized distribution) during follow-up in the MCI participants (AD participants were excluded because of short follow-up) [52]. A mixed-effects model was also used to evaluate the association of metabolites with change in ADAS-Cog13 (transformed to normalized distribution) and included education as an additional covariate. Both models accounted for baseline cognitive and MRI measures for each participant. Median follow-up times for the MRI and cognitive analyses were 3.0 years (IQR: 2.0–5.0). An interaction with time was included in all mixed-effects models for the studied metabolites.
In the Rotterdam study, a linear regression model was fitted for the cross-sectional analysis with g-factor as the outcome and valine as the determinant, adjusting for age, gender, lipid-lowering medication, and education. P-values and effect estimates of the significant metabolites are reported. [11C]PiB PET analysis for IMAS samples included age, gender, and APOE ε4 presence, along with the Aβ1–42 status on PET, as independent predictors of target metabolite measures using a linear regression model. All analyses were performed using the R software package [53].
2.7.1. Co-expression network construction and module analysis
We investigated the global baseline cross-sectional correlation structure of metabolites and their correlation with a subset of clinical and biomarker measures at baseline (Aβ1–42, tau/Aβ1–42 ratio, and ADAS-Cog13). We built the p180 coexpression network based on baseline-normalized data adjusted for age, education, gender, and APOE ε4 presence using the WGCNA R package [54].
2.7.2. Partial correlation analysis
Biochemically related metabolites and propagation patterns of effects on the clinical variables were investigated from a network perspective. A Gaussian graphical model (GGM) calculation was performed as described in Krumsiek et al. [55] using the GeneNet R package with default parameters. To illustrate effect propagation on clinical variables, we colored the resulting network similar to that in Mittelstrass et al. [56]. In brief, a GGM is an undirected graphical model based on partial correlation coefficients, that is, pairwise correlation coefficients conditioned against correlations with all other included variables. GGMs, contrary to correlation networks, thus can reveal the direct relations between metabolites. To account for correlations between metabolites and clinical or other potentially predictive variables, we used metabolite residuals that accounted for effects of medication and dietary supplements (as described previously) and additionally included age, gender, APOE ε4 presence, and education as covariates in the GGM generation process. To obtain significant partial correlations, we used a significance threshold of 0.05 after Bonferroni correction for all possible edges in the model (0.05/10,296 = 4.86 × 10⁻⁶). For each clinical variable, we colored the network representation of the GGM using the results of our regression analyses using sign(β)*(−log10(P)) to visualize both strength of association and direction of effect.
3. Results
Metabolomic analyses were performed in the ADNI-1 cohort, and key findings were further tested in the Rotter-dam, EFR, and IMAS cohorts. Overall descriptions of sample size, composition, and studied outcomes across the different cohorts are shown in Supplementary Table 4. The results are presented for each cohort in the following.
3.1. ADNI-1 cohort
In ADNI-1, CN, MCI, and AD participants did not differ in mean age but, as expected, differed in APOE ε4 frequency, baseline cognition, MRI atrophy index, and CSF levels of T-tau and Aβ1–42. The heat map (Fig. 1) (and the later described coexpression networks in Supplementary Fig. 2) shows that the global (i.e., direct and indirect) correlation structure between metabolites is formed into biochemical classes, illustrating that the metabolites with significant findings can be seen as proxies for the group of their correlating metabolites (Supplementary Material File 2 presents the correlation values).
Fig. 1.

Clustering of pairwise metabolite correlations and association results with clinical variables. (A) Heat map of Spearman correlations between the residuals of metabolite concentrations on the single metabolites. Metabolites are clustered using hierarchical clustering using the Euclidean distance metric. The clustering assigns metabolites to their biochemical class: amino acids, biogenic amines, short-chain and long-chain acylcarnitines, lyso-lipids, PC, and SM. Significant clusters of acylcarnitines are outlined in blue and amines outlined in brown. (B) Association results of the regression analyses. The distribution of association results of metabolites with clinical variables mirrors the correlation structure of the metabolites. Abbreviations: α-AAA, α-aminoadipic acid; AD, Alzheimer’s disease; C0, free carnitine; Cx:y, acylcarnitines; Cx:y-OH, hydroxylacylcarnitines; Cx:y-DC, dicarboxylacylcarnitines; CN, cognitively normal; lysoPC, lyso-glycero-phosphatidylcholines (a = acyl); MCI, mild cognitive impairment; Path. Aβ1–42, pathological Aβ1–42; PC, glycero-phosphatidylcholines (aa = diacyl, ae = acyl–alkyl); SDMA, symmetric dimethylarginine; SM, sphingomyelin; SMx:y, sphingomyelins; SM (OH) x:y, N-hydroxylacyloylsphingosyl-phosphocholine; T4-OH-Pro, trans-4-hydroxyproline.
3.2. ADNI-1: Metabolites associated with cross-sectional clinical, MRI, and CSF biomarker measures
The metabolites that remained in the analyses after the QC steps showed different correlation strengths, indicating groups of metabolites that may be involved in similar processes (Fig. 1). After applying Bonferroni multiple comparison correction, 13 metabolites showed significant associations (Bonferroni-adjusted P-value <.05) with cognitive scores and CSF and MRI biomarker measures (Table 1). Six metabolites were associated with CSF Aβ1–42 positivity (ether-containing PC [PC ae] C36:2, PC ae C40:3, PC ae C42:4, PC ae C44:4, SM (OH) C14:1, SM C16:0), four were associated with t-tau/Aβ1–42 ratio (C18, PC ae C36:2, SM C16:0, SM C20:2), five were associated with ADAS-Cog13 scores (C14:1, C16:1, SM C20:2, α-aminoadipic acid [α-AAA], and valine), and 6 were associated with SPARE-AD scores (C12, C16:1, PC ae C42:4, PC ae C44:4, α-AAA, and valine). In all analyses, higher acylcarnitine, PC, and sphingomyelin (SM) values were associated with worse clinical and biomarker measures, whereas the opposite direction of associations was observed for valine and α–AAA values. The complete results for the 138 studied metabolites are listed in Supplementary Table 8, where many amines (including isoleucine, glutamate, tyrosine, tryptophan, glycine, proline, histidine, T4OH proline) and other metabolites within PC and SM classes showed significant non–comparison-corrected associations with clinical markers and outcomes but did not survive Bonferroni multiple comparison correction. Supplementary Tables 9 and 10 present the analyses adjusted by clinical diagnosis and stratified by each of the three clinical diagnostic categories, respectively. All significant correlations were in the same directions in the clinical diagnostic groups.
Table 1.
Metabolites associated with clinical diagnosis, MRI, or CSF biomarkers after Bonferroni correction
| Metabolites | MCI | AD | Aβ1–42 | T-tau/Aβ1–42 | ADAS-Cog13 | SPARE-AD |
|---|---|---|---|---|---|---|
| C12 | 0.9 (1.0) | −1.62 (1.0) | 1.22 (1.0) | 0.26 (.33) | 5.88 (.073) | 0.87 (.041) |
| C14:1 | 10.79 (1.0) | −12.25 (1.0) | 12.93 (1.0) | 2.46 (.05) | 52.21 (.037) | 6.8 (.1) |
| C16:1 | 1.25 (1.0) | −2.098 (1.0) | 1.62 (1.0) | 0.38 (.091) | 9.4 (.0037) | 1.2 (.020) |
| C18 | 14.62 (1.0) | −19.27 (1.0) | 21.62 (1.0) | 4.64 (.0055) | 64.31 (.5) | 10.0095 (.2) |
| PC ae C36:2 | 0.085 (.33) | −0.082 (1.0) | 0.16 (.007) | 0.018 (.013) | 0.23 (1.0) | 0.027 (1.0) |
| PC ae C40:3 | 0.98 (1.0) | −3.27 (1.0) | 5.76 (.017) | 0.49 (.55) | 2.72 (1.0) | 0.26 (1.0) |
| PC ae C42:4 | 1.62 (.063) | −1.51 (.88) | 2.32 (.017) | 0.19 (.75) | 3.63 (1.0) | 0.79 (.049) |
| PC ae C44:4 | 3.029 (1.0) | −3.37 (1.0) | 6.11 (.016) | 0.6 (.089) | 11.24 (.64) | 2.059 (.037) |
| SM (OH) C14:1 | 0.06 (1.0) | −0.054 (1.0) | 0.24 (.044) | 0.027 (.081) | 0.2 (1.0) | 0.016 (1.0) |
| SM C16:0 | 0.0065 (1.0) | −0.0074 (1.0) | 0.015 (.016) | 0.0017 (.013) | 0.024 (1.0) | 0.0037 (.57) |
| SM C20:2 | 0.66 (1.0) | −1.082 (.22) | 0.74 (1.0) | 0.18 (.047) | 4.57 (<.0001) | 0.4 (.48) |
| α-AAA | −0.46 (1.0) | 0.67 (1.0) | −0.68 (1.0) | −0.13 (.098) | −3.7 (.0025) | −0.61 (<.0001) |
| Valine | −0.0038 (1.0) | 0.0073 (.079) | −0.004 (1.0) | −0.0006 (1.0) | −0.028 (<.0001) | −0.0039 (<.0001) |
Abbreviations: MRI, magnetic resonance imaging; CSF, cerebrospinal fluid; MCI, mild cognitive impairment; AD, Alzheimer’s disease; ADAS-Cog13, Alzheimer’s Disease Assessment Scale–Cognition; SPARE-AD, Spatial Pattern of Abnormalities for Recognition of Early AD; α-AAA, α-aminoadipic acid.
NOTE. The cells include the logistic (MCI and AD) and linear (Aβ1–42, T-tau/Aβ1–42, ADAS-Cog13, SPARE-AD) regression coefficients and, in parenthesis, the Bonferroni corrected P-value. All model included age and gender as covariates. APOE ε4 presence included in Aβ1–42 model and education was included in the MCI, AD, and ADAS-Cog13 models. A complete list is found in Supplementary Table 2. Bold text indicates significant results.
We next evaluated differences in levels of key metabolites associated with cognitive or biomarker measures from the analyses reported previously between the three diagnostic groups (CN, MCI, and AD) subclassified by CSF Aβ1–42 positivity status. Metabolites showed three different patterns of associations with the CSF AD biomarkers. PC ae C44:4, PC ae C36:2, and C18 represented the most significant examples of each of these patterns, and the values in the six groups are shown in Fig. 2. Of note, CN participants (red boxes) with pathological CSF Aβ1–42 values showed significant metabolic changes in a specific group of metabolites compared with CN with no pathological CSF Aβ1–42 values (Fig. 2A). Some of the changes associated with CSF Aβ1–42 values appeared in clinical stages of disease (MCI and AD; Fig. 2B). Other metabolic changes were only observed in comparing CN participants to clinically impaired subjects (Fig. 2C) but showed no associations with pathological CSF Aβ1–42 status. Fig. 2D illustrates valine correlation with cognition in the ADNI-1 study.
Fig. 2.

Relationship between serum metabolites, clinical diagnosis, and Aβ1–42 status. Serum PC ae 44:4 (A), PC ae 44:4 (B), and C18 (C) concentrations stratified by clinical diagnosis and CSFAβ1–42–defined groups. The concentration of each metabolite is shown for each diagnosis red: CN, green: MCI, blue: AD and by N. Abeta: normal concentrations of Aβ1–42 (>192 pg/mL), and Path. Abeta: pathological concentrations of Aβ1–42 (<192 pg/mL), Y-axes are values for each metabolite. Scatter plot for ADAS-Cog13 and serum valine values (D). Black line and shading are the regression line and 95% confidence interval. (D and E) Correlations between valine levels and cognitive decline in ADNI-1 and Rotterdam, respectively. Abbreviations: α-AAA, α-Aminoadipic acid; ADAS-Cog13, Alzheimer’s Disease Assessment Scale–Cognition; ADNI-1, Alzheimer’s Disease Neuroimaging Initiative–1; C0, free carnitine; Cx:y, acylcarnitines; Cx:y-OH, hydroxylacylcarnitines; Cx:y-DC, dicarboxylacylcarnitines; lysoPC, lyso-glycero-phosphatidylcholines (a = acyl); PC, glycero-phosphatidylcholines (aa = diacyl, ae = acyl–alkyl); SDMA, symmetric dimethylarginine; SMx:y, sphingomyelins; SM (OH) x:y, N-hydroxylacyloylsphingosyl-phosphocholine; T4-OH-Pro, trans-4-hydroxyproline.
3.3. Metabolites associated with longitudinal outcomes in the ADNI-1 cohort
We evaluated whether levels of metabolites at baseline were associated with (1) ADAS-Cog13 changes up to 5 years; (2) ventricular volume changes up to 5 years; or (3) progression from MCI to AD (Table 2). Regression coefficients of six metabolites (PC ae C40:3, PC ae C42:4, PC ae C44:4, SM (OH) C14:1, SM C16:0, and SM C20:2) showed a positive association with all three longitudinal outcomes. In addition, lower valine and α–AAA values were associated with faster cognitive decline, similarly the coefficient for valine was negatively associated with ventricular volume changes. Fig. 3 shows some of these associations as examples, including Fig. 3A which shows the Cox hazards model of the association of SM C20:2 with conversion from MCI to AD, and Fig. 3B which shows the association between baseline concentration of SM 20:2 (presented as tertiles) and longitudinal cognitive (ADAS-Cog13) and MRI (brain ventricular volume) change.
Table 2.
Association of metabolites with longitudinal cognitive and MRI changes in MCI
| Analytes | ADAS-Cog13 change | Ventricle volume change | Progression MCI to AD dementia |
|---|---|---|---|
| C12 | 0.091 (.26) | 0.11 (.73) | 1.37 (.4) |
| C14:1 | 1.39 (.034) | 7.085 (.006) | 2.11 (.22) |
| C16:1 | 0.15 (.13) | 0.67 (.092) | 1.9 (.19) |
| C18 | −0.16 (.87) | 1.94 (.64) | 2.41 (.18) |
| PC ae C36:2 | 0.0075 (.094) | 0.031 (.096) | 1.056 (.012) |
| PC ae C40:3 | 0.38 (.02) | 1.5 (.020) | 5.98 (.027) |
| PC ae C42:4 | 0.15 (.04) | 0.72 (.013) | 1.96 (.042) |
| PC ae C44:4 | 0.49 (.0076) | 2.33 (.0012) | 5.89 (.027) |
| SM (OH) C14:1 | 0.015 (.04) | 0.075 (.01) | 1.08 (.025) |
| SM C16:0 | 0.0009 (.025) | 0.0037 (.023) | 1.004 (.029) |
| SM C20:2 | 0.11 (.0078) | 0.48 (.0035) | 1.9 (.0023) |
| α-AAA | −0.093 (.022) | −0.29 (.087) | 0.68 (.061) |
| Valine | −0.0006 (.035) | −0.0027 (.026) | 1.0 (.27) |
Abbreviations: MRI, magnetic resonance imaging; MCI, mild cognitive impairment; ADAS-Cog13, Alzheimer’s Disease Assessment Scale–Cognition; AD, Alzheimer’s disease; PC ae, ether-containing PC; α-AAA, α-aminoadipic acid.
NOTE. Table depicts the association between selected metabolites and longitudinal ADAS-Cog13 (column 2) and ventricular volume (column 3) in mixed-effects models that were age, gender, and APOE adjusted. In addition, the ADAS-Cog13 model was adjusted for education. Boxes contain the coefficients and, in parenthesis, the P-values. The last column (column 4) presents the associations of the metabolites with progression from MCI to AD in Cox hazards models that included age, gender, education, and APOE as covariates. Values represent hazard ratio and, in parenthesis, the P-values. Significant associations are bolded for an easier visualization. All P-values were not multiple comparison corrected.
Fig. 3.
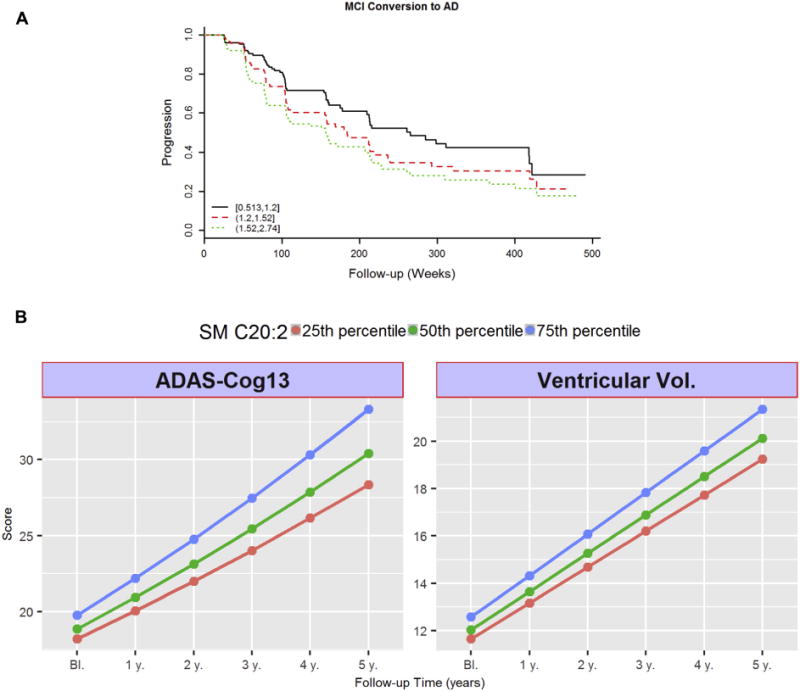
Longitudinal associations for SM C20:2. (A) Cox hazards model of the association of conversion from MCI to AD. Black line: 1st tertile, red line: 2nd tertile, green line: 3rd tertile. Analysis was conducted using quantitative values, and stratification by tertiles was used only for graphical representation. (B) Association between baseline concentrations of SM 20:2 and longitudinal cognitive (ADAS-Cog13) and imaging (MRI: brain ventricular volume) changes during follow-up. Lines represent trajectories on subjects on the 25th percentile (black line), 50th percentile (red line), 75th percentile (green line) of baseline SM 20:2. Y-axes are ADAS-Cog13 score (left) and ventricular volume (right). Trajectories for these values are calculated based on the studied mixed-effects models. Abbreviations: AD, Alzheimer’s disease; ADAS-Cog13, Alzheimer’s Disease Assessment Scale–Cognition; MCI, mild cognitive impairment; MRI, magnetic resonance imaging.
3.4. Evaluation of findings in the Rotterdam and ERF studies
In the Rotterdam and ERF studies, only a subset of metabolites were measured from the panel of P180 metabolites evaluated in the ADNI-1 study (P150 panel, Supplementary Table 11). Using a targeted approach, we tested whether the metabolites that showed a significant association in the ADNI-1 study were also correlated with cognition (general cognitive ability: g-factor) in the Rotterdam Study or ERF.
For the cross-sectional analysis, eight metabolites were available in the ERF study. Two of these metabolites (PC ae C40:3 and SM C20:2) were associated with cross-sectional general cognitive ability in the expected direction based on the discovery ADNI-1 cohort. Notice that higher general cognitive ability levels indicate better cognition as opposed to ADAS-Cog13. Valine was strongly associated with a higher general cognitive ability (P =.00035) in the Rotterdam study (Fig. 2E), which is in line with the association with ADAS-Cog13 in ADNI-1 (Fig. 2D). Longitudinally, 342 participants developed AD in the Rotterdam study after a median follow-up time of 9.7 years (IQR 5.6–10.5). A Cox proportional hazard model was fitted adjusting for age at baseline, gender, education, and lipid-lowering medication and indicated that a 1-SD increase in valine concentration was also associated with a decreased risk of AD (P = .044).
3.5. Evaluation of Aβ1–42 signature in the IMAS cohort
Three of the six metabolites (PC ae 42:4, PC ae 44:4, and SM (OH) C14:1) that showed an association with CSF Aβ1–42 positivity in the ADNI-1 cohort were also associated with amyloid positivity on PET in the IMAS cohort (n = 34; Supplementary Table 12).
3.6. Partial correlation networks for Aβ1–42, T-tau, SPARE-AD, ADAS-Cog13—metabolic trajectory for disease
We strived to define insights into the trajectory of biochemical changes that correlate with established models for disease [30], Aβ pathology, tau, imaging changes, and cognitive decline, building partial correlation networks for each clinical measure.
The partial correlation networks established direct connections between the measured metabolites, which have been shown to depict direct biochemical relationships between metabolites while omitting mediated correlations [55,57]. Fig. 4 integrates the strength of the partial correlations between metabolites and overlays on these networks the associations with the studied outcomes Aβ1–42 t-tau, SPARE-AD, and ADAS-Cog13 (partial correlation networks for p-tau and t-tau/Aβ1–42 ratio are not shown). The networks showing the direct links between metabolites (nodes) identified through their strong partial correlations (edges) expand the heat map information (Fig. 1). Through coloring of the metabolite nodes by their association to CSF, imaging, and cognitive markers, respectively (where bright colors indicate strong associations and blue and red color indicate upregulation and downregulation of metabolites), these networks demonstrate how the effects of clinical variables propagate along the edges within the network suggesting that the results follow biochemically plausible pathways. The studied outcomes cover the different stages of AD, matching known biomarkers of disease [30].
Fig. 4.
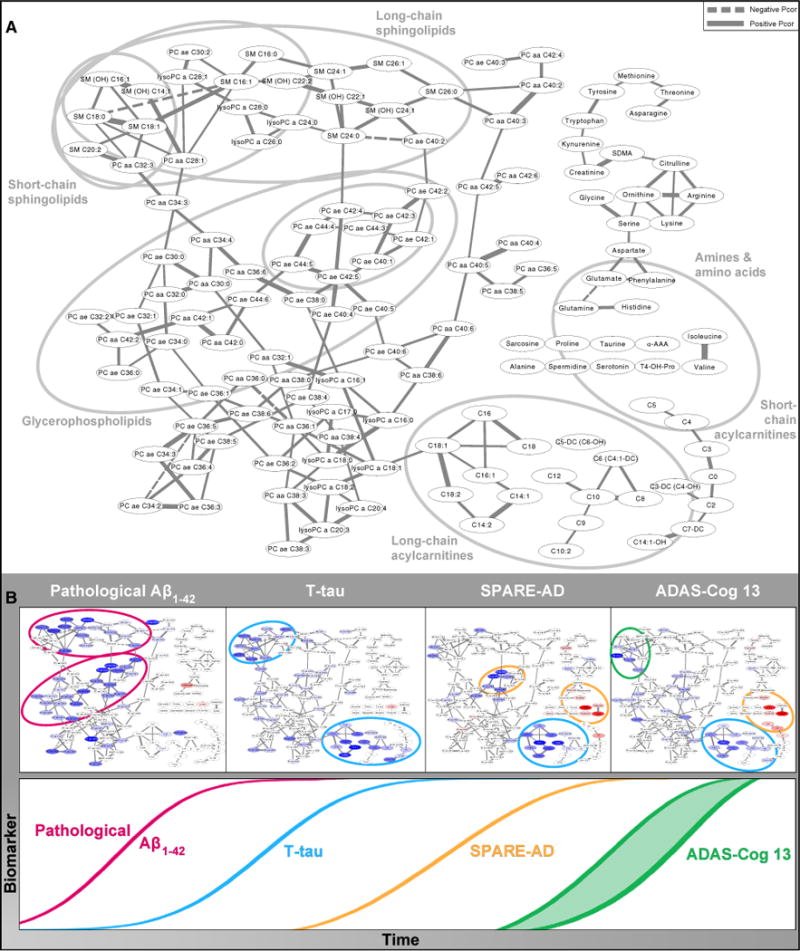
Network model showing metabolic pathways correlated with the temporal evolution of biomarkers and clinical variables in AD. (A) Partial correlation network. Gaussian graphical model of metabolite concentrations showing reconstructed metabolic pathways and highlighting of the different modules involved in the steps along the temporal evolution of biomarkers and clinical variables in AD. Nodes in the network represent the metabolites, and edges (lines) illustrate the strength and direction of their partial correlations. Only partial correlations significant after Bonferroni correction for all possible edges are included. Labels show the major classes of metabolites included in our study. Gray circles outline the modules highlighted in panel B. (B) Schematic diagram of the model of temporal evolution of biomarkers in AD, modified from Jack and Holtzman [30], augmented with colored versions of the network from panel A. In these networks, nodes are highlighted according to the strength and direction of the metabolite’s association with the respective clinical trait with blue as positive and red as negative (networks in temporal order from left to right: pathological Aβ1–42, T-tau, SPARE-AD, and ADAS-Cog13). Significant associations are colored in dark blue/bright red, and weaker (but at least nominally significant at 0.05) associations are displayed in fainter colors. Modules of metabolites implicated in the respective trait are highlighted by circles colored by their first occurrence in the temporal order following the color scheme of the time sequence on the bottom. The partial correlation network for Aβ1–42 (panel A) highlighted direct correlations with short- and medium-chain SM and PC with ether bonds suggesting a role for membrane structure and function, contact sites, and membrane signaling in amyloid pathology. There was a different pattern for tau (panel B) with highlighted metabolites with long-chain acylcarnitines and SM implicated in lipid metabolism showing association with T-tau level. The SPARE-AD and ADAS-Cog13 partial correlation networks were very similar suggesting associations of brain atrophy and cognitive decline with metabolic changes in BCAAs and short-chain acylcarnitines that have been implicated in mitochondrial energetics as well as additional changes in lipid metabolism. Abbreviations: AD, Alzheimer’s disease; ADAS-Cog13, Alzheimer’s Disease Assessment Scale–Cognition; BCAA, branched-chain amino acid; PC, glycero-phosphatidylcholines (aa = diacyl, ae = acyl–alkyl); SM, sphingomyelin; SPARE-AD, Spatial Pattern of Abnormalities for Recognition of Early AD.
The network for Aβ1–42 (Fig. 4A) highlighted direct correlations with short- and medium-chain SMs and PC with ether bonds, suggesting a role for membrane structure and function, contact sites, and membrane signaling in amyloid pathology. The correlation pattern for t-tau (Fig. 4B) highlighted metabolites among long-chain acylcarnitines and SMs implicated in lipid metabolism. The SPARE-AD and ADAS-Cog13 (Fig. 4B) partial correlation networks were very similar, suggesting associations of brain atrophy and cognitive decline with metabolic changes in BCAAs and short-chain acylcarnitines implicated in mitochondrial energetics as well as additional changes in lipid metabolism.
3.7. Coexpression network—direct and indirect connections for key metabolites
The partial correlation networks mentioned previously evaluated only direct connections among metabolites. To capture both indirect and direct correlations, we built coexpression networks to evaluate the number of modules in our data set and evaluate additional connections between key metabolites identified as related to cognitive or biomarker measures in ADNI-1. The full coexpression network, which identified seven metabolic modules, can be found in Supplementary Fig. 2, and Supplementary Material File 3 presents each of the individual correlations.
We investigated the correlation structure of the three metabolites in the ERF and Rotterdam data sets that significantly associated with cognition, namely PC ae C40:3, SM C20:2, valine as shown in Fig. 5. The subnet-work shows these three metabolites to have high correlations (marked as red edges) to other functional metabolic modules via direct and indirect links. Valine was highly correlated with isoleucine and α-AAA, whereas SM C20:2 was highly correlated with a subset of the SMs including SM C16:0. Finally, PC ae C40:3 was highly correlated with PCs and SMs, but not amines and acylcarnitines. These SMs and PCs were significantly associated with cognitive scores, CSF biomarkers, and MRI measures (Table 1).
Fig. 5.

Coexpression subnetwork with direct and indirect interconnections between select metabolites. A coexpression subnetwork focused on three metabolites also identified in the Rotterdam data set (PC ae C40:3, valine, and SM C20:2) was generated from the primary network (Supplementary Fig. 2). The subnetwork shows these three metabolites have high correlations (red edges lines) and lower correlations (green edges lines) to multiple modules via direct and indirect interconnections. Each module is denoted by a color representing a robust set of coregulated metabolites in interconnected biochemical pathways, for example, orange module contained a subset of amines, green module consists of long-chain acylcarnitines; teal, brown, and blue modules contained exclusively PC and lysoPC; red module contained SM and PC; gray module contained short-chain acylcarnitines and other amines. Each node represents a metabolite. The edge (line) opacity is proportional to the Pearson correlation, that is, lighter means weaker correlation value and darker means stronger correlation. The intermodule edges represent correlations and potentially indirect interactions among metabolites and biochemical pathways. The coexpression network captures all significant associations between metabolites and reveals a global correlation structure and interconnections among different modules that adds to our understanding of the disease network. Abbreviations: lysoPC, lyso-glycero-phosphatidylcholines (a = acyl); PC, glycero-phosphatidylcholines (aa = diacyl, ae = acyl–alkyl); PC ae, ether-containing PC; SM, sphingomyelin.
4. Discussion
The Alzheimer Disease Metabolomics Consortium (ADMC) funded by the NIA under the AMP-AD and MOVE-AD initiatives and in partnership with ADNI has as its goal to create a comprehensive metabolomics database for AD. These data will fill in biochemical knowledge about disease mechanisms that can be used as a roadmap for novel drug discovery and establishment of blood-based biomarkers. Eight complementary, targeted and nontargeted, metabolomics platforms are currently in the process of generating data on ADNI participants to define the metabolic trajectory of disease connecting central and peripheral metabolic failures in a pathway and network context. We seek to replicate earlier findings and test hypotheses but also expand on biochemical coverage to better understand disease pathogenesis by using complementary data unique to ADNI-1. The unique opportunity of having longitudinal cognitive and imaging data on each subject for close to a decade enables identification of peripheral biomarkers that are disease related.
This is the first report from ADMC on use of a targeted, highly validated metabolomics platform with the analysis guided by CSF markers and imaging data. Using 732 baseline serum samples from the ADNI-1 cohort, we systematically evaluated the relationships between metabolomics data and cross-sectional clinical, CSF, and MRI measures, as well as their association with longitudinal cognitive and brain volume changes. We demonstrate a novel approach to the analysis of neurodegenerative disease mechanisms. Multiple comparisons and covariate-adjusted analyses, that included relevant medications, identified sets of metabolites that became altered at specific disease stages (preclinical AD with biomarker-defined AD pathology vs. symptomatic stages) [30]. Using partial correlation networks, we integrate our findings of metabolic effects on AD pathogenesis, linking central and peripheral metabolism in a way that consistently reconciles biochemical trajectories of disease with this established temporal sequence of pathophysiological stages of AD. In the following, we therefore discuss our findings in their temporal order along AD pathogenesis.
4.1. Aβ pathology
Changes observed earliest in AD, namely in biomarker-defined preclinical stages [58] in CN participants, were higher levels of a specific set of PCs (PC ae C36.2, PC ae C40.3, PC ae C42.4, and PC ae C44.4) and SMs (SM (OH) C14.1, SM C16.0). These metabolites were associated with abnormal CSF Aβ1–42 values in CN participants to a similar degree as observed in MCI, indicating an early role of ether-containing PC species and SM in the development of the disease. Interestingly, most of these metabolites were also associated with later cognitive decline and global brain atrophy changes in the MCI group (Table 1). The use of information on AD CSF biomarkers was extremely useful and guided our metabolomics data. Only after substratification of the diagnostic groups (CN, MCI, and AD) based on CSF biomarkers, we were able to detect the increased values of these metabolites in participants with CSF pathology stressing the importance of using biomarkers to detect early biochemical changes [59]. Our findings along with those of several others [11,15] all point to problems with phospholipid metabolism that happen early in the disease process. These early changes by themselves are not sufficient predictors of disease or progression, but they might provide extremely valuable mechanistic insights.
Partial correlation networks showed that the pathological CSF Aβ1–42 values were associated with two groups of lipids, composed primarily of ether-containing PCs and relatively short-chain SMs. Ether-containing PC (PC ae) metabolites are PC species with an ether linkage of an aliphatic chain to the first hydroxyl position of glycerol. These lipids are not completely characterized and may represent a mixture of lipid metabolites including plasmalogens, acyl–alkyl PC, or PC containing an odd-numbered fatty acyl chain. When measured in the serum, the ether-containing lipids are derived from liver metabolism and are possible indicators of peroxisomal function and lipid oxidation status [60,61]. Plasmalogens and SMs are enriched in membrane rafts where they facilitate signal transduction and serve as a source for lipid secondary messengers [62]. The association of PCs and SMs in our study and others [14,63] with early changes in AD and with pathological CSF Aβ1–42 levels (Figs. 4B and 5) may be indicative of early neurodegeneration and loss of membrane function. Ether-linked PC metabolites are found in high abundance in plasma membranes and are a source for signaling molecules [64], particularly platelet-activating factor and arachidonic acid. Similarly, they are found in high abundance in immune cells, are regulatory factors, and may be part of the link between inflammation and AD [65]. Both SMs and ether-linked PCs may be located in membrane rafts, supporting the hypothesis that lipid rafts are directly associated with regulation of amyloid precursor protein processing, the production of Aβ1–42, and facilitate its aggregation [66]. All of these lipid biological functions related to Aβ1–42 might provide great insight about mechanisms of Aβ1–42 pathology, but at this early stage, we cannot assign cause or effect. Because this study was conducted using peripheral blood, we cannot directly associate the changes in neuronal lipid rafts with changes in signaling and accumulation of cerebral Aβ1–42.
Previous smaller studies relying on clinical measures identified only associations between these metabolite categories and dementia diagnosis or clinical progression [12,15,67], indicating that these metabolic pathways may contribute significantly to AD pathophysiology. Differences in the specific metabolites identified in the published studies [12,15,67] may be due to differences in sample selection criteria, disease severity, or for the absence or presence of controlling for different confounders in the data analysis.
4.2. Tau pathology
In this study, pathological CSF Aβ1–42 shows an association with ether-linked PC, and shorter chain SM, but not amines, lysoPC, or acylcarnitines. Aβ1–42 changes happen early in disease, followed by accumulation of tau protein in the CSF [30]. In our analysis, tau-related metabolites were very different both from those that correlate with Aβ1–42 as well as from metabolites associated with brain atrophy and cognitive changes. Tau-related metabolites thus appear to belong to an intermediate stage between Aβ1–42 accumulation and changes in imaging and cognitive function (Fig. 4B), further supporting our hypothesis that different metabolic events occur at different disease stages.
Long-chain acylcarnitines, PC ae C36:2, and SM.C20:2 were higher only in cognitively impaired participants with AD-like CSF Aβ1–42 values, indicating that changes in these metabolites are more specific to AD-related neurodegeneration reflecting possible changes in multiple cellular processes. Specifically, accumulation of acylcarnitine species containing long fatty acyl chains indicates malfunction of fatty acid transport and/or β-oxidation in mitochondria, inefficient utilization of fatty acids as energy substrates [68], or alterations in tau metabolism [69]. In the present study, we revealed that the levels of several acylcarnitine species were increased either at the MCI stage or in clinical AD [70] (Table 1). Acylcarnitines have important functions in the brain [70] such as mitochondrial function, energetics, and neurotransmission that need to be further explored and connected to peripheral function.
4.3. Brain volume changes and cognitive decline
In our study, partial correlation networks show a pattern of inverse associations between brain volume changes (measured by SPARE-AD) and cognition (ADAS-Cog13) and long and short acylcarnitines, valine, and α-AAA, indicating a shift in energy substrate utilization in later stages of AD (Fig. 4). By using a second type of networking analysis, a coexpression network, our data show the relationship between valine and short acylcarnitines (Fig. 5, dark green cluster), reinforcing the hypothesized changes in energetics. The association of the long-chain acylcarnitines, odd-numbered acylcarnitines, and amino acids in relation with ADAS-Cog scores supports a switch of utilization from fatty acids to amino acids and glucose. In the network analysis, the amines and short-chain acylcarnitines did not link to PCs and SMs, rather they clustered together in smaller groups. This may indicate that the short-chain acylcarnitines are associated in energy and amino acid metabolism rather than lipid metabolism in AD participants. This novel finding indicates a disease-associated transition in pathways for utilization of energy substrates. Whether such a switch is associated specifically with AD pathogenesis or is a function of aging [71] remains to be tested. Interestingly, ADAS-Cog13 does not show the associations with SMs or ether-linked PCs found with pathological CSF Aβ1–42. Therefore, it is possible that metabolic pathways other than those associated with lipid rafts are dys-regulated later in the disease process.
It is not clear if insulin resistance is a cause, an effect, or some combination of cause and effect in AD [72]. Insulin resistance, obesity, and diabetes are risk factors for AD [73], with lipid metabolism disorder (and inflammation) being a common link between metabolic disease, vascular disease, and AD. Several ether-linked PC metabolites have been associated with the risk of diabetes [74], insulin resistance promotes aminoacidemia and the use of amino acids for energy [68], and BCAA and α-AAA have been identified as predicting diabetes risk [75,76]. BCAAs (valine, leucine, and isoleucine) play central roles in metabolism and have been implicated in insulin resistance, type-2 diabetes mellitus, and obesity. Our findings in ADNI related to low levels of valine and its correlation with cognitive changes were confirmed in the large Rotterdam study, pointing to an important role for this BCAA in cognitive changes in AD. Low levels of BCAAs have been implicated in hepatic insulin resistance in liver disease and may have a broader role in insulin resistance in the brain [77]. The seemingly paradoxical directionality difference in correlation of BCAAs with diabetes and cognition needs to be further evaluated in longitudinal studies taking into account weight changes, tissue type, and differences in human and animal model systems [28,78]. Our understanding of the biochemical crossroads between diabetes and AD could be greatly enhanced by metabolic profiling of both central and peripheral tissues in both diseases and over time.
4.4. Concluding remarks
In summary, by using metabolomics and network approaches, this study has revealed lipid metabolic changes related to early stages of disease, as well as later changes related to mitochondrial energetics and energy utilization. We hypothesize that the lipid changes measured in this study reflect alterations in membrane structure and function early in the disease process and suggest a change in lipid rafts, which in turn, cause alterations in Aβ processing [66]. We hypothesize that over time, the changes in lipid membranes, particularly mitochondrial membranes, results in increased lipid oxidation, loss of membrane potential, and changes in membrane transport [79,80]. All of these lipid membrane changes might be reflected as disruption in BCAA as an energy source, production of acylcarnitines, and altered energy substrate utilization. The link between the altered energy metabolism, glycolysis, use of ketone bodies, and development of insulin resistance are all subject of ongoing longitudinal studies using complementary metabolomics platforms that enable the study of those biochemical pathways. The specific interactions between the peripheral metabolic network changes, central changes, and the timeline of AD pathophysiology reveal that peripheral metabolic changes can impact long-term brain health and function. This study thus provides an approach to define viable disease biomarkers based on understanding of whole-body AD pathophysiology at a systems level.
Previous studies have shown seemingly conflicting results regarding the diagnostic and prognostic classification of metabolomics data in AD [11,15]. Our findings show that using a network approach, many of these findings might be related such as early changes in phospholipid metabolism. Large meta-analysis across many metabolomics studies using our network approaches is ongoing.
By using the unique data available as part of ADNI, we were able to establish robust associations accounting for several confounders that lead to a better understanding of metabolic changes present in AD. Gender showed the strongest associations with many metabolites, but also age, BMI, and several medications and food supplements, such as statins and fish oils, had significant effects on several metabolites. The fact that medication use varied among the groups (e.g., fish oil intake was more frequent in CN and MCI subjects while use of selective serotonin reuptake inhibitors was lower in CN subjects) and that sometimes studied groups are unbalanced in terms of demographics makes it imperative to account for all possible confounders. Our results thus suggest that future studies should account for associations of metabolites with both gender and medications. This is an important outcome, as prior studies have failed to address effects of medications on the metabolome; a limitation that can cause misleading conclusions. Many of the drugs used by AD patients were shown to have profound effects on metabolism (for reviews on drug effects see Kaddurah-Daouk and Weinshilboum [8,9]). A detailed analysis of medications as confounds and meta-analysis of previously reported metabolomics studies addressing confounds will be published separately.
Limitations of our study are several. At this early stage, we cannot determine which of the metabolic changes we see are causative and which are a consequence of disease. Future mechanistic studies in model systems are needed to test hypothesis generated along with building of predictive metabolic networks. Gender metabolic differences are clear from this data set and although adjusted for in this study ongoing analysis and modeling of gender differences will be key. Profiling blood samples across the trajectory of disease will provide valuable information and is currently ongoing. In addition, analysis of CN cohort with normal CSF Aβ1–42 values will be useful to evaluate within subject variability. Linking peripheral and central metabolic changes in blood, CSF, and brain tissue is critical for better defining peripheral influences like diet and environment on brain health and disease. The effect of confounds like medications impacts metabolomics findings in significant ways and must be addressed carefully. In our study, we had medication data for two of the cohort (ADNI and IMAS), but this information was not available for the Rotterdam and ERF studies. Therefore, there are differences in how the data were processed across cohorts. Finally, neuropsychological assessments evaluated in the ADNI and Rotterdam and ERF scores were not the same. ADNI analyses were based on a global cognitive scale, whereas in the Rotterdam and ERF studies, a composite measure, the g-factor. Therefore, these scales might differently represent the summary of the diverse cognitive functions.
Over the past decade, we have gained significant knowledge about effects of commonly used medications and have tried to address their confounds in studies such as ADNI. More sophisticated modeling approaches will be needed to address complex interactions with medications so this study presents early effort. Defining genetic factors that influence metabolic changes is key and is ongoing. Broad biochemical coverage is needed to better define mechanism and trajectory of disease. The ADMC is producing metabolomics data sets from eight targeted and nontargeted platforms on the large ADNI cohort. After these and other cohort data sets are available, we look forward to working with the international scientific community to build a comprehensive model for AD using integrated multiomic network approaches.
Supplementary Material
RESEARCH IN CONTEXT.
Systematic review: We searched PubMed and reviewed all publications reporting on the use of metabolomics technologies for defining signatures in plasma, serum, or cerebrospinal fluid (CSF) in Alzheimer’s disease (AD), mild cognitive impairment (MCI) when compared to healthy control subjects. Few small cohort studies have reported on findings with no replication and validation and results have been conflicting. Previous studies have not accounted for medication effects and did not include imaging or Aβ biomarkers for connecting peripheral and central changes.
Interpretation: Studying a large cohort of patients (AD, MCI, and cognitively normal) at different disease stages with guiding data on CSF and magnetic resonance imaging AD biomarkers, we identified peripheral metabolic changes in preclinical stages of disease and additional metabolic changes associated with imaging changes and cognitive decline. Results were validated in three additional cohorts (Rotterdam, Erasmus Rucphen Family, and Indiana Memory and Aging Study). Partial correlation networks and coexpression networks revealed progressive interconnected biochemical changes in disease.
Future directions: (1) Expand biochemical coverage and the number of metabolic processes studied, (2) continue to link peripheral and central metabolic changes, and (3) test which changes are causative and which are secondary to disease processes.
Acknowledgments
National Institute on Aging (R01AG046171, RF1AG051550, and 3U01AG024904-09S4) supported the Alzheimer Disease Metabolomics Consortium. J.B.T. is supported by National Institute on Aging (R01AG046171, RF1AG051550, and P50 NS053488). A.J.S. is additionally supported by NIA R01 AG19771, NIA P30 AG10133, and NLM R01 LM011360. J.Q.T. is additionally supported by National Institute on Aging (P30 AG10124) in the conduct of ADNI-1 data analyses. M.A. was supported by the Helmholtz cross-program topic “Metabolic Dysfunction.” K.N. was additionally supported by National Library of Medicine (R00 LM011384). L.S. was additionally supported by National Library of Medicine (R01 LM011360) and National Institute of Biomedical Imaging and Bioengineering (R01 EB022574). S.L.R. was additionally supported by National Institute on Aging K01 AG049050, the Alzheimer’s Association, the Indiana Clinical and Translational Science Institute, and the Indiana University-IU Health Strategic Neuroscience Research Initiative. K.S. was supported by “Biomedical Research Program” funds at Weill Cornell Medical College in Qatar, a program funded by the Qatar Foundation Data collection and sharing for this project was funded by the ADNI (National Institutes of Health grant U01 AG024904) and DOD ADNI (Department of Defense award number W81XWH-12-2-0012). ADNI is funded by the National Institute on Aging, the National Institute of Biomedical Imaging and Bioengineering, and through generous contributions from the following: Alzheimer’s Association; Alzheimer’s Drug Discovery Foundation; Araclon Biotech; BioClinica, Inc.; Biogen Idec Inc.; Bristol-Myers Squibb Company; Eisai Inc.; Elan Pharmaceuticals, Inc.; Eli Lilly and Company; Euroimmun; F. Hoffmann-La Roche Ltd. and its affiliated company Genentech, Inc.; Fujirebio; GE Healthcare; IXICO Ltd.; Janssen Alzheimer Immunotherapy Research & Development, LLC.; Johnson & Johnson Pharmaceutical Research & Development LLC.; Medpace, Inc.; Merck & Co., Inc.; Meso Scale Diagnostics, LLC.; NeuroRx Research; Neurotrack Technologies; Novartis Pharmaceuticals Corporation; Pfizer Inc.; Piramal Imaging; Servier; Synarc Inc.; and Takeda Pharmaceutical Company. The Canadian Institutes Health Research is providing funds to support ADNI clinical sites in Canada. Private sector contributions are facilitated by the Foundation for the National Institutes of Health (www.fnih.org). The grantee organization is the Northern California Institute for Research and Education, and the study is coordinated by the Alzheimer’s Disease Cooperative Study at the University of California, San Diego. ADNI data are disseminated by the Laboratory for Neuro Imaging at the University of Southern California. The Alzheimer Metabolomics consortium is a part of NIA national initiatives AMP-AD and M2OVE AD.
Erasmus Rucphen Family study (ERF): The ERF study was approved by the Medical Ethics Committee of the Erasmus MC. The committee is constituted according to the WMO (National act medical-scientific research in human beings). A written informed consent was obtained from all study participants. The ERF study as a part of EUROSPAN (European Special Populations Research Network) was supported by European Commission FP6 STRP grant number 018947 (LSHG-CT-2006-01947) and also received funding from the European Community’s Seventh Framework Program (FP7/2007-2013)/grant agreement HEALTH-F4-2007-201413 by the European Commission under the program “Quality of Life and Management of the Living Resources” of 5th Framework Program (no. QLG2-CT-2002-01254). The ERF study was further supported by ENGAGE consortium and CMSB. High-throughput analysis of the ERF data was supported by joint grant from Netherlands Organization for Scientific Research and the Russian Foundation for Basic Research (NWO-RFBR 047.017.043). The authors are grateful to all study participants and their relatives, general practitioners, and neurologists for their contributions and to P. Veraart for her help in genealogy, J. Vergeer for the supervision of the laboratory work.
Rotterdam Study (RS): The Rotterdam Study has been approved by the Medical Ethics Committee of the Erasmus MC and by the Ministry of Health, Welfare and Sport of the Netherland, implementing the Wet Bevolkingsonderzoek: ERGO (Population Studies Act: Rotterdam Study). All participants provided written informed consent to participate in the study and to obtain information from their treating physicians. The Rotterdam Study is supported by the Erasmus MC University Medical Center and Erasmus University Rotterdam; The Netherlands Organisation for Scientific Research (NWO); The Netherlands Organisation for Health Research and Development (ZonMw); the Research Institute for Diseases in the Elderly (RIDE); The Netherlands Genomics Initiative (NGI); the Ministry of Education, Culture and Science; the Ministry of Health, Welfare and Sports; the European Commission (DG XII); and the Municipality of Rotterdam. The contribution of inhabitants, general practitioners and pharmacists of the Ommoord district to the Rotterdam Study is gratefully acknowledged. A.D. is supported by a Veni grant (2015) from ZonMw.
The study sponsors had no role in the study design, the collection, analysis and interpretation of data, the writing of the report, or the decision to submit the article for publication.
J.B.T. reports investigator-initiated research support from Eli Lilly unrelated to the work reported here. H.Z. is a salaried employee of Sanofi. G.D., K.K., and T.K. are employed by Biocrates Life Sciences AG. These authors have no other financial relationships relevant to this article to disclose. J.Q.T. may accrue revenue in the future on patents submitted by the University of Pennsylvania wherein he is a coinventor and he received revenue from the sale of Avid to Eli Lily as a coinventor on imaging-related patents submitted by the University of Pennsylvania. L.M.S. receives research funding from NIH (U01 AG024904; R01 MH 098260; R01 AG 046171; 1RF AG 051550); MJFox Foundation for PD Research (BioFIND) and is a consultant for Eli Lilly; Novartis; Roche; he provides QC oversight for the AlzBio3 immunoassay (Fujirebio) and for the Roche Elecsys immunoassay as part of responsibilities for the ADNI study. A.J.S. reports investigator-initiated research support from Eli Lilly unrelated to the work reported here. He has received consulting fees and travel expenses from Eli Lilly and Siemens Healthcare and is a consultant to Arkley BioTek. He also receives support from Springer publishing as a editor in chief of Brain Imaging and Behavior. M.W.W. reports stock/stock options from Elan, Synarc, travel expenses from Novartis, Tohoku University, Fundacio Ace, Travel eDreams, MCI Group, NSAS, Danone Trading, ANT Congress, NeuroVigil, CHRU-Hopital Roger Salengro, Siemens, AstraZeneca, Geneva University Hospitals, Lilly, University of California, San Diego–ADNI, Paris University, Institut Catala de Neurociencies Aplicades, University of New Mexico School of Medicine, Ipsen, Clinical Trials on Alzheimer’s Disease, Pfizer, AD PD meeting. P.M.D. has received advisory fees from Avid/Lilly, Anthrotonix, Muses Labs, AstraZeneca, Abbvie, Baxter, Cognoptix, Lundbeck/Takeda, Piramal, Genomind, Sonexa, Targacept, Danone, Neurocog Trials, EnVivo, T3D Therapeutics. P.M.D. has received research grants (through Duke University) from Elan, Avid/Lilly, Janssen, Pfizer/Medivation, Neuronetrix, Forum, Alzheimer’s Drug Discovery Foundation. P.M.D. has received fees for lecture from Lundbeck and Alzheimer’s Association and for developing educational materials from Physicians Postgraduate Press. P.M.D. owns shares or options in Maxwell Health, Muses Labs, Anthrotronix, Evidation, Turtle Shell Technologies, and Advera Health Analytics whose products are not discussed here. P.M.D. has received travel funds from Biogen. He is a coinventor on a use patent for metabolomics in Alzheimer’s (through Duke University) that is unlicensed and he receives no royalties on this. R.K.D. is a inventor on key patents in the field of metabolomics including applications for Alzheimer disease.
Footnotes
All other authors report no disclosures.
Supplementary data: Supplementary data related to this article can be found at http://dx.doi.org/10.1016/j.jalz.2017.01.020.
References
- 1.Citron M. Alzheimer’s disease: strategies for disease modification. Nat Rev Drug Discov. 2010;9:387–98. doi: 10.1038/nrd2896. [DOI] [PubMed] [Google Scholar]
- 2.Cai H, Cong WN, Ji S, Rothman S, Maudsley S, Martin B. Metabolic dysfunction in Alzheimer’s disease and related neurodegenerative disorders. Curr Alzheimer Res. 2012;9:5–17. doi: 10.2174/156720512799015064. [DOI] [PMC free article] [PubMed] [Google Scholar]
- 3.de la Monte SM, Tong M. Brain metabolic dysfunction at the core of Alzheimer’s disease. Biochem Pharmacol. 2014;88:548–59. doi: 10.1016/j.bcp.2013.12.012. [DOI] [PMC free article] [PubMed] [Google Scholar]
- 4.Procaccini C, Santopaolo M, Faicchia D, Colamatteo A, Formisano L, de Candia P, et al. Role of metabolism in neurodegenerative disorders. Metabolism. 2016;65:1376–90. doi: 10.1016/j.metabol.2016.05.018. [DOI] [PubMed] [Google Scholar]
- 5.Chen Z, Zhong C. Decoding Alzheimer’s disease from perturbed cerebral glucose metabolism: implications for diagnostic and therapeutic strategies. Prog Neurobiol. 2013;108:21–43. doi: 10.1016/j.pneurobio.2013.06.004. [DOI] [PubMed] [Google Scholar]
- 6.Patti GJ, Yanes O, Siuzdak G. Innovation: metabolomics: the apogee of the omics trilogy. Nat Rev Mol Cell Biol. 2012;13:263–9. doi: 10.1038/nrm3314. [DOI] [PMC free article] [PubMed] [Google Scholar]
- 7.Kaddurah-Daouk R, Krishnan KR. Metabolomics: a global biochemical approach to the study of central nervous system diseases. Neuropsychopharmacology. 2009;34:173–86. doi: 10.1038/npp.2008.174. [DOI] [PubMed] [Google Scholar]
- 8.Kaddurah-Daouk R, Weinshilboum R. Metabolomic signatures for drug response phenotypes: pharmacometabolomics enables precision medicine. Clin Pharmacol Ther. 2015;98:71–5. doi: 10.1002/cpt.134. [DOI] [PMC free article] [PubMed] [Google Scholar]
- 9.Kaddurah-Daouk R, Weinshilboum RM. Pharmacometabolomics: implications for clinical pharmacology and systems pharmacology. Clin Pharmacol Ther. 2014;95:154–67. doi: 10.1038/clpt.2013.217. [DOI] [PubMed] [Google Scholar]
- 10.Han X, Rozen S, Boyle SH, Hellegers C, Cheng H, Burke JR, et al. Me-tabolomics in early Alzheimer’s disease: identification of altered plasma sphingolipidome using shotgun lipidomics. PLoS One. 2011;6:e21643. doi: 10.1371/journal.pone.0021643. [DOI] [PMC free article] [PubMed] [Google Scholar]
- 11.Casanova R, Varma S, Simpson B, Kim M, An Y, Saldana S, et al. Blood metabolite markers of preclinical Alzheimer’s disease in two longitudinally followed cohorts of older individuals. Alzheimers Dement. 2016;12:815–22. doi: 10.1016/j.jalz.2015.12.008. [DOI] [PMC free article] [PubMed] [Google Scholar]
- 12.Fiandaca MS, Zhong X, Cheema AK, Orquiza MH, Chidambaram S, Tan MT, et al. Plasma 24-metabolite panel predicts preclinical transition to clinical stages of Alzheimer’s disease. Front Neurol. 2015;6:237. doi: 10.3389/fneur.2015.00237. [DOI] [PMC free article] [PubMed] [Google Scholar]
- 13.Klavins K, Koal T, Dallmann G, Marksteiner J, Kemmler G, Humpel C. The ratio of phosphatidylcholines to lysophosphatidylcholines in plasma differentiates healthy controls from patients with Alzheimer’s disease and mild cognitive impairment. Alzheimers Dement (Amst) 2015;1:295–302. doi: 10.1016/j.dadm.2015.05.003. [DOI] [PMC free article] [PubMed] [Google Scholar]
- 14.Koal T, Klavins K, Seppi D, Kemmler G, Humpel C. Sphingomyelin SM(d18:1/18:0) is significantly enhanced in cerebrospinal fluid samples dichotomized by pathological amyloid-beta42, tau, and phospho-tau-181 levels. J Alzheimers Dis. 2015;44:1193–201. doi: 10.3233/JAD-142319. [DOI] [PMC free article] [PubMed] [Google Scholar]
- 15.Mapstone M, Cheema AK, Fiandaca MS, Zhong X, Mhyre TR, MacArthur LH, et al. Plasma phospholipids identify antecedent memory impairment in older adults. Nat Med. 2014;20:415–8. doi: 10.1038/nm.3466. [DOI] [PMC free article] [PubMed] [Google Scholar]
- 16.Motsinger-Reif AA, Zhu H, Kling MA, Matson W, Sharma S, Fiehn O, et al. Comparing metabolomic and pathologic biomarkers alone and in combination for discriminating Alzheimer’s disease from normal cognitive aging. Acta Neuropathol Commun. 2013;1:28. doi: 10.1186/2051-5960-1-28. [DOI] [PMC free article] [PubMed] [Google Scholar]
- 17.Kaddurah-Daouk R, Rozen S, Matson W, Han X, Hulette CM, Burke JR, et al. Metabolomic changes in autopsy-confirmed Alz-heimer’s disease. Alzheimers Dement. 2011;7:309–17. doi: 10.1016/j.jalz.2010.06.001. [DOI] [PMC free article] [PubMed] [Google Scholar]
- 18.Kaddurah-Daouk R, Zhu H, Sharma S, Bogdanov M, Rozen SG, Matson W, et al. Alterations in metabolic pathways and networks in Alzheimer’s disease. Transl Psychiatry. 2013;3:e244. doi: 10.1038/tp.2013.18. [DOI] [PMC free article] [PubMed] [Google Scholar]
- 19.Gonzalez-Dominguez R, Garcia-Barrera T, Vitorica J, Gomez-Ariza JL. Metabolomic investigation of systemic manifestations associated with Alzheimer’s disease in the APP/PS1 transgenic mouse model. Mol Biosyst. 2015;11:2429–40. doi: 10.1039/c4mb00747f. [DOI] [PubMed] [Google Scholar]
- 20.Soltow QA, Jones DP, Promislow DE. A network perspective on metabolism and aging. Integr Comp Biol. 2010;50:844–54. doi: 10.1093/icb/icq094. [DOI] [PMC free article] [PubMed] [Google Scholar]
- 21.Simpson BN, Kim M, Chuang YF, Beason-Held L, Kitner-Triolo M, Kraut M, et al. Blood metabolite markers of cognitive performance and brain function in aging. J Cereb Blood Flow Metab. 2016;36:1212–23. doi: 10.1177/0271678X15611678. [DOI] [PMC free article] [PubMed] [Google Scholar]
- 22.Han X, Holtzman DM, McKeel DW., Jr Plasmalogen deficiency in early Alzheimer’s disease subjects and in animal models: molecular characterization using electrospray ionization mass spectrometry. J Neurochem. 2001;77:1168–80. doi: 10.1046/j.1471-4159.2001.00332.x. [DOI] [PubMed] [Google Scholar]
- 23.Wood PL, Smith T, Lane N, Khan MA, Ehrmantraut G, Goodenowe DB. Oral bioavailability of the ether lipid plasmalogen precursor, PPI-1011, in the rabbit: a new therapeutic strategy for Alzheimer’s disease. Lipids Health Dis. 2011;10:227. doi: 10.1186/1476-511X-10-227. [DOI] [PMC free article] [PubMed] [Google Scholar]
- 24.Ibanez C, Simo C, Martin-Alvarez PJ, Kivipelto M, Winblad B, Cedazo-Minguez A, et al. Toward a predictive model of Alzheimer’s disease progression using capillary electrophoresis-mass spectrometry metabolomics. Anal Chem. 2012;84:8532–40. doi: 10.1021/ac301243k. [DOI] [PubMed] [Google Scholar]
- 25.Trushina E, Dutta T, Persson XM, Mielke MM, Petersen RC. Identification of altered metabolic pathways in plasma and CSF in mild cognitive impairment and Alzheimer’s disease using metabolomics. PLoS One. 2013;8:e63644. doi: 10.1371/journal.pone.0063644. [DOI] [PMC free article] [PubMed] [Google Scholar]
- 26.Li D, Misialek JR, Boerwinkle E, Gottesman RF, Sharrett AR, Mosley TH, et al. Plasma phospholipids and prevalence of mild cognitive impairment and/or dementia in the ARIC Neurocognitive Study (ARIC-NCS) Alzheimers Dement (Amst) 2016;3:73–82. doi: 10.1016/j.dadm.2016.02.008. [DOI] [PMC free article] [PubMed] [Google Scholar]
- 27.Savica R, Murray ME, Persson XM, Kantarci K, Parisi JE, Dickson DW, et al. Plasma sphingolipid changes with autopsy-confirmed Lewy Body or Alzheimer’s pathology. Alzheimers Dement (Amst) 2016;3:43–50. doi: 10.1016/j.dadm.2016.02.005. [DOI] [PMC free article] [PubMed] [Google Scholar]
- 28.Pan X, Nasaruddin MB, Elliott CT, McGuinness B, Passmore AP, Kehoe PG, et al. Alzheimer’s disease-like pathology has transient effects on the brain and blood metabolome. Neurobiol Aging. 2016;38:151–63. doi: 10.1016/j.neurobiolaging.2015.11.014. [DOI] [PubMed] [Google Scholar]
- 29.Santiago JA, Potashkin JA. A network approach to clinical intervention in neurodegenerative diseases. Trends Mol Med. 2014;20:694–703. doi: 10.1016/j.molmed.2014.10.002. [DOI] [PubMed] [Google Scholar]
- 30.Jack CR, Jr, Holtzman DM. Biomarker modeling of Alzheimer’s disease. Neuron. 2013;80:1347–58. doi: 10.1016/j.neuron.2013.12.003. [DOI] [PMC free article] [PubMed] [Google Scholar]
- 31.Weiner MW, Veitch DP, Aisen PS, Beckett LA, Cairns NJ, Cedarbaum J, et al. Impact of the Alzheimer’s Disease Neuroimaging Initiative, 2004 to 2014. Alzheimers Dement. 2015;11:865–84. doi: 10.1016/j.jalz.2015.04.005. [DOI] [PMC free article] [PubMed] [Google Scholar]
- 32.Draisma HH, Pool R, Kobl M, Jansen R, Petersen AK, Vaarhorst AA, et al. Genomewide association study identifies novel genetic variants contributing to variation in blood metabolite levels. Nat Commun. 2015;6:7208. doi: 10.1038/ncomms8208. [DOI] [PMC free article] [PubMed] [Google Scholar]
- 33.Wurtz P, Havulinna AS, Soininen P, Tynkkynen T, Prieto-Merino D, Tillin T, et al. Metabolite profiling and cardiovascular event risk: a prospective study of 3 population-based cohorts. Circulation. 2015;131:774–85. doi: 10.1161/CIRCULATIONAHA.114.013116. [DOI] [PMC free article] [PubMed] [Google Scholar]
- 34.Ikram MA, van der Lugt A, Niessen WJ, Koudstaal PJ, Krestin GP, Hofman A, et al. The Rotterdam Scan Study: design update 2016 and main findings. Eur J Epidemiol. 2015;30:1299–315. doi: 10.1007/s10654-015-0105-7. [DOI] [PMC free article] [PubMed] [Google Scholar]
- 35.Liu F, Pardo LM, Schuur M, Sanchez-Juan P, Isaacs A, Sleegers K, et al. The apolipoprotein E gene and its age-specific effects on cognitive function. Neurobiol Aging. 2010;31:1831–3. doi: 10.1016/j.neurobiolaging.2008.09.015. [DOI] [PubMed] [Google Scholar]
- 36.Hoogendam YY, Hofman A, van der Geest JN, van der Lugt A, Ikram MA. Patterns of cognitive function in aging: the Rotterdam Study. Eur J Epidemiol. 2014;29:133–40. doi: 10.1007/s10654-014-9885-4. [DOI] [PubMed] [Google Scholar]
- 37.de Bruijn RF, Bos MJ, Portegies ML, Hofman A, Franco OH, Koudstaal PJ, et al. The potential for prevention of dementia across two decades: the prospective, population-based Rotterdam Study. BMC Med. 2015;13:132. doi: 10.1186/s12916-015-0377-5. [DOI] [PMC free article] [PubMed] [Google Scholar]
- 38.Davies G, Armstrong N, Bis JC, Bressler J, Chouraki V, Giddaluru S, et al. Genetic contributions to variation in general cognitive function: a meta-analysis of genomewide association studies in the CHARGE consortium (N=53949) Mol Psychiatry. 2015;20:183–92. doi: 10.1038/mp.2014.188. [DOI] [PMC free article] [PubMed] [Google Scholar]
- 39.Risacher SL, Wudunn D, Pepin SM, MaGee TR, McDonald BC, Flashman LA, et al. Visual contrast sensitivity in Alzheimer’s disease, mild cognitive impairment, and older adults with cognitive complaints. Neurobiol Aging. 2013;34:1133–44. doi: 10.1016/j.neurobiolaging.2012.08.007. [DOI] [PMC free article] [PubMed] [Google Scholar]
- 40.Wang Y, Risacher SL, West JD, McDonald BC, Magee TR, Farlow MR, et al. Altered default mode network connectivity in older adults with cognitive complaints and amnestic mild cognitive impairment. J Alzheimers Dis. 2013;35:751–60. doi: 10.3233/JAD-130080. [DOI] [PMC free article] [PubMed] [Google Scholar]
- 41.Kim S, Swaminathan S, Inlow M, Risacher SL, Nho K, Shen L, et al. Influence of genetic variation on plasma protein levels in older adults using a multi-analyte panel. PLoS One. 2013;8:e70269. doi: 10.1371/journal.pone.0070269. [DOI] [PMC free article] [PubMed] [Google Scholar]
- 42.Ramanan VK, Risacher SL, Nho K, Kim S, Shen L, McDonald BC, et al. GWAS of longitudinal amyloid accumulation on 18F-florbetapir PET in Alzheimer’s disease implicates microglial activation gene IL1-RAP. Brain. 2015;138:3076–88. doi: 10.1093/brain/awv231. [DOI] [PMC free article] [PubMed] [Google Scholar]
- 43.Klunk WE, Engler H, Nordberg A, Wang Y, Blomqvist G, Holt DP, et al. Imaging brain amyloid in Alzheimer’s disease with Pittsburgh Compound-B. Ann Neurol. 2004;55:306–19. doi: 10.1002/ana.20009. [DOI] [PubMed] [Google Scholar]
- 44.Landau SM, Breault C, Joshi AD, Pontecorvo M, Mathis CA, Jagust WJ, et al. Amyloid-beta imaging with Pittsburgh compound B and florbetapir: comparing radiotracers and quantification methods. J Nucl Med. 2013;54:70–7. doi: 10.2967/jnumed.112.109009. [DOI] [PMC free article] [PubMed] [Google Scholar]
- 45.Kang JH, Korecka M, Figurski MJ, Toledo JB, Blennow K, Zetterberg H, et al. The Alzheimer’s Disease Neuroimaging Initiative 2 Biomarker Core: a review of progress and plans. Alzheimers Dement. 2015;11:772–91. doi: 10.1016/j.jalz.2015.05.003. [DOI] [PMC free article] [PubMed] [Google Scholar]
- 46.Shaw LM, Vanderstichele H, Knapik-Czajka M, Clark CM, Aisen PS, Petersen RC, et al. Cerebrospinal fluid biomarker signature in Alz-heimer’s disease neuroimaging initiative subjects. Ann Neurol. 2009;65:403–13. doi: 10.1002/ana.21610. [DOI] [PMC free article] [PubMed] [Google Scholar]
- 47.Reuter M, Schmansky NJ, Rosas HD, Fischl B. Within-subject template estimation for unbiased longitudinal image analysis. Neuroimage. 2012;61:1402–18. doi: 10.1016/j.neuroimage.2012.02.084. [DOI] [PMC free article] [PubMed] [Google Scholar]
- 48.Fan Y, Shen D, Gur RC, Gur RE, Davatzikos C. COMPARE: classification of morphological patterns using adaptive regional elements. IEEE Trans Med Imaging. 2007;26:93–105. doi: 10.1109/TMI.2006.886812. [DOI] [PubMed] [Google Scholar]
- 49.Toledo JB, Da X, Bhatt P, Wolk DA, Arnold SE, Shaw LM, et al. Relationship between plasma analytes and SPARE-AD defined brain atrophy patterns in ADNI. PLoS One. 2013;8:e55531. doi: 10.1371/journal.pone.0055531. [DOI] [PMC free article] [PubMed] [Google Scholar]
- 50.Rmetrics Core Team. Wuertz D, Setz T, Chalabi Y. fBasics: Rmetrics-Markets and Basic Statistics. R package version. 2014 [Google Scholar]
- 51.D’Agostino R, Pearson ES. Tests for departure from normality. Biometrika. 1973;60:613–22. [Google Scholar]
- 52.Pinheiro JC, Bates DM. Mixed-effects Models in S and S-PLUS. New York: Springer Verlag; 2000. [Google Scholar]
- 53.R Core Team. R: A Language and Environment for Statistical Computing. Vienna, Austria: R Foundation for Statistical Computing; 2015. [Google Scholar]
- 54.Langfelder P, Horvath S. WGCNA: an R package for weighted correlation network analysis. BMC Bioinformatics. 2008;9:559. doi: 10.1186/1471-2105-9-559. [DOI] [PMC free article] [PubMed] [Google Scholar]
- 55.Krumsiek J, Suhre K, Illig T, Adamski J, Theis FJ. Gaussian graphical modeling reconstructs pathway reactions from high-throughput metabolomics data. BMC Syst Biol. 2011;5:21. doi: 10.1186/1752-0509-5-21. [DOI] [PMC free article] [PubMed] [Google Scholar]
- 56.Mittelstrass K, Ried JS, Yu Z, Krumsiek J, Gieger C, Prehn C, et al. Discovery of sexual dimorphisms in metabolic and genetic biomarkers. PLoS Genet. 2011;7:e1002215. doi: 10.1371/journal.pgen.1002215. [DOI] [PMC free article] [PubMed] [Google Scholar]
- 57.Krumsiek J, Suhre K, Evans AM, Mitchell MW, Mohney RP, Milburn MV, et al. Mining the unknown: a systems approach to metabolite identification combining genetic and metabolic information. PLoS Genet. 2012;8:e1003005. doi: 10.1371/journal.pgen.1003005. [DOI] [PMC free article] [PubMed] [Google Scholar]
- 58.Jack CR, Jr, Albert MS, Knopman DS, McKhann GM, Sperling RA, Carrillo MC, et al. Introduction to the recommendations from the National Institute on Aging-Alzheimer’s Association workgroups on diagnostic guidelines for Alzheimer’s disease. Alzheimers Dement. 2011;7:257–62. doi: 10.1016/j.jalz.2011.03.004. [DOI] [PMC free article] [PubMed] [Google Scholar]
- 59.Toledo JB, Brettschneider J, Grossman M, Arnold SE, Hu WT, Xie SX, et al. CSF biomarkers cutoffs: the importance of coincident neuropathological diseases. Acta Neuropathol. 2012;124:23–35. doi: 10.1007/s00401-012-0983-7. [DOI] [PMC free article] [PubMed] [Google Scholar]
- 60.Frisardi V, Panza F, Seripa D, Farooqui T, Farooqui AA. Glycerophospholipids and glycerophospholipid-derived lipid mediators: a complex meshwork in Alzheimer’s disease pathology. Prog Lipid Res. 2011;50:313–30. doi: 10.1016/j.plipres.2011.06.001. [DOI] [PubMed] [Google Scholar]
- 61.Perttu EK, Kohli AG, Szoka FC., Jr Inverse-phosphocholine lipids: a remix of a common phospholipid. J Am Chem Soc. 2012;134:4485–8. doi: 10.1021/ja210989h. [DOI] [PMC free article] [PubMed] [Google Scholar]
- 62.Braverman NE, Moser AB. Functions of plasmalogen lipids in health and disease. Biochim Biophys Acta. 2012;1822:1442–52. doi: 10.1016/j.bbadis.2012.05.008. [DOI] [PubMed] [Google Scholar]
- 63.Fonteh AN, Ormseth C, Chiang J, Cipolla M, Arakaki X, Harrington MG. Sphingolipid metabolism correlates with cerebrospinal fluid Beta amyloid levels in Alzheimer’s disease. PLoS One. 2015;10:e0125597. doi: 10.1371/journal.pone.0125597. [DOI] [PMC free article] [PubMed] [Google Scholar]
- 64.Gross RW. High plasmalogen and arachidonic acid content of canine myocardial sarcolemma: a fast atom bombardment mass spectroscopic and gas chromatography-mass spectroscopic characterization. Biochemistry. 1984;23:158–65. doi: 10.1021/bi00296a026. [DOI] [PubMed] [Google Scholar]
- 65.Heppner FL, Ransohoff RM, Becher B. Immune attack: the role of inflammation in Alzheimer disease. Nat Rev Neurosci. 2015;16:358–72. doi: 10.1038/nrn3880. [DOI] [PubMed] [Google Scholar]
- 66.Rushworth JV, Hooper NM. Lipid rafts: linking Alzheimer’s amyloid-beta production, aggregation, and toxicity at neuronal membranes. Int J Alzheimers Dis. 2010;2011:603052. doi: 10.4061/2011/603052. [DOI] [PMC free article] [PubMed] [Google Scholar]
- 67.Whiley L, Sen A, Heaton J, Proitsi P, Garcia-Gomez D, Leung R, et al. Evidence of altered phosphatidylcholine metabolism in Alzheimer’s disease. Neurobiol Aging. 2014;35:271–8. doi: 10.1016/j.neurobiolaging.2013.08.001. [DOI] [PMC free article] [PubMed] [Google Scholar]
- 68.McCoin CS, Knotts TA, Adams SH. Acylcarnitines–old actors auditioning for new roles in metabolic physiology. Nat Rev Endocrinol. 2015;11:617–25. doi: 10.1038/nrendo.2015.129. [DOI] [PMC free article] [PubMed] [Google Scholar]
- 69.Walter J, van Echten-Deckert G. Cross-talk of membrane lipids and Alzheimer-related proteins. Mol Neurodegener. 2013;8:34. doi: 10.1186/1750-1326-8-34. [DOI] [PMC free article] [PubMed] [Google Scholar]
- 70.Jones LL, McDonald DA, Borum PR. Acylcarnitines: role in brain. Prog Lipid Res. 2010;49:61–75. doi: 10.1016/j.plipres.2009.08.004. [DOI] [PubMed] [Google Scholar]
- 71.Yin F, Yao J, Sancheti H, Feng T, Melcangi RC, Morgan TE, et al. The perimenopausal aging transition in the female rat brain: decline in bioenergetic systems and synaptic plasticity. Neurobiol Aging. 2015;36:2282–95. doi: 10.1016/j.neurobiolaging.2015.03.013. [DOI] [PMC free article] [PubMed] [Google Scholar]
- 72.Stanley M, Macauley SL, Holtzman DM. Changes in insulin and insulin signaling in Alzheimer’s disease: cause or consequence? J Exp Med. 2016;213:1375–85. doi: 10.1084/jem.20160493. [DOI] [PMC free article] [PubMed] [Google Scholar]
- 73.Kling MA, Trojanowski JQ, Wolk DA, Lee VM, Arnold SE. Vascular disease and dementias: paradigm shifts to drive research in new directions. Alzheimers Dement. 2013;9:76–92. doi: 10.1016/j.jalz.2012.02.007. [DOI] [PMC free article] [PubMed] [Google Scholar]
- 74.Floegel A, Stefan N, Yu Z, Muhlenbruch K, Drogan D, Joost HG, et al. Identification of serum metabolites associated with risk of type 2 dia betes using a targeted metabolomic approach. Diabetes. 2013;62:639–48. doi: 10.2337/db12-0495. [DOI] [PMC free article] [PubMed] [Google Scholar]
- 75.Wang TJ, Larson MG, Vasan RS, Cheng S, Rhee EP, McCabe E, et al. Metabolite profiles and the risk of developing diabetes. Nat Med. 2011;17:448–53. doi: 10.1038/nm.2307. [DOI] [PMC free article] [PubMed] [Google Scholar]
- 76.Wang TJ, Ngo D, Psychogios N, Dejam A, Larson MG, Vasan RS, et al. 2-Aminoadipic acid is a biomarker for diabetes risk. J Clin Invest. 2013;123:4309–17. doi: 10.1172/JCI64801. [DOI] [PMC free article] [PubMed] [Google Scholar]
- 77.Kawaguchi T, Nagao Y, Matsuoka H, Ide T, Sata M. Branched-chain amino acid-enriched supplementation improves insulin resistance in patients with chronic liver disease. Int J Mol Med. 2008;22:105–12. [PubMed] [Google Scholar]
- 78.Ruiz HH, Chi T, Lindtner C, Hsieh W, Shin AC, Ehrlich M, et al. Increased susceptibility to metabolic dysregulation in a mouse model of Alzheimer’s disease is associated with impaired hypothalamic insulin signaling and elevated BCAA levels. Alzheimers Dement. 2016;12:851–61. doi: 10.1016/j.jalz.2016.01.008. [DOI] [PMC free article] [PubMed] [Google Scholar]
- 79.Jha SK, Jha NK, Kumar D, Ambasta RK, Kumar P. Linking mitochondrial dysfunction, metabolic syndrome and stress signaling in Neurode-generation. Biochim Biophys Acta. 2016 doi: 10.1016/j.bbadis.2016.06.015. pii: S0925-4439(16)30157-0. [DOI] [PubMed] [Google Scholar]
- 80.Koliaki C, Roden M. Alterations of mitochondrial function and insulin sensitivity in human obesity and diabetes mellitus. Annu Rev Nutr. 2016;36:337–67. doi: 10.1146/annurev-nutr-071715-050656. [DOI] [PubMed] [Google Scholar]
Associated Data
This section collects any data citations, data availability statements, or supplementary materials included in this article.