Abstract
Introduction
Recent evidence suggests that resistance training (RT) may reduce metabolic and cardiovascular disease risk. We investigated whether overweight/class I obese individuals by BMI classification with high strength fitness exhibit cardiovascular/metabolic phenotypes similar to those overweight/obese and untrained or those normal-weight with high strength fitness.
Methods
90 young males were categorized into 3 groups: overweight untrained (OU, n=30, BMI>27 kg/m2), overweight trained (OT, n=30, BMI>27kg/m2, RT≥4 d/wk) and normal-weight trained (NT, n=30, BMI<25kg/m2, RT≥4 d/wk). Participants were assessed for strength, body composition, central/peripheral blood pressures, arterial stiffness, and markers of cardiovascular and metabolic health.
Results
Body weight was similar in OT and OU and greater than NT (P<0.00001), and fat mass was different in all groups (P<0.001). Compared to OU, NT and OT groups exhibited higher relative strength (NT:46.7%;OT:44.4%,P<0.00001) and subendocardial viability ratio (NT:21.0%,P<0.001;OT:17.0%,P<0.01) and lower brachial/central blood pressures (NT:P<0.001;OT:P≤0.05); augmentation index and pulse-wave velocity were lower in only OT (P<0.05). Total-cholesterol, low-density lipoprotein (NT:P<0.01,OT:P<0.05), triglycerides (NT:-50.4%,OT:-41.8%;P<0.001), oxidized LDL (NT:-39.8%,OT:-31.8%;P<0.001) and CRP (NT:-63.7%,OT:-67.4%;P<0.01) levels were lower and high-density lipoprotein (NT:26.9%,OT:21.4%;P<0.001) higher in NT and OT compared to OU. NT and OT also exhibited lower amylin (NT:-55.8%,OT:-40.8%) and leptin (NT:-84.6%,OT:-59.4%) and higher adiponectin (NT:87.5%;P<0.001;OT:78.1%;P<0.01) and sex-hormone binding globulin (NT:124.4%,OT:92.3%;P<0.001). Despite greater total and trunk fat in OT compared with NT, other than glucose and insulin, which were lower in NT than both OT and OU (OT:P<0.01,OU:P<0.001), OT did not exhibit any impaired biomarker/phenotype compared to NT.
Conclusion
These findings provide evidence that overweight/class I obese individuals with high strength fitness exhibit metabolic/cardiovascular risk profiles similar to normal-weight, fit rather than overweight/class I obese unfit individuals. Strength training may be important to metabolic and cardiovascular health.
Keywords: Body composition, strength training, obesity, muscular fitness
INTRODUCTION
Obesity is associated with increased risk of type 2 diabetes (T2D), cardiovascular disease (CVD), metabolic syndrome, fatty liver disease and certain forms of cancer, as well as reduced quality of life and increased mortality (8). At present, more than one-third of U.S. adults remain obese (21). The causes of obesity are complex, and current intervention programs tend to focus on weight loss as a primary means of ameliorating obesity and its co-morbidities (37). However, numerous lifestyle intervention studies have suggested improvements in indices of cardiovascular and metabolic health independent of weight loss or obesity reversal, which questions the notion that body weight is the cause for increased risk of morbidity and mortality. Weight loss as the primary determinant of successful risk-factor modification is not well-supported from either a biological or behavioral perspective (33). For example, weight-loss focused interventions face a high rate of recidivism (3), mediated by a myriad of causes for weight loss variability and weight regain (32).
Although it is recognized that higher levels of adiposity are correlated with increased mortality, higher levels of fitness attenuate this association. Specifically, cardiorespiratory fit and obese (by body composition) individuals have approximately a 50% lower mortality risk compared to lean and unfit individuals (17). McAuley et al. (18) noted that among men with high cardiorespiratory fitness, across BMI, waist circumference and percent body fat categories, there were no significant differences in CVD and all-cause mortality risk, and Lee et al. (17) noted smaller differences in mortality risk due to body composition than to fitness levels. Recent estimates suggest that overweight and class I obese individuals exhibit similar rates of mortality, compared with normal-weight subjects (8). Thus, the relationship between BMI and mortality is complex and may be influenced by other lifestyle factors, including fitness/training status.
Resistance training (RT) has gained more attention recently for its capacity to increase lean body mass and improve body composition and glucose tolerance (27). Performing RT and increasing muscular strength has been demonstrated to lower the risk for metabolic syndrome (13), CVD (36) and overall mortality (34). Ortega et al. (23) recently noted that over a 24-year follow-up of males 16-19 years old with initially high levels of hand grip and knee-extension strength had a 20-35% lower risk of mortality due to CVD, independent of BMI.
As young individuals are at low risk of mortality, phenotypes associated with disease risk are used as surrogates of health. Thus, the present cross-sectional study was designed to investigate whether overweight/class I obese individuals exhibiting high muscular strength display cardiovascular/metabolic phenotypes similar to overweight/class I obese, untrained individuals or normal-weight individuals with high strength fitness. We recruited 90 young adult men separated into one of three phenotypes characterized by BMI (classified as a categorical variable to compare with existing guidelines) and strength fitness status: normal-weight strength-trained (NT), overweight strength-trained (OT), and overweight untrained (OU). We measured cardiometabolic health phenotypes, including central and brachial blood pressures, indices of arterial stiffness, serum lipids, inflammatory and metabolic markers, and steroid hormones. We hypothesized that: 1) the strength-trained groups, NT and OT, would display better metabolic and cardiovascular phenotypes compared to the OU group; and 2) the strength-trained groups with similar strength fitness levels, would exhibit similar metabolic and cardiovascular phenotypes, irrespective of lower body weight, total and trunk fat mass in the NT group.
METHODS
Study Participants
In this cross-sectional study, 90 young adult men, ages 18-30 yrs completed informed consent, were enrolled and categorized into three phenotypes based on training status from screening questions and body mass index (BMI). Subjects were eligible for inclusion in strength-trained groups if they performed a minimum of 4 days/wk of structured RT. OU participants participated in only light physical activity ≤2 times/wk and were not in any structured exercise program. Group classifications were as follows: normal-weight trained (NT, n=30, ≥4 d/wk RT, BMI<25kg/m2), overweight trained (OT, n=30, ≥4 d/wk RT, BMI>27 kg/m2) and overweight untrained (OU, n=30, no structured exercise program, BMI>27 kg/m2). Any participants with overt chronic disease symptoms, as indicated by screening and health history assessment were excluded from the study. Potential participants were excluded if they had documented CVD, cardiac arrhythmia or electrocardiogram (EKG) not allowing arterial stiffness indices assessment, history of tobacco use or medications that influence cardiovascular function, body composition or insulin indices in the prior 6 months. All of the study protocols were approved by the University of California, Los Angeles (UCLA) Institutional Review Board and were performed according to the Declaration of Helsinki.
Outpatient Visit Procedures
All testing was carried out during a single visit. Prior to this visit, participants were reminded by phone and email to abstain from the consumption of food, caffeine, alcohol and vitamin supplements for at least 12 hours prior to testing. They also did not engage in any moderate to vigorous physical activity within 36 hours of the visit. Upon arrival, participants underwent an ordered set of outpatient procedures. Height and weight (for BMI) and waist circumference were measured twice and averaged. Following this, body composition was determined by dual energy x-ray absorptiometry (DXA) scan (Hologic QDR4500 Fan Beam X-ray Densitometer, Hologic, Inc. Waltham, MA) prior to measurements of carotid intima-media thickness (cIMT) and arterial stiffness. Participants underwent a blood draw and serum and plasma samples were stored at −80°C for subsequent analysis as described below. In all participants, vascular assessments were carried out prior to venipuncture to avoid any sympathetic responses due to discomfort related to the blood draw. Participants also completed an International Physical Activity Questionnaire (IPAQ-self-administered, long form) to quantify the amount of routine physical activity performed in the week prior to the assessment. Activity-specific (moderate, vigorous, or total activity) scores were calculated as continuous variables of metabolic equivalent task (MET)*minutes per week.
Muscular Strength Testing
Maximal strength testing of 1-repetition maximum (1-RM) lifts for barbell bench press, 45° incline leg press, and machine-seated row were carried out as previously described (2). Relative strength was calculated as the sum of 1-RM strength values (in kg) divided by subject body weight (in kg).
Arterial Tonometry and Carotid Intima-Media Thickness
Assessment of central systolic (cSBP) and diastolic (cDBP) and peripheral (brachial) systolic (bSBP) and diastolic (bDBP) blood pressures and indices of arterial stiffness (augmentation index (AIx), sub-endocardial viability ratio (SEVR, the ratio of the pressure-time integral during diastole (diastolic pressure time index) to pressure-time integral during systole (tension time index), and used as an index of cardiac perfusion) and carotid-femoral pulse wave velocity (PWV)) were determined noninvasively with the SphygmoCor system (AtCor Medical, Sydney, Australia) (16) as previously described (1). Carotid intima-media thickness (IMT) was determined as previously described (1). In brief, 2D ultrasound images of the carotid artery were obtained using a 12MHz linear array transducer and data were digitally recorded on an external computer for offline analysis. Automated edge detection software (Medical Imaging Applications, Iowa) was utilized to measure the carotid artery diameter (intima-intima) and cIMT of both sides at approximately 1 cm distal to the carotid bulb.
Blood Chemistry Assays
Samples were assayed for total cholesterol, high-density lipoprotein (HDL), non-HDL cholesterol and triglycerides (TG) using the Olympus AU400 Chemistry Analyzer. Low-density lipoprotein (LDL) was calculated using the Friedewald equation (9). Serum glucose was assayed via the hexokinase method (Olympus AU400 Chemistry Immuno Analyzer, Olympus America, Center Valley, PA, USA). Serum insulin was measured by means of solid-phase, enzyme-labeled chemiluminescent immunometric assay (Immulite® 2000, Diagnostic Products Corp., Los Angeles, CA). Quantitative insulin-sensitivity check index (QUICKI) was calculated by the formula 1/(log(fasting insulin (μU/mL)) * log(fasting glucose (mg/dL)) and homeostatic model assessment (HOMA) by (fasting insulin (μU/mL) * fasting glucose (mg/dL))/405.
High-sensitivity C-reactive protein (CRP, by Alpco, Salem, NH, USA) and oxidized LDL (oxLDL) (Mercodia Laboratories, Upsala, Sweden) concentrations were determined by enzyme-linked immunosorbent assay (ELISA). Interleukin (IL)-8, tumor necrosis factor-α (TNF-α), vascular endothelial growth factor (VEGF), matrix metalloproteinase-9 (MMP-9), myeloperoxidase (MPO), total plasminogen activator inhibitor-1 (PAI-1), soluble E-selectin (sE-selectin), soluble intercellular adhesion molecule-1 (sICAM-1), soluble vascular cell adhesion molecule-1 (sVCAM-1), monocyte chemotactic protein-1 (MCP-1), leptin, and total amylin were determined using Millipore Multiplex assays (Billerica, MA, USA). Adiponectin was determined by ELISA (R&D Systems, Minneapolis, MN). Plasma levels of sex hormone binding globulin (SHBG), cortisol and testosterone were measured by an electrochemiluminescent immunoassay on an Elecsys 2010 autoanalyzer (Roche Diagnostics, Indianapolis, IN). Free testosterone was calculated via Sodergard method (35). Free androgen index (FAI) was calculated by 100*(Total Testosterone/SHBG).
Statistical Analyses
Robust measures of statistical significance were obtained by running a Monte Carlo permutation for each respective test statistic (e.g. F-statistic) 10,000 times from which a test for significance was obtained at an alpha value of <0.05 using 1-way ANOVA analyses. Permutation analyses were used to avoid making any assumptions on the distribution of the data. Post-hoc permuted t-tests were used to test significance between groups. To investigate the associations of adiposity and strength with phenotypic variables, exploratory pairwise correlation analyses were performed between outcome variables (total and trunk fat, body fat percentage, and relative strength) and these variables, and corrected using Bonferroni to an alpha value of ≤0.001. The results were similar for all fat mass variables, and body fat percentage correlations were reported. Statistical analyses were performed with the use of STATA Statistical Software 12 (StataCorp LP, College Station, TX). Data are reported as mean (standard deviation).
RESULTS
Body Composition, Strength and Physical Activity
Comparison of body composition, muscular strength and physical activity are depicted in Table 1. NT exhibited lower waist circumference, trunk fat and total fat mass (Figure 1A) compared to OT and OU (all P<0.001). Additionally, OT and OU presented no significant differences in weight or BMI, but OT presented lower waist circumference, trunk fat and total fat mass (Figure 1A) compared to OU (all P<0.001). NT and OT exhibited higher 1RM strength for bench press and seated row, compared to OU (all P<0.0001). OT demonstrated the highest strength in the leg press, while NT and OU exhibited no differences. A relative strength score was calculated from chest, leg and row 1-RM and found to be higher in OT and NT groups compared to OU (P<0.0001, Figure 1B) and data was similar when relative strength was determined from lean body mass rather than body weight (data not shown). IPAQ confirmed that NT and OT engaged in more vigorous exercise compared to OU (P<0.0001).
Table 1. Body Composition, Strength and Physical Activity.
Data for NT, OT, and OU groups reported as mean (SD).
| Outcomes | NT | OT | OU | P-Value |
|---|---|---|---|---|
| Age (yrs) | 23 (2.9) | 22 (2.7) | 22 (2.1) | 0.25 |
| Height (m) | 1.8 (0.1) | 1.8 (0.1) | 1.8 (0.1) | 0.12 |
| Weight (kg) | 74.1 (7.2) | 94.1 (12.3)¶ | 95.0 (9.2)¶ | <0.00001 |
| BMI (kg/m2) | 23.7 (1.4) | 29.2 (2.2)¶ | 30.8 (2.1)¶ | <0.00001 |
| WC (cm) | 80.2 (4.3) | 91.5 (7.9)¶ | 102.0 (7.3)¶‡ | <0.00001 |
| Trunk Fat (kg) | 3.9 (1.1) | 7.8 (3.6)* | 13.4 (3.4)¶‡ | <0.00001 |
| Total Fat (%) | 13.2 (2.6) | 18.0 (5.0)* | 27.8 (4.0)¶‡ | <0.00001 |
| Total Lean (kg) | 64.2 (6.3) | 76.8 (7.5)¶ | 68.4 (6.2)‡ | <0.00001 |
| 1RM Chest (kg) | 98.4 (15.4) | 121.9 (29.8)* | 71.7 (17.0)¶‡ | <0.00001 |
| 1RM Leg (kg) | 289.8 (49.8) | 365.4 (78.5)¶ | 270.9 (48.7)‡ | <0.00001 |
| 1RM Row (kg) | 101.8 (14.0) | 115.4 (17.9)∆ | 79.6 (13.5)¶‡ | <0.00001 |
| Moderate (MET*min/wk) | 744.0 (840.0) | 702.0 (943.0) | 903.0 (1909.0) | 0.87 |
| Vigorous (MET*min/wk) | 2104.8 (1369.9) | 2124.2 (2160.0) | 1189.7 (1321.9)¶‡ | 0.0001 |
| Total (MET*min/wk) | 4945.5 (3392.9) | 5386.1 (3909.6) | 2999.9 (3750.6)∆# | 0.03 |
P<0.001 NT vs. OT or OU.
P<0.01 NT vs. OT or OU.
P<0.05 NT vs. OT or OU.
P<0.001 OU vs. OT.
P<0.01 OU vs. OT.
P<0.05 OU vs. OT.
BMI: body mass index; WC: waist circumference; 1 RM: 1 repetition maximum; MET: metabolic equivalent of task; Total: sum of all activity.
Figure 1.
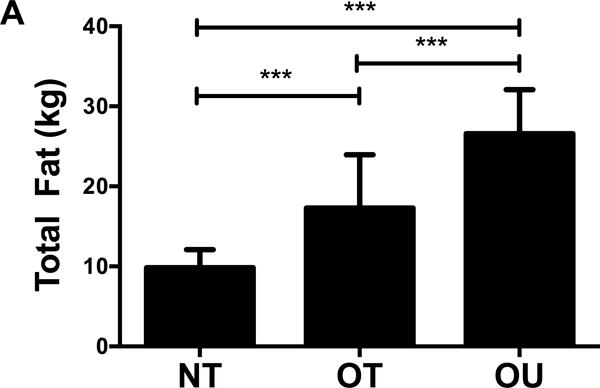
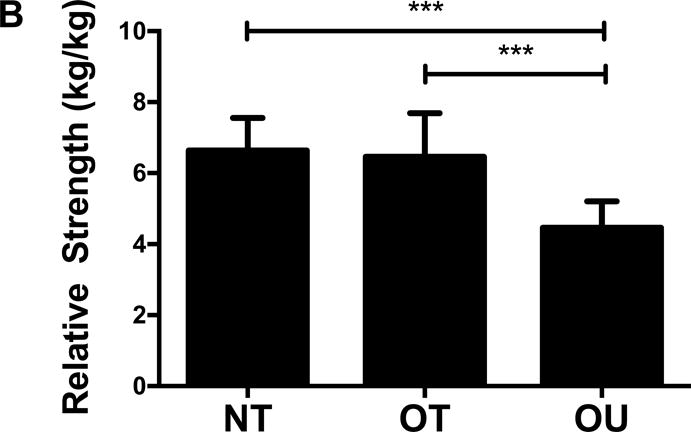
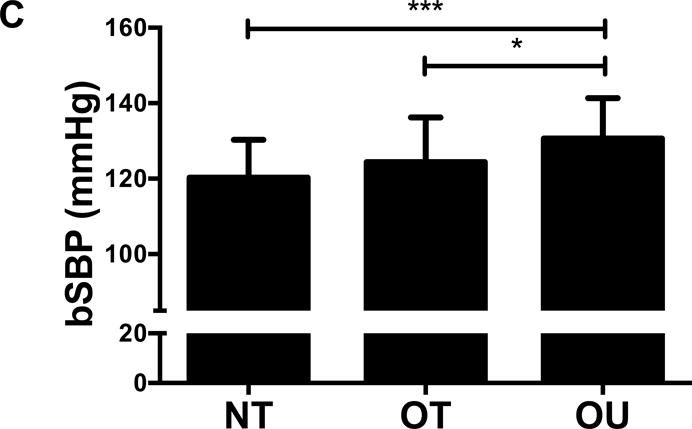
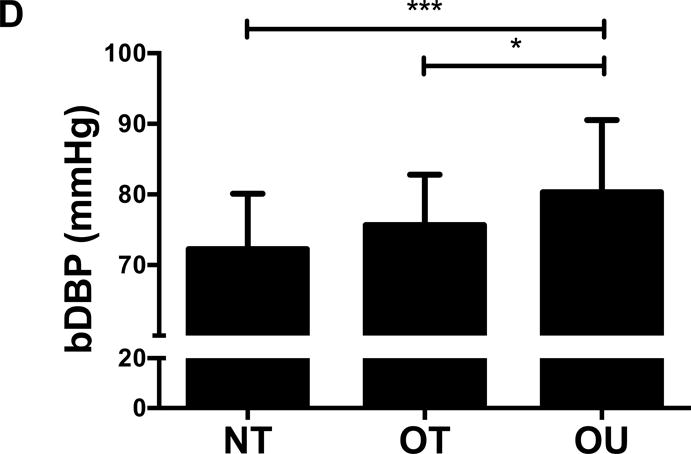
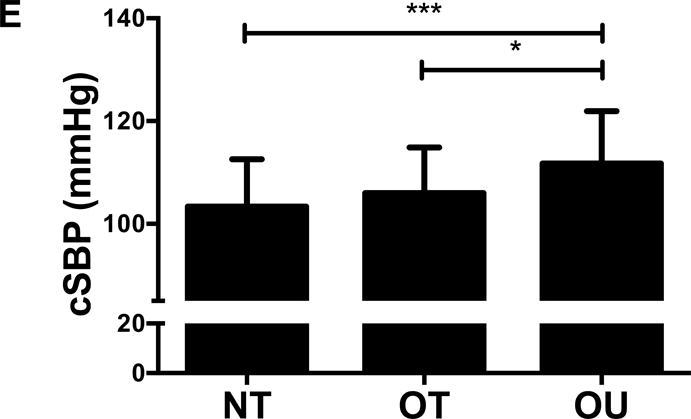
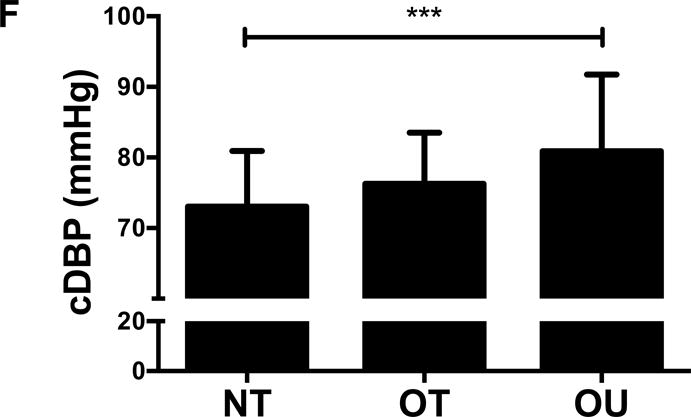
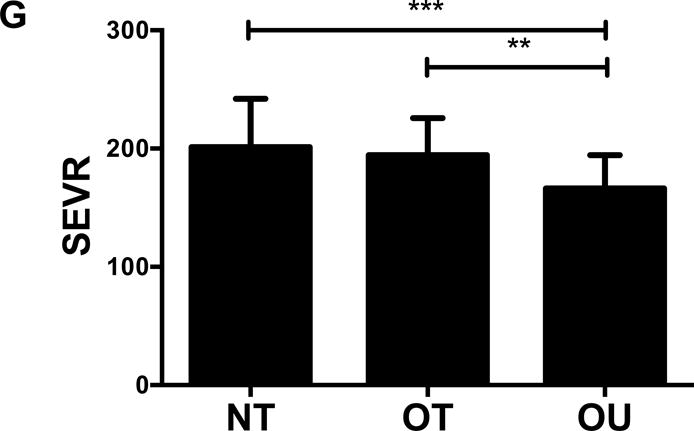
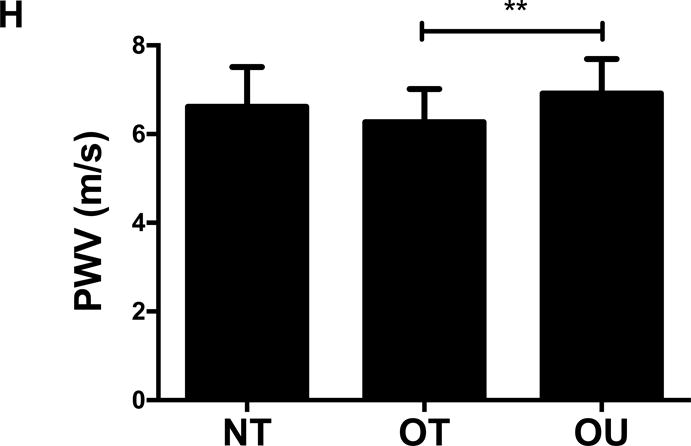
Comparison of (A) total fat mass and (B) relative strength calculated as the sum of 1-RM strength values normalized by body weight, (C, D) brachial and (E, F) central blood pressures, (G) SEVR and (H) PWV across NT, OT and OU groups.
*P<0.05; **P<0.01; ***P<0.001.
bSBP: brachial systolic blood pressure; bDBP: brachial diastolic blood pressure; cSBP: central systolic blood pressure; cDBP: central diastolic blood pressure; SEVR: sub-endocardial viability ratio; PWV: pulse wave velocity.
Vascular Function and Structure
For indices of vascular health, bSBP (Figure 1C) and bDBP (Figure 1D) were lower in NT (P<0.001) and OT (P<0.05) compared to OU. Similarly, compared to OU, cSBP was significantly lower in NT (P<0.001) and OT (P<0.05) (Figure 1E). cDBP was lower in NT vs. OU (P<0.001) and trended lower in OT vs. OU (P=0.05) (Figure 1F). Additionally, SEVR was elevated in both strength-trained groups compared to OU (NT: P<0.001, OT: P<0.01) (Figure 1G). OT exhibited lower cfPWV (P<0.05, Figure 1H) and AIx (P<0.05, Table 2) than OU. Differences in cfPWV and AIx were not seen between OU and NT, although, there was a trend for the latter (P=0.08). These differences in vascular function were found independent of any differences in carotid IMT (See Table, Supplemental Digital Content 1, Additional Cardiovascular and Metabolic Markers). For each of these outcomes, no differences were noted between the NT and OT groups.
Table 2. Cardiovascular and Metabolic Markers.
Data for NT, OT, and OU groups reported as mean (SD).
| Outcomes | NT | OT | OU | P-Value |
|---|---|---|---|---|
| AIx | −10.9 (10.5) | −12.5 (9.9) | −6.1 (10.3)# | 0.049 |
| Heart Rate (bpm) | 56.3 (9.1) | 56.8 (9.0) | 62.3 (8.4)∆# | 0.02 |
| Fasting Glucose (mg/dL) | 81.9 (7.6) | 87.8 (6.8)* | 91.2 (7.0)¶ | <0.0001 |
| HOMA | 0.6 (0.5) | 1.5 (1.1)* | 1.8 (0.9)¶ | <0.0001 |
| QUICKI | 0.46 (0.11) | 0.41 (0.14) | 0.36 (0.03)¶# | 0.001 |
| FAI | 64.2 (20.0) | 71.2 (29.1) | 116.0 (45.6)¶‡ | <0.0001 |
P<0.001 NT vs. OT or OU.
P<0.01 NT vs. OT or OU.
P<0.05 NT vs. OT or OU.
P<0.001 OU vs. OT.
P<0.01 OU vs. OT.
P<0.05 OU vs. OT.
AIx: aortic augmentation index; HOMA: homeostasis model assessment; QUICKI: quantitative insulin sensitivity check index; SHBG: sex hormone-binding globulin; FAI: free androgen index (ratio calculated by 100*(total testosterone/SHBG)).
Lipids, Inflammatory and Atherogenic Markers
NT and OT exhibited lower total cholesterol (NT: P<0.01, OT: P<0.05, Figure 2A), LDL (NT: P<0.001, OT: P<0.05, Figure 2B), TG (P<0.001, Figure 2C) and higher HDL (P<0.001, Figure 2D) than OU. Additionally, both oxLDL (P<0.001, Figure 2E) and CRP (P<0.01, Figure 2F) were lower in both strength-trained groups compared to OU. For each of these outcomes, no differences were noted between the NT and OT groups. No across group differences were found among other atherogenic markers (VEGF, MMP-9, total PAI-1, sE-selectin, sICAM-1, sVCAM-1, MPO, MCP-1, IL-8, and TNF-α) except sVCAM-1 and MPO which were elevated in NT (P<0.05, See Table, Supplemental Digital Content 1, Additional Cardiovascular and Metabolic Markers).
Figure 2.
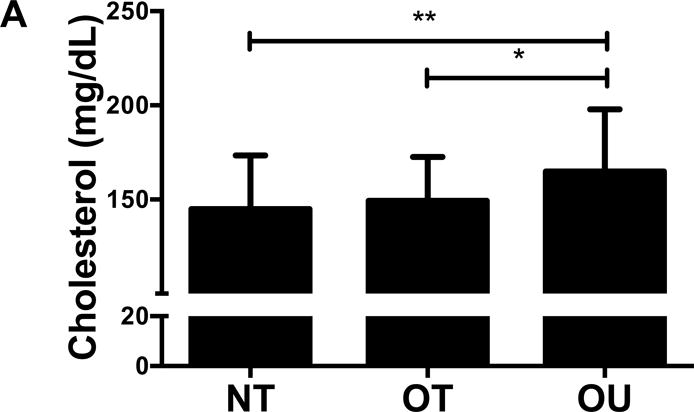
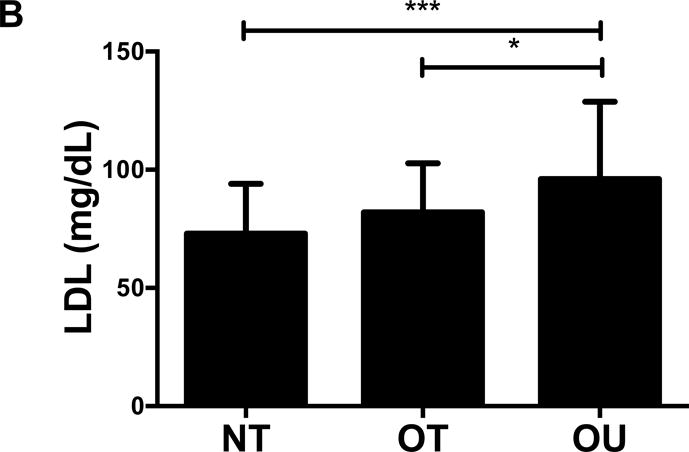
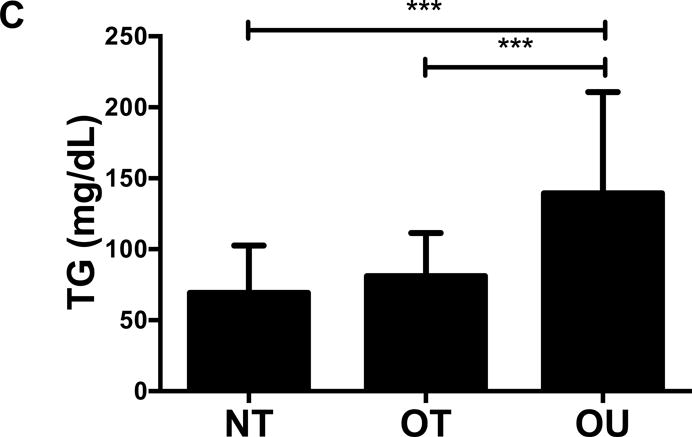
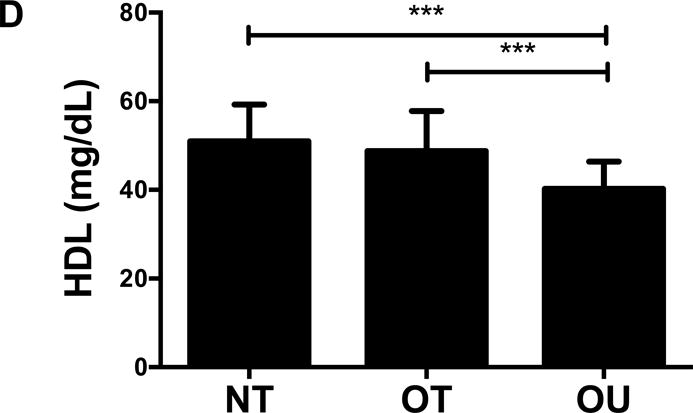
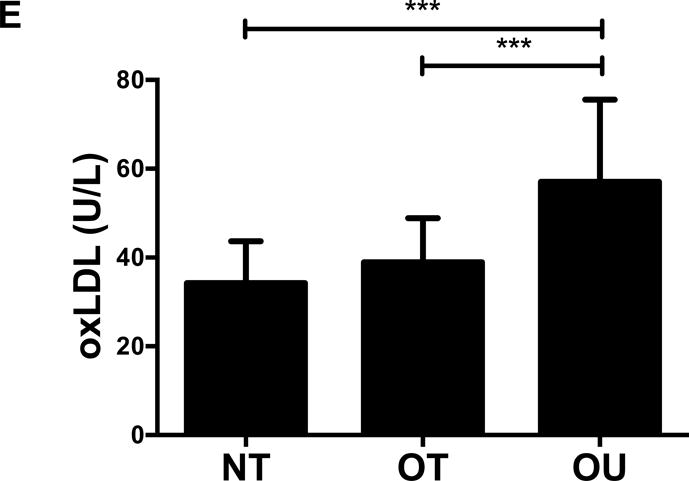
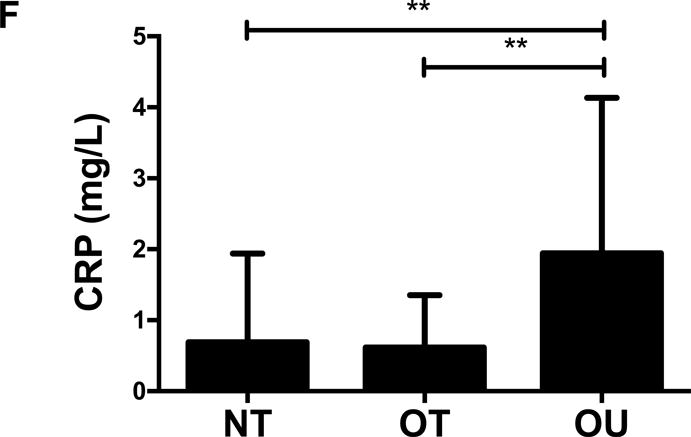
Comparison of (A-D) lipids, (E) oxLDL and (F) CRP across NT, OT and OU groups. *P<0.05; **P<0.01; ***P<0.001.
LDL: low-density lipoprotein; HDL: high-density lipoprotein; TG: triglycerides; oxLDL: oxidized low-density lipoprotein; CRP: C-reactive protein.
Glucose and Insulin, Adipokines and Steroid Hormones
Contrary to the other outcomes investigated, fasting glucose (Table 2) and insulin (Figure 3A) were significantly lower in NT compared to both OT and OU (P<0.01). QUICKI values were significantly higher in NT and OT compared to OU (P<0.05), with no difference between NT and OT. Alternatively, HOMA was lower in NT compared to OU (P<0.001) and OT (P<0.01) (Table 2). Both strength-trained groups displayed lower amylin (Figure 3B) and leptin (Figure 3C) and higher adiponectin (Figure 3D) than OU (NT: P<0.001, OT: P<0.01). SHBG concentration was also higher in both strength-trained groups vs. OU (P<0.001, Figure 3E) while corresponding FAI was lower in the strength-trained groups vs. OU (P<0.001). While testosterone was significantly higher in NT vs. OU (P<0.001), there was no significant difference between OT and OU (Figure 3F). Free testosterone and cortisol were similar among the three groups (See Table, Supplemental Digital Content 1, Additional Cardiovascular and Metabolic Markers). Additionally, all adipokine and steroid hormone concentrations were not significantly different between NT and OT.
Figure 3.
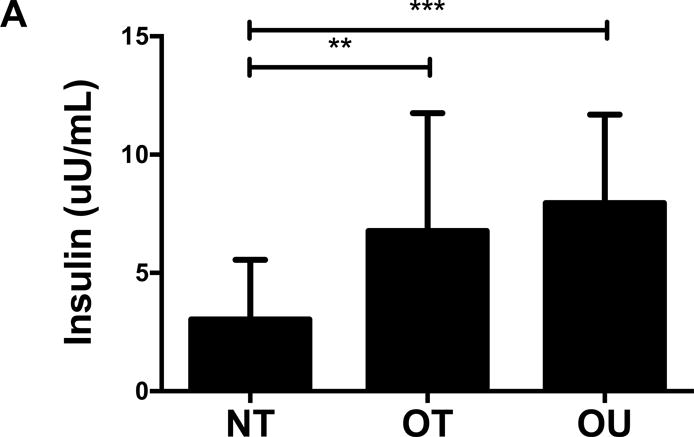
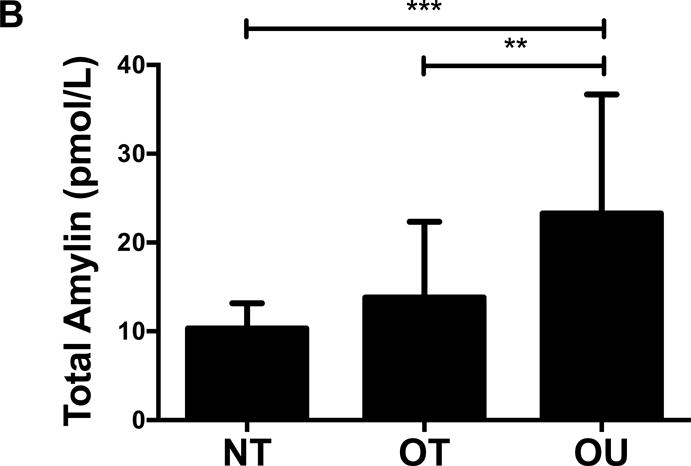
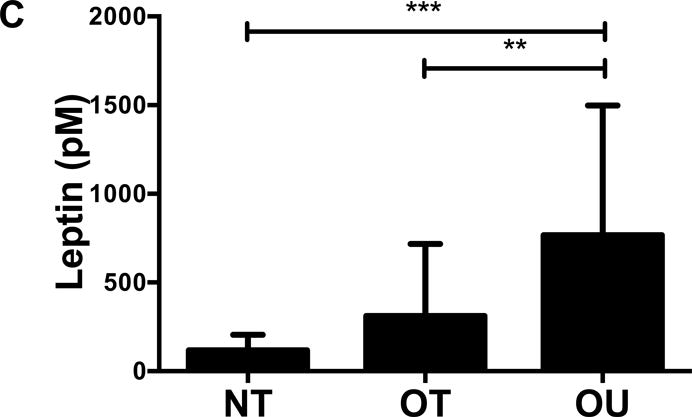
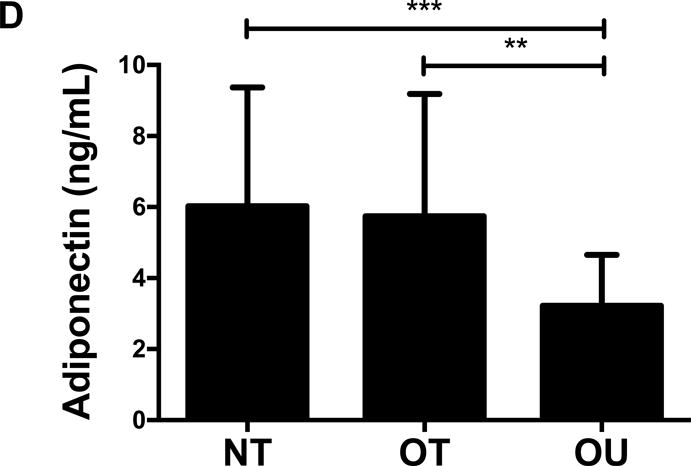
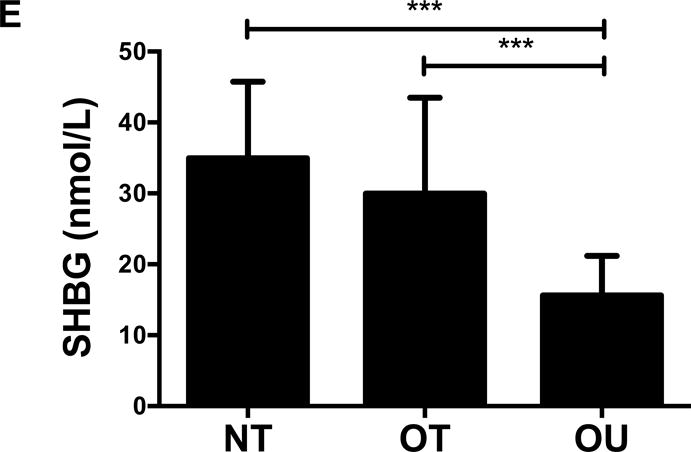
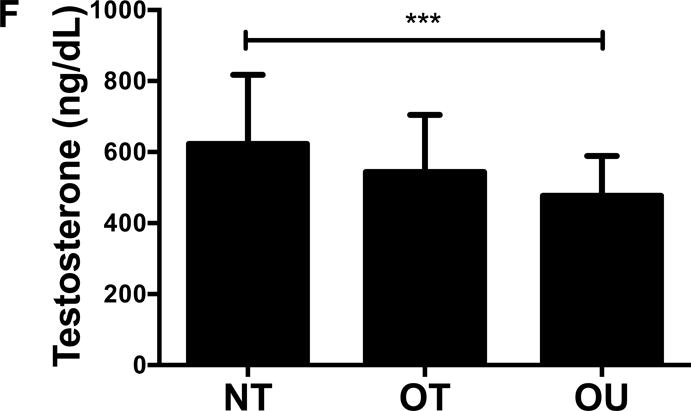
Comparison of (A) insulin, (B) amylin, (C, D) adipokines (E, F) and steroid hormones across NT, OT and OU groups.
*P<0.05; **P<0.01; ***P<0.001.
SHBG: sex hormone-binding globulin
Correlation Analyses
Indices of vascular and metabolic health were correlated with relative strength and body fat percentage within the combined cohort to explore the relationship between cardiovascular and metabolic phenotypes that were different between the groups (See Table, Supplemental Digital Content 2, Strength and Body Fat Correlation Analyses). Both body fat percentage and relative strength were correlated with cardiometabolic phenotypes, suggesting they may both influence the group differences noted.
DISCUSSION
The relative significance of weight status and fitness status as contributors to metabolic and cardiovascular health and related chronic disease risk are debatable. To provide some understanding into the relative importance of body weight and strength fitness, we assessed a variety of metabolic and cardiovascular risk factors in three groups of young men classified by BMI and RT frequency. Consistent with our hypothesis, the principal findings of this study are that participants with high strength fitness (NT and OT), secondary to regular RT, exhibit similar cardiovascular and metabolic risk factor profiles and generally improved phenotypic profiles compared to OU individuals who did not perform any regular exercise training. These findings indicate that those with higher strength fitness exhibit a reduced cardiovascular and metabolic risk profile, even in overweight or class I obese individuals (by BMI), suggesting that strength fitness may be critical to metabolic and cardiovascular health irrespective of normal-weight or class I obesity weight classification. The OT individuals in the present study were overweight/obese by BMI standards (BMI>27 kg/m2), however not by body fat percentage (mean 18%). Nevertheless, despite greater total and trunk fat mass in OT vs. NT, these groups exhibited similar phenotypes indicating that differences in adiposity had no effect on phenotypes in these two groups.
Higher muscle strength in both NT and OT subjects compared to OU participants was accompanied by lower central and peripheral blood pressure, indices of arterial stiffness, plasma lipids, oxLDL and CRP. Prior studies support the contention that strength fitness may be superior in the prediction of cardiovascular phenotypes. Fahs et al. (6) noted that after adjusting for body weight, a modest, but significant inverse relationship between central PWV and muscular strength was noted. Obesity has been characterized by increased levels of pro-inflammatory cytokines and atherogenic markers, including oxLDL (39) and CRP (31). In the present study, both of these markers were lower in strength-trained groups compared to OU subjects, suggesting that muscular fitness is a better predictor of oxidative stress and inflammation than weight status. Consistent with these findings, Kosola et al. (15) demonstrated that the high oxLDL associated with overweight and obese individuals is attenuated in subjects with higher muscular fitness. In addition, RT has been noted to decrease CRP with no change in weight or fat mass (5). Notably, other biomarkers of CVD risk including cell adhesion molecules and markers of endothelial dysfunction were generally not different between the three groups in the present investigation. Data on the ability of RT to alter these markers suggest limited effects. Olson et al. (22) noted no effect of RT on IL-6, sICAM-1, sVCAM-1 or E-selectin, while Klimcakova et al. (14) noted no changes in TNF-α, IL-6 or IL-1β after RT.
We also investigated a variety of endocrine markers that impact cardiovascular and metabolic health, including adipokines and steroid hormones, as well as glucose and insulin. Both NT and OT groups exhibited lower leptin levels than OU subjects. Additionally, we noted higher adiponectin concentrations in both strength-trained groups compared with OU subjects. Although data is limited with regard to circulating leptin and adiponectin with RT, some RT intervention studies have noted an increase in adiponectin (22) and a decrease in leptin (14) without weight loss. Interestingly, the changes in leptin and adiponectin may be dependent on the intensity of RT (7). Data on amylin with exercise training is scarce; however, we previously noted that a 12-week RT intervention did not significantly decrease total amylin concentration (2), while a short-term diet and exercise intervention decreased amylin in obese children, despite remaining obese after the intervention (12). Additionally, SHBG is positively associated with glycemic control (10) and predicts both metabolic syndrome and T2D (4). In the present study, we noted increased SHBG and decreased FAI in both NT and OT subjects compared with the OU group. We recently noted an increase in SHBG and decrease in FAI in young men following a 12-week RT, albeit in the presence of weight gain (26). Contrary to our other findings, glucose and insulin levels were not different in OT vs. OU. QUICKI, a surrogate measure of insulin sensitivity, based on fasting glucose and insulin levels, was higher in both strength-trained groups, and HOMA, an index of insulin resistance, was lower in NT compared to both OT and OU groups. What may account, at least in part, for these findings and a limitation of this study, is that fasting measures and indices based on fasting values are poor surrogates for dynamic changes in glucose and insulin metabolism which are best measured by an oral glucose tolerance test or other tests for insulin sensitivity (i.e. clamp or intravenous glucose tolerance test). Other RT interventions have demonstrated an improvement in insulin sensitivity independent of weight loss and without concomitant reductions in fasting glucose and insulin (14). Additionally, Minges et al. (20) noted that ≥40 min/wk of RT was associated with a 31% decrease in odds of displaying impaired glucose metabolism, after controlling for leisure time physical activity.
The relationship between body weight, fitness and cardiometabolic risk is complex. Treatment guidelines for overweight and obese adults encourage weight loss of 10% of initial body weight to improve cardiovascular and metabolic risk factors (37). A growing number of studies indicate that overweight/obese adults can achieve a reduction in obesity-related comorbid conditions with increased physical activity and minimal or no weight loss (24, 27). These data along with the present findings, suggest that a normal body weight status is not a prerequisite in achieving the beneficial effects of regular exercise training and/or lifestyle modifications. Studies that support the concept that fitness status alone can improve metabolic health come from epidemiologic studies on mortality rates and fitness (17, 19), as well as intervention studies that note improved risk factors for cardiovascular and metabolic disease by exercise training with minimal or no weight loss or change in body composition. Studies like these corroborate that a significant portion of normal-weight individuals (by BMI) are metabolically unhealthy (40), while many obese individuals are not. There is also evidence that performing RT and increasing muscular strength lowers the risk for metabolic syndrome (13), coronary heart disease (36), T2D (11), CVD mortality (23) and overall mortality (34). For example, Tanasescu et al. (36) noted that greater than 30 minutes/week of RT decreased coronary heart disease risk 35% in age-adjusted analysis and 23% in analysis accounting for other factors such as smoking and dietary factors. Grontved et al. (11) noted that ≥150 minutes/week of RT lowered risk of T2D 54% in age-adjusted analysis and 34% after adjusting for aerobic exercise, other moderate activity and television viewing. Our data suggests that regular RT decreases several risk factors related to CVD, T2D and metabolic syndrome, even in OT subjects with BMIs >27 and to a similar degree compared to those NT with lower body weight, total and trunk fat mass. Additionally, several randomized, controlled exercise trials have noted that exercise intervention is associated with a significant reduction in one or more cardiometabolic risk factors in the absence of weight loss (14), and we previously demonstrated that short-term lifestyle modification could ameliorate metabolic and/or CVD risk factors in men (29, 30), women (38) and children (12, 25), despite small changes in weight and participants remaining overweight/obese. Furthermore, we recently noted that normal-weight and obese children responded similarly to short-term lifestyle modification despite no weight loss in the normal-weight group and the obese group remaining obese (28). Collectively this work supports the notion that BMI and body weight are poor indices to predict cardiometabolic risk, and indices of fitness, such as strength fitness may be better predictors.
Important to this discussion, in the present study we matched the BMIs of the OT and OU groups. Our use of DXA allowed us to compare differences in body composition and metabolic and cardiovascular phenotypes between two groups of similarly strength-trained participants, NT and OT, and an untrained group, OU. Differences in total and trunk fat mass did not account for differences in phenotypes between NT and OT groups because both exhibited similar phenotypes. However, we cannot attribute the differences between OT and OU solely to training, since fat mass also differed between these 2 groups. Exploratory correlation analyses do suggest that both strength and adiposity are associated with cardiometabolic phenotypes. Nonetheless, matching these groups for fat mass is difficult due to the effects of regular RT on fat mass. However, analyses of subgroups of subjects with equal fat mass from OT and OU indicated trends similar to the full group analyses (data not shown). Furthermore, this study utilized strict inclusion criteria to investigate young men in a controlled environment and their 1-RM strength assessment confirmed training status. We focused on a wide variety of cardiovascular and metabolic risk factors to better understand the intricate interplay between weight status, strength fitness and factors contributing to the pathogenesis of cardiovascular and metabolic diseases. A limitation deserving comment is that our study design did not allow us to extend our hypothesis to include normal-weight, untrained subjects, which may exhibit elevated cardiometabolic risk factors compared to trained groups, and similar to OU subjects.
Thus, individuals who are overweight/obese class I and strength-trained exhibit cardiovascular and metabolic phenotypes similar to those who are normal-weight and strength-trained, rather than those overweight/obese and untrained, suggesting that adaptations associated with chronic RT are related to improved risk profiles irrespective of body weight classification in normal-weight, overweight and obese class I classifications. These findings provide preliminary evidence to challenge the existing view of the importance of body weight per se and suggest that strength fitness may be more critical to metabolic and cardiovascular health. These data also indicate that BMI and body weight may be poor surrogates for risk and other factors contribute to cardiovascular and metabolic health. Furthermore, strength fitness may be an alternate therapeutic target, especially in those unable to normalize body weight. Future studies should include strength fitness when investigating cardiometabolic health and more work is needed to tackle the difficult task of clarifying fitness versus fatness relationships.
Supplementary Material
SDC 1. Additional Cardiovascular and Metabolic Markers.
SDC 2. Strength and Body Fat Correlation Analyses.
Acknowledgments
We would like to thank the entire Exercise Physiology and Metabolic Disease Research Laboratory team for their commitment to this study. We thank the Gonda (Goldschmied) Diabetes Center, and Elisa Terry, Mick DeLuca and colleagues at the John Wooden Recreation Center. Furthermore, we thank all participants for their time and effort. The results of the present study do not constitute endorsement by ACSM.
SOURCES OF FUNDING
This work was supported by the American Heart Association (#0765139Y to C.K.R.), the NHLBI (P50HL105188 to C.K.R.), the NIDDK (R01DK090406 to C.K.R.) and the National Center for Advancing Translational Sciences through UCLA CTSI Grant UL1TR000124.
Footnotes
AUTHOR CONTRIBUTIONS
C.K.R. and D.M.C. conception and design of research; M.M.L., D.M.C., S.L.K., M.K.C., M.K. and C.S.O. performed experiments; M.M.L and D.M.C. analyzed data, prepared figures and tables; C.K.R. and M.M.L. interpreted results of experiments; C.K.R. and M.M.L. drafted manuscript; C.K.R., M.M.L., S.L.K., M.K.C., M.K., S.S.A., C.O., V.R., R.A.H., A.L.H. and D.M.C. edited manuscript; C.K.R. approved final version of manuscript.
DISCLOSURES: The authors declared no conflict of interest.
References
- 1.Croymans DM, Krell SM, Oh CS, et al. Effects of resistance training on central blood pressure in obese young men. Journal of Human Hypertension. 2014;28(3):157–64. doi: 10.1038/jhh.2013.81. [DOI] [PMC free article] [PubMed] [Google Scholar]
- 2.Croymans DM, Paparisto E, Lee MM, et al. Resistance training improves indices of muscle insulin sensitivity and beta-cell function in overweight/obese, sedentary young men. J Appl Physiol. 2013;115(9):1245–53. doi: 10.1152/japplphysiol.00485.2013. [DOI] [PMC free article] [PubMed] [Google Scholar]
- 3.Curioni CC, Lourenco PM. Long-term weight loss after diet and exercise: a systematic review. Int J Obes. 2005;29(10):1168–74. doi: 10.1038/sj.ijo.0803015. [DOI] [PubMed] [Google Scholar]
- 4.Ding EL, Song Y, Malik VS, Liu S. Sex differences of endogenous sex hormones and risk of type 2 diabetes: a systematic review and meta-analysis. JAMA. 2006;295(11):1288–99. doi: 10.1001/jama.295.11.1288. [DOI] [PubMed] [Google Scholar]
- 5.Donges CE, Duffield R, Drinkwater EJ. Effects of resistance or aerobic exercise training on interleukin-6, C-reactive protein, and body composition. Med Sci Sports Exerc. 2010;42(2):304–13. doi: 10.1249/MSS.0b013e3181b117ca. [DOI] [PubMed] [Google Scholar]
- 6.Fahs CA, Heffernan KS, Ranadive S, Jae SY, Fernhall B. Muscular strength is inversely associated with aortic stiffness in young men. Medicine and science in sports and exercise. 2010;42(9):1619–24. doi: 10.1249/MSS.0b013e3181d8d834. [DOI] [PubMed] [Google Scholar]
- 7.Fatouros IG, Tournis S, Leontsini D, et al. Leptin and adiponectin responses in overweight inactive elderly following resistance training and detraining are intensity related. J Clin Endocrinol Metab. 2005;90(11):5970–7. doi: 10.1210/jc.2005-0261. [DOI] [PubMed] [Google Scholar]
- 8.Flegal KM, Kit BK, Orpana H, Graubard BI. Association of all-cause mortality with overweight and obesity using standard body mass index categories: A systematic review and meta-analysis. JAMA. 2013;309(1):71–82. doi: 10.1001/jama.2012.113905. [DOI] [PMC free article] [PubMed] [Google Scholar]
- 9.Friedewald WT, Levy RI, Fredrickson DS. Estimation of the concentration of low-density lipoprotein cholesterol in plasma, without use of the preparative ultracentrifuge. Clin Chem. 1972;18(6):499–502. [PubMed] [Google Scholar]
- 10.Golden SH, Dobs AS, Vaidya D, et al. Endogenous sex hormones and glucose tolerance status in postmenopausal women. The Journal of Clinical Endocrinology and Metabolism. 2007;92(4):1289–95. doi: 10.1210/jc.2006-1895. [DOI] [PubMed] [Google Scholar]
- 11.Grøntved A, Rimm EB, Willett WC, Andersen LB, Hu FB. A prospective study of weight training and risk of type 2 diabetes mellitus in men. Arch Intern Med. 2012;172(17):1306–12. doi: 10.1001/archinternmed.2012.3138. [DOI] [PMC free article] [PubMed] [Google Scholar]
- 12.Izadpanah A, Barnard RJ, Almeda AJE, et al. A short-term diet and exercise intervention ameliorates inflammation and markers of metabolic health in overweight/obese children. American Journal of Physiology – Endocrinology And Metabolism. 2012;303:E542–E50. doi: 10.1152/ajpendo.00190.2012. [DOI] [PMC free article] [PubMed] [Google Scholar]
- 13.Jurca R, Lamonte MJ, Barlow CE, Kampert JB, Church TS, Blair SN. Association of muscular strength with incidence of metabolic syndrome in men. Med Sci Sports Exerc. 2005;37(11):1849–55. doi: 10.1249/01.mss.0000175865.17614.74. [DOI] [PubMed] [Google Scholar]
- 14.Klimcakova E, Polak J, Moro C, et al. Dynamic strength training improves insulin sensitivity without altering plasma levels and gene expression of adipokines in subcutaneous adipose tissue in obese men. J Clin Endocrinol Metab. 2006;91(12):5107–12. doi: 10.1210/jc.2006-0382. [DOI] [PubMed] [Google Scholar]
- 15.Kosola J, Ahotupa M, Kyrolainen H, Santtila M, Vasankari T. Good aerobic or muscular fitness protects overweight men from elevated oxidized LDL. Medicine and science in sports and exercise. 2012;44(4):563–8. doi: 10.1249/MSS.0b013e31823822cc. [DOI] [PubMed] [Google Scholar]
- 16.Laurent S, Cockcroft J, Van Bortel L, et al. Expert consensus document on arterial stiffness: methodological issues and clinical applications. Eur Heart J. 2006;27(21):2588–605. doi: 10.1093/eurheartj/ehl254. [DOI] [PubMed] [Google Scholar]
- 17.Lee CD, Blair SN, Jackson AS. Cardiorespiratory fitness, body composition, and all-cause and cardiovascular disease mortality in men. Am J Clin Nutr. 1999;69(3):373–80. doi: 10.1093/ajcn/69.3.373. [DOI] [PubMed] [Google Scholar]
- 18.McAuley PA, Artero EG, Sui X, et al. The obesity paradox, cardiorespiratory fitness, and coronary heart disease. Mayo Clinic Proceedings. 2012;87(5):443–51. doi: 10.1016/j.mayocp.2012.01.013. [DOI] [PMC free article] [PubMed] [Google Scholar]
- 19.McAuley PA, Kokkinos PF, Oliveira RB, Emerson BT, Myers JN. Obesity paradox and cardiorespiratory fitness in 12,417 male veterans aged 40 to 70 years. Mayo Clin Proc. 2010;85(2):115–21. doi: 10.4065/mcp.2009.0562. [DOI] [PMC free article] [PubMed] [Google Scholar]
- 20.Minges KE, Magliano DJ, Owen N, et al. Associations of Strength Training with Impaired Glucose Metabolism: The AusDiab Study. Medicine & Science in Sports & Exercise. 2013;45(2):299–303. doi: 10.1249/MSS.0b013e31826e6cd1. [DOI] [PubMed] [Google Scholar]
- 21.Ogden CL, Carroll MD, Kit BK, Flegal KM. Prevalence of obesity in the United States, 2009–2010. NCHS Data Brief. 2012;(82):1–8. [PubMed] [Google Scholar]
- 22.Olson TP, Dengel DR, Leon AS, Schmitz KH. Changes in inflammatory biomarkers following one-year of moderate resistance training in overweight women. Int J Obes. 2007;31(6):996–1003. doi: 10.1038/sj.ijo.0803534. [DOI] [PubMed] [Google Scholar]
- 23.Ortega FB, Silventoinen K, Tynelius P, Rasmussen F. Muscular strength in male adolescents and premature death: cohort study of one million participants. BMJ. 2012;345:e7279. doi: 10.1136/bmj.e7279. [DOI] [PMC free article] [PubMed] [Google Scholar]
- 24.Roberts CK, Barnard RJ. Effects of exercise and diet on chronic disease. J Appl Physiol. 2005;98(1):3–30. doi: 10.1152/japplphysiol.00852.2004. [DOI] [PubMed] [Google Scholar]
- 25.Roberts CK, Chen AK, Barnard RJ. Effect of a short-term diet and exercise intervention in youth on atherosclerotic risk factors. Atherosclerosis. 2007;191(1):98–106. doi: 10.1016/j.atherosclerosis.2006.09.011. [DOI] [PubMed] [Google Scholar]
- 26.Roberts CK, Croymans DM, Aziz N, Butch AW, Lee CC. Resistance training increases SHBG in overweight/obese, young men. Metabolism. 2013;62(5):725–33. doi: 10.1016/j.metabol.2012.12.004. [DOI] [PMC free article] [PubMed] [Google Scholar]
- 27.Roberts CK, Hevener AL, Barnard RJ. Metabolic syndrome and insulin resistance: underlying casues and modification by exercise training. Comprehesive Physiology. 2013;3(1):1–58. doi: 10.1002/cphy.c110062. [DOI] [PMC free article] [PubMed] [Google Scholar]
- 28.Roberts CK, Izadpanah A, Angadi SS, Barnard RJ. Effects of an intensive short-term diet and exercise intervention: comparison between normal-weight and obese children. American journal of physiology. Regulatory, integrative and comparative physiology. 2013;305(5):R552–7. doi: 10.1152/ajpregu.00131.2013. [DOI] [PMC free article] [PubMed] [Google Scholar]
- 29.Roberts CK, Ng C, Hama S, Eliseo AJ, Barnard RJ. Effect of a short-term diet and exercise intervention on inflammatory/anti-inflammatory properties of HDL in overweight/obese men with cardiovascular risk factors. J Appl Physiol. 2006;101(6):1727–32. doi: 10.1152/japplphysiol.00345.2006. [DOI] [PubMed] [Google Scholar]
- 30.Roberts CK, Vaziri ND, Barnard RJ. Effect of diet and exercise intervention on blood pressure, insulin, oxidative stress, and nitric oxide availability. Circulation. 2002;106(20):2530–2. doi: 10.1161/01.cir.0000040584.91836.0d. [DOI] [PubMed] [Google Scholar]
- 31.Rocha VZ, Libby P. Obesity, inflammation, and atherosclerosis. Nat Rev Cardiol. 2009;6(6):399–409. doi: 10.1038/nrcardio.2009.55. [DOI] [PubMed] [Google Scholar]
- 32.Rosenbaum M, Hirsch J, Gallagher DA, Leibel RL. Long-term persistence of adaptive thermogenesis in subjects who have maintained a reduced body weight. The American journal of clinical nutrition. 2008;88(4):906–12. doi: 10.1093/ajcn/88.4.906. [DOI] [PubMed] [Google Scholar]
- 33.Ross R, Bradshaw AJ. The future of obesity reduction: beyond weight loss. Nat Rev Endocrinol. 2009;5(6):319–25. doi: 10.1038/nrendo.2009.78. [DOI] [PubMed] [Google Scholar]
- 34.Ruiz JR, Sui X, Lobelo F, et al. Association between muscular strength and mortality in men: prospective cohort study. Bmj. 2008;337(jul01_2):a439––. doi: 10.1136/bmj.a439. [DOI] [PMC free article] [PubMed] [Google Scholar]
- 35.Sodergard R, Backstrom T, Shanbhag V, Carstensen H. Calculation of free and bound fractions of testosterone and estradiol-17 beta to human plasma proteins at body temperature. J Steroid Biochem. 1982;16(6):801–10. doi: 10.1016/0022-4731(82)90038-3. [DOI] [PubMed] [Google Scholar]
- 36.Tanasescu M, Leitzmann MF, Rimm EB, Willett WC, Stampfer MJ, Hu FB. Exercise type and intensity in relation to coronary heart disease in men. JAMA. 2002;288(16):1994–2000. doi: 10.1001/jama.288.16.1994. [DOI] [PubMed] [Google Scholar]
- 37.Wadden TA, Webb VL, Moran CH, Bailer BA. Lifestyle modification for obesity. Circulation. 2012;125(9):1157–70. doi: 10.1161/CIRCULATIONAHA.111.039453. [DOI] [PMC free article] [PubMed] [Google Scholar]
- 38.Wegge JK, Roberts CK, Ngo TH, Barnard RJ. Effect of diet and exercise intervention on inflammatory and adhesion molecules in postmenopausal women on hormone replacement therapy and at risk for coronary artery disease. Metabolism. 2004;53(3):377–81. doi: 10.1016/j.metabol.2003.10.016. [DOI] [PubMed] [Google Scholar]
- 39.Weinbrenner T, Schroder H, Escurriol V, et al. Circulating oxidized LDL is associated with increased waist circumference independent of body mass index in men and women. The American journal of clinical nutrition. 2006;83(1):30–5. doi: 10.1093/ajcn/83.1.30. [DOI] [PubMed] [Google Scholar]
- 40.Wildman RP, Muntner P, Reynolds K, et al. The obese without cardiometabolic risk factor clustering and the normal weight with cardiometabolic risk factor clustering: prevalence and correlates of 2 phenotypes among the US population (NHANES 1999-2004) Arch Intern Med. 2008;168(15):1617–24. doi: 10.1001/archinte.168.15.1617. [DOI] [PubMed] [Google Scholar]
Associated Data
This section collects any data citations, data availability statements, or supplementary materials included in this article.
Supplementary Materials
SDC 1. Additional Cardiovascular and Metabolic Markers.
SDC 2. Strength and Body Fat Correlation Analyses.


