

Abstract
By harnessing photoswitchable intersystem crossing (ISC) in spiropyran (SP) molecules, active control of plasmon-enhanced fluorescence in the hybrid systems of SP molecules and plasmonic nanostructures is achieved. Specifically, SP-derived merocyanine (MC) molecules formed by photochemical ring-opening reaction display efficient ISC due to their zwitterionic character. In contrast, ISC in quinoidal MC molecules formed by thermal ring-opening reaction is negligible. The high ISC rate can improve fluorescence quantum yield of the plasmon-modified spontaneous emission, only when the plasmonic electromagnetic field enhancement is sufficiently high. Along this line, extensive photomodulation of fluorescence is demonstrated by switching the ISC in MC molecules at Au nanoparticle aggregates, where strongly enhanced plasmonic hot spots exist. The ISC-mediated plasmon-enhanced fluorescence represents a new approach toward controlling the spontaneous emission of fluorophores near plasmonic nanostructures, which expands the applications of active molecular plasmonics in information processing, biosensing, and bioimaging.
1. Introduction
Controlling the spontaneous emission of fluorophores at the nanoscale is critical to the development of nanolasers, single-photon sources, and high-resolution fluorescence biomarkers, for applications in information processing, biosensing, and bioimaging.[1–7] Modification of spontaneous emission of a fluorophore was reported decades ago.[8] Since then, tremendous development of nanophotonic technology has enabled exploring the control over the spontaneous emission of fluorophores at the nanoscale and below.[1,5,6,9–15] Among many nanophotonic systems, plasmonic nanostructures present multiple advantages for controlling fluorescence, including: (1) strong electromagnetic field (E-field) enhancement upon excitation of surface plasmons; (2) small size of plasmonic nanostructures for device miniaturization; (3) highly confined “hot spots,” relevant to single fluorophores in size; and (4) high chemical stability of noble metals in plasmonic nanostructures.[16–25]
Extensive studies on plasmon-enhanced fluorescence have focused on applying plasmonic nanostructures with large field enhancement and low optical loss to increase the excitation and radiative-decay rates of fluorophores. However, the fluorescence quantum yield (QY) is also influenced by nonradiative decay rates that can be increased by the plasmon-induced high electromagnetic fields. The nonradiative decay channels vary in different molecular systems. In the presence of a strong spin–orbit coupling, an additional decay channel occurs when the first excited singlet state transfers to the triplet state, a process known as intersystem crossing (ISC). So far, most of the studies on plasmon-enhanced fluorescence have ignored the possible influence of ISC.[3,9,11–13,22,26–29] However, for some dye molecules such as spiropyran (SP)-derived merocyanine (MC) molecules, ISC can be an efficient nonradiative decay pathway of the first excited singlet state.[30,31] Therefore, understanding and controlling the effects of ISC on plasmon-enhanced fluorescence may advance both fundamental research and applications.
Herein, we explore and exploit the intrinsic ISC of photochromic molecules to control their plasmon-enhanced fluorescence. Specifically, we used hybrid systems comprising photochromic SP molecules and a single plasmonic nano-particle (NP) or NP aggregates, as platforms to demonstrate that (1) ISC-mediated plasmon-enhanced fluorescence of photoswitchabe molecules leads to a large modulation of light emission from the hybrid systems, and (2) as a nonradiative decay pathway, counterintuitively, ISC can improve the plasmonic enhancement of the fluorescence of molecules when there is strong electromagnetic field enhancement and the ISC rate is sufficiently fast.
It has been known that SP molecules can convert to MC form via either photochemical ring-opening or thermal ring-opening reactions.[32,33] Photochemical ring-opening reactions proceed through a heterolytic C—O bond cleavage, producing the zwitterionic MC form. Thermal ring-opening reactions follow a 6p electrocyclic ring opening, producing the quinoidal MC form, (Figure 1a). A zwitterionic character in the singlet wave function, which contains a positive and a negative charge, is favorable for ISC.[34–36] While the zwitterionic MC form has efficient ISC,[30,31] the quinoidal MC form lacks the zwitterionic character and thus the ISC. Therefore, the decay channels of the first excited singlet state are different in the zwitterionic and the quinoidal MC forms, as indicated in Figure 1b. Thus, the fluorescence QY of zwitterionic MC molecules (ϕ) and quinoidal MC molecules (ϕ′0), without plasmonic nanostructures, can be expressed as:[9,13,26]
Figure 1.
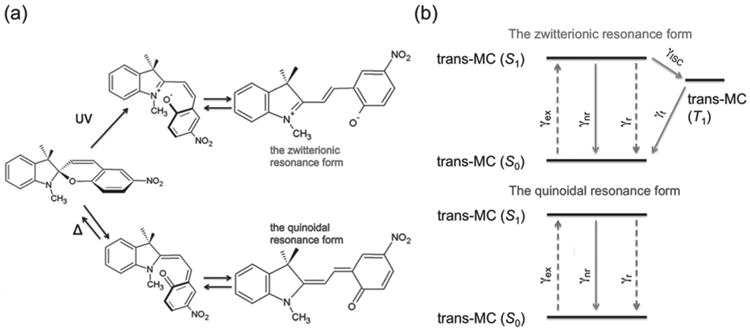
a) Schematic representation of the photochemical (up pathway) and thermal (down pathway) ring-opening reactions of SP molecules. b) Jablonski diagram with the relevant energy states for both forms. γex is the excitation rate, γr is the radiative decay rate, γnr is the nonradiative decay rate, γISC is the rate of intersystem crossing, and γt is the triplet decay rate.
| (1) |
and,
| (2) |
where γr, γnr, and γISC represent the radiative decay rate, non-radiative (excluding ISC) decay rate, and ISC rate of zwitterionic MC molecules, respectively. and are the radiative and nonradiative decay rates of quinoidal MC molecules, respectively. We use (′) to distinguish the parameters of the quinoidal MC molecule from those of the zwitterionic MC molecule.
2. Results and Discussion
Our samples were prepared by drop-casting Au nanospheres (AuNSs) and Au nanotriangles (AuNTs) on glass slides,[37] followed by spin-coating of SP-doped poly(methyl methacrylate) (PMMA) films to cover the AuNSs and AuNTs, as shown in Figure 2a (a more detailed description can be found in the Experimental Section). The photoisomerization of SP in the PMMA matrix was confirmed by Fourier transform infrared spectroscopy (FTIR) and UV–vis absorption spectra under different light irradiation (see Figure S1 in the Supporting Information). Upon white light excitation of the molecules, photoswitchable fluorescence can be observed in a dark-field optical microscope after alternating UV and green light irradiation, as shown in Figure 2b.[38] The fluorescence of zwitterionic MC molecules, which are formed via photochemical ring opening reaction upon UV irradiation, features an emission band centered at 670 nm (Figure 2b, purple line), which is in good agreement with the fluorescence measured in a conventional fluorometer.[39–41] The zwitterionic MC molecules are stable in the PMMA matrix due to the increased polarity of their microenvironment.[42–45] This increased polarity arises from the formation of a large number of zwitterionic MC molecules in the PMMA matrix during UV irradiation. Both the as-prepared sample and the sample after green irradiation feature emission bands centered at ≈650 nm (Figure 2b, red and green lines). The emission cannot be attributed to SP molecules, which were reported to have an emission band centered around ≈530 nm under UV light excitation (our white halogen light source does not contain UV light, see spectrum in Figure S2 in the Supporting Information).[32] We attribute the ≈650 nm emission to the quinoidal MC molecules, which are formed through a thermal ring-opening reaction (see Figure S3 and detailed discussion in the Supporting Information).[32] The thermal ring-opening reaction occurs in our experiments due to temperature increase (see detailed information in the Experimental Section) at the optically irradiated spots. Therefore, our molecular system combined with plasmonic nanoparticles provides an ideal platform to investigate how the intrinsic ISC affects plasmon-enhanced fluorescence.
Figure 2.
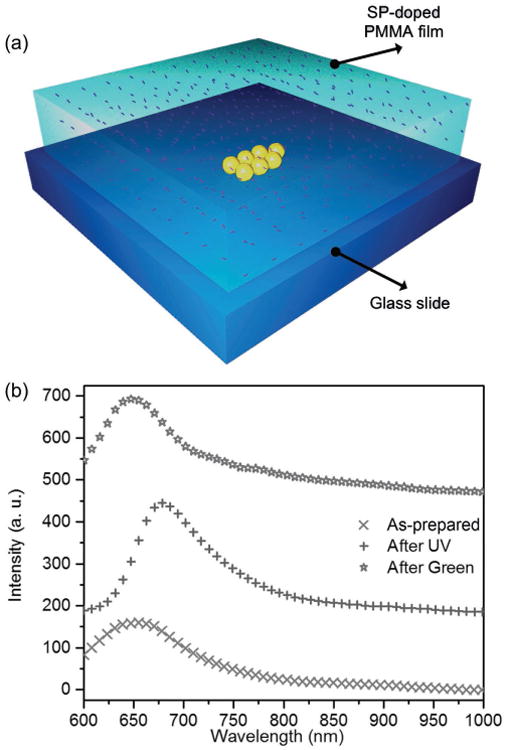
a) Schematic view of a sample comprising a single AuNS aggregate on a glass substrate, covered by an SP-doped PMMA thin film. b) Photoswitchable fluorescence of pure photochromic molecules. Specifically, the curve made of red crosses represents the molecular fluorescence before irradiation on the sample. The curves made of purple and green symbols represent molecular fluorescence after UV and green light irradiation on the sample, respectively. An intensity-axis offset was added for clarity.
The fluorescence of a molecular emitter is enhanced when the molecule is near a plasmonic nanostructure that exhibits a localized surface plasmon resonance (LSPR) at a wavelength matching the fluorescence peak of the emitter.[9,46] The radiative decay rate enhancement is calculated by:[9,46]
| (3) |
where γr is the radiative decay rate in the presence of the plasmonic nanostructure, γr0 is the radiative decay rate without the plasmonic nanostructure, np is the unit vector in the direction of the molecule's dipole moment, k is the wavevector of emitted light, ω is frequency of emitted light, α↔ is the particle's polarizability, G↔ is the system's dyadic Green's function, r0 is the position vector of the molecules, and rp is the position vector of the particles.
The enhanced E-field by the plasmonic nanostructure, Ep(r0), equals,[46]
| (4) |
where E0(rp) is the E-field of the incident light. By combining Equations (3) and (4), we obtain:
| (5) |
From Equation (5), it is clear that a larger E-field enhancement leads to a larger radiative decay rate enhancement, and when Ep(r0) is much larger than E0(rp) approximately .
Since both plasmonic NP aggregates with small interparticle gaps and NPs with sharp tips can lead to a large E-field enhancement,[37,47–50] we selected for our experiments self-assembled gold nanosphere (AuNS) aggregates with small interparticle gaps and single gold nanotriangles (AuNTs) featuring sharp tips. Self-assembly is chosen to obtain AuNS aggregates with small interparticle gaps, which are difficult to produce by other methods, such as the electron-beam lithography. In the former case, we use AuNSs with a diameter of 60 nm (see scanning electron microscopy (SEM) image of AuNSs in Figure S4a in the Supporting Information). AuNTs have an average edge length of 60 nm and an average thickness of 30 nm (see transmission electron microscopy image in Figure S4b in the Supporting Information). Most importantly, both systems were carefully chosen to have an optical scattering peak at ≈700 nm (when covered with PMMA films or SP-doped PMMA films) that can match the fluorescence rather than the absorption of MC molecules (Figure 3a,b). This peak wavelength can avoid the influence from the fluorescence enhancement by the plasmon-induced excitation enhancement and resonance energy transfer.[10,38] Moreover, this particular aggregate was selected because it shows the largest fluorescence enhancement during repeated measurements. It is also worth mentioning that the energy bandgap of ISC is smaller than that of the molecule's emission, as shown in Figure 1b. Since the LSPR bands of AuNS aggregates and AuNTs match the emission band of the molecules, there is also a mismatch between the energy bands of LSPRs and ISC. Therefore, the influence from LSPRs on the ISC process is weak.
Figure 3.
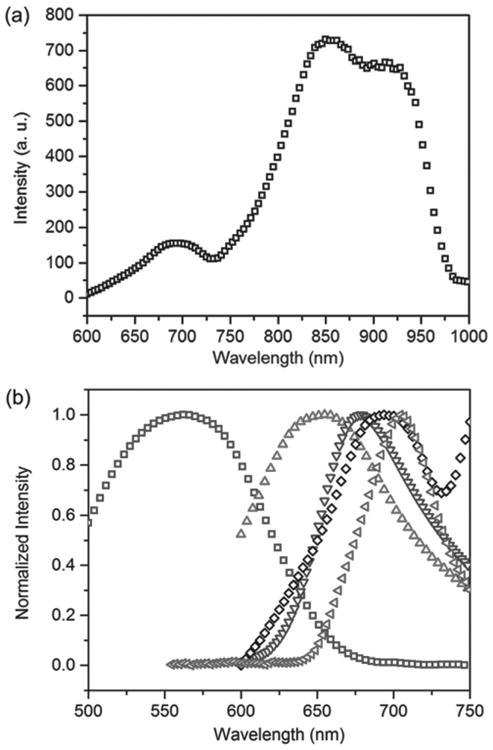
a) Scattering spectrum of an AuNS aggregate covered with a pure PMMA film. b) Normalized scattering spectra of the AuNS aggregate (black diamonds) and a single AuNT (green triangles); fluorescence spectra of the as-prepared sample (red triangles) and the sample after UV irradiation (purple triangles); and absorption spectrum of the sample after UV irradiation (blue squares). The cutoff of some of the spectra in (b) is due to the limited working range of the grating in our spectrometer.
The dark-field scattering spectrum of the AuNS aggregate in Figure 3a (see the SEM image in the inset of Figure 4a) displays three scattering peaks. In order to identify the plasmonic mode of each peak, we conducted finite-difference time-domain (FDTD) calculations to simulate the scattering spectrum of an AuNS aggregate covered by PMMA, as shown in Figure 4. The E-field distribution of the simulated scattering peak at 700 nm (Figure 4c) indicates that the experimentally measured scattering peak at 695 nm is derived from the gap plasmon mode between two nearby AuNSs along the y axis. It can also be seen that the scattering peaks at 630, 854, and 915 nm arise from the plasmon gap mode along the x axis, the near-field coupling between two AuNSs along the x axis, and the near-field coupling among three AuNSs along the y axis, respectively. Figure 4b shows the simulated scattering spectrum of the AuNT when the polarization of the incident light is along one side of the AuNT. The scattering peak wavelength matches well our experimental spectrum (green triangles' curve in Figure 3b and scattering spectra in Figure S5 in the Supporting Information), which arises from the plasmon dipole mode. Figure 4e,f illustrates the absolute E-field distributions of the AuNS aggregate and the AuNT, respectively. From the absolute E-field distributions, we know the E-field enhancement near the AuNS aggregate is 50–60 times larger than that near the single AuNT.
Figure 4.
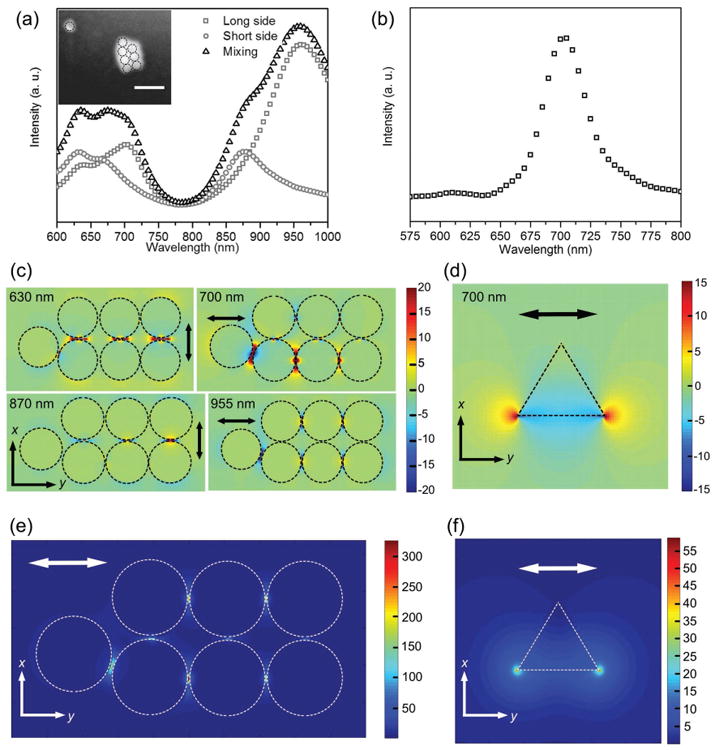
a) Simulated scattering spectra of an AuNS aggregate under different polarizations of incident light. SEM image in inset shows an AuNS aggregate and a single AuNS. The dashed circles indicate the AuNSs. b) Simulated scattering spectrum of a single AuNT. c) x components and y components of E-field distributions, which indicate gap dipole modes of the AuNS aggregate at 630 and 700 nm, and dipole modes of the AuNS aggregate at 870 and 955 nm. d) E-field distribution of the dipole mode of the AuNT at 700 nm. e) Absolute E-field distribution of the AuNS aggregate at 700 nm. f) Absolute E-field distribution of the AuNT at 700 nm. The double-headed arrows show the polarization of the incident light.
The broad absorption spectrum (blue square) in Figure 3b is likely attributed to different stereoisomers of trans-MC (Figure S6, Supporting Information), which were created by UV irradiation. As presented in Table S1 (Supporting Information), there is a small energy difference (<0.1 eV) between the stereoisomers, and their absorption peak wavelengths (λmax), varying by 20–25 nm depending on the exchange-correlation function employed in density functional theory (DFT) calculations. We also considered the possibility that MC molecules may exist in both nonpolar quinoidal and dipolar zwitterionic states, depending on the polarization of the local environment. However, the influence of polarization on λmax (e.g., Δλmax ≈ 10 nm, when the dielectric constant changes from 4 to 78.4, as shown in Table S3 in the Supporting Information) is found to be not as significant as that of isomerization; this implies that the absorption spectra due to the quinoidal and zwitterionic MC forms, even if they coexist in our samples, would be hard to distinguish.
Figure 5a illustrates the large photoswitchable fluorescence from SP molecules near an AuNS aggregate. After UV irradiation, the emission peak at 675 nm matches the fluorescence peak of zwitterionic MC (purple triangles' curve in Figure 3b) and has a higher intensity than that of the zwitterionic MC and the scattering peak of the AuNS aggregate at 695 nm (Figure 3a). The integrated intensity of the enhanced fluorescence from the hybrid is ≈32 times that of pure MC molecules. To avoid interference with scattering peaks at longer wavelengths (Figure 3a), the integration is limited to a wavelength range from 600 to 725 nm. In contrast, the integrated intensity of the fluorescence (with removal of pure scattering by the AuNS aggregate) from the hybrid after green light radiation, is only 1.3 times that of pure MC molecules (Figure 5b, curve of green squares). Therefore, no obvious fluorescence enhancement or quenching is observed for the quinoidal MC form. The fluorescence enhancements obtained from the molecules near five different AuNS aggregates that exhibit LSPR bands overlapping the fluorescence band of MC molecules are listed in Table 1. Not all AuNS aggregates lead to an equally large fluorescence enhancement. The enhancement differences cannot be attributed to the relative orientation of molecules with respect to AuNS aggregates because there are a large number of randomly oriented molecules near the AuNS aggregates; however, it may arise from the difference in the total number of molecules at plasmonic hot spots, since the number and size of hot spots vary for different AuNS aggregates.
Figure 5.
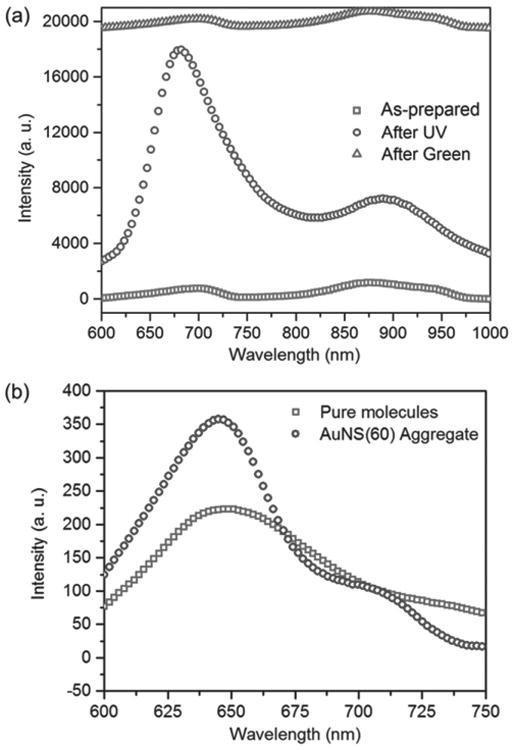
a) Large photoswitchable fluorescence enhancement from a hybrid containing MC molecules and an AuNS aggregate. The intensity-axis offset is added for clarity. b) Fluorescence spectra measured near (blue circles) and far away (green squares) from the AuNS aggregate covered by the SP-doped PMMA film after green light irradiation. The fluorescence spectrum of molecules near the AuNS aggregate is obtained by removing the scattering by the AuNS aggregate.
Table 1.
Comparison between the fluorescence enhancements near single AuNS aggregates and single AuNTs.
| Single AuNS aggregate | Enhancement rate | Single AuNT | Enhancement rate |
|---|---|---|---|
| Aggregate 1 | 31.7 | AuNT 1 | 1.3 |
| Aggregate 2 | 15.4 | AuNT 2 | 1.6 |
| Aggregate 3 | 3.9 | AuNT 3 | 1.1 |
| Aggregate 4 | 7.5 | AuNT 4 | 0.8 |
| Aggregate 5 | 3.3 | AuNT 5 | 1.3 |
For the sample consisting of AuNTs covered by a molecule-doped PMMA film, two peaks appear in the dark-field optical spectra of a single AuNT (Figure 6a). By removing the scattering signal from the pure AuNT (Figure 6b), we obtain the fluorescence signals from the molecules near the AuNT (Figure 6c). No obvious fluorescence enhancement is observed for the molecules near the AuNT when compared to the molecules without the AuNT in Figure 5d. The fluorescence enhancement factors for the molecules near five different AuNTs are listed in Table 1. All the enhancement factors are close to 1.
Figure 6.
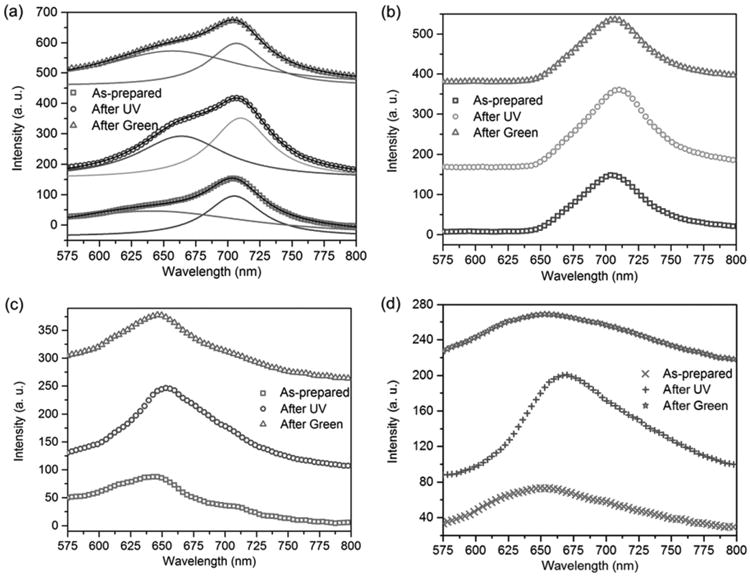
a) Dark-field optical spectra of a single AuNT covered by an SP-doped PMMA film under different light irradiation. The solid lines were obtained by fitting the dark-field spectra into two Lorentzian peaks. The peak wavelengths of the fitted blue, orange, and pink solid lines match those in the scattering spectra in (b). The peak wavelengths of red, purple, and green solid lines are close to the fluorescence peak wavelengths of the pure molecules as shown in (d). b) Scattering spectra of the same single AuNT as in (a), under different light irradiation. The scattering spectra were obtained by blocking the fluorescence of molecules with a 665 long pass filter, because the absorption peak of zwitterionic MC molecules is at 560 nm (Figure 3b). The slight redshift of the scattering peak after UV irradiation can be explained by a change in the refractive index around the AuNT since zwitterionic MC molecules have a larger refractive index than SP molecules. c) Fluorescence spectra of molecules near the same AuNT as in (a) under different light irradiation. These spectra were acquired by subtracting the scattering spectra in (b) from the dark-field spectra in (a). d) Fluorescence spectra of molecules away from AuNTs under different light irradiation in the same sample. The intensity-axis offset is added for clarity.
To clarify why the large fluorescence enhancement of zwitterionic MC molecules occurs near AuNS aggregates rather than near AuNTs, we explore the difference in the radiative decay rate enhancements between these two systems and assume . Since kr ∝ |Ep(r0)|2, we can further assume (for the nth molecule near the plasmonic nanostructure), where αn is a constant determined by the relative orientation of the nth molecule to the plasmonic nanostructure, En is the intensity of the enhanced E-field at the nth molecule, and A is a constant determined by the type of molecule. The fluorescence enhancement factor is obtained from the integrated fluorescence intensity of molecules at the AuNS aggregate (or AuNT) divided by that of the pure molecules, which is an average signal from the whole measured region. Accordingly, we compare the average emission rate enhancement: , where n is the number of molecules in all hot spots and m is the total number of molecules in the measured region. For the randomly distributed molecules (i.e., the effect of αnA is negligible), the square of E-field intensity ( ) increases by several orders of magnitude when n is much smaller than m, leading to an obvious fluorescence enhancement. Because the molecules located at the hot spots of AuNS aggregates and those of AuNTs only account for a small fraction of the total number of the molecules in the measured areas, our observation of fluorescence enhancement of zwitterionic MC molecules near AuNS aggregates rather than near AuNTs suggests that the E-field enhancement by the AuNS aggregates is larger than that by the AuNTs.
In fact, surface-enhanced Raman scattering studies have demonstrated that the E-field enhancement by gap plasmonic modes at plasmonic NP aggregates can be significantly larger than that of single AuNTs. [50-54] Our FDTD simulations also show that the E-field of gap modes in the AuNS aggregate can be 50–60 times larger than that at single AuNTs (Figure 4a,b). This larger E-field enhancement at the interparticle gaps of the AuNS aggregate leads to a larger (2500–3600 times) emission rate enhancement of zwitterionic MC. Thus, we conclude that the large fluorescence enhancement arises from the large E-field at the AuNS aggregates. However, the large E-field cannot explain the observed photoswitchable fluorescence near the AuNS aggregates. To elucidate the physical principle of the photoswitchable fluorescence, we further explore the difference in fluorescence QY between the zwitterionic MC and quinoidal MC molecules near plasmonic nanostructures.
We assume that the MC molecule is a classic dipole and the nonradiative rate is determined by Ohmic loss in the environment:[9]
| (6) |
where γ0 is the free-space decay rate, P0 is the power emitted by the MC molecule, and Em is the E-field emitted by the molecule. For our molecule–plasmon hybrid nanostructures, Em equates E0m + Ep(r0), where E0m is the E-field emitted by the molecule without plasmonic nanostructures. When Ep(r0) is much larger than E0m because , we obtain:
| (7) |
According to Equations (6) and (7), we assume that the radiative rate and nonradiative rate of molecules near the AuNT be and , respectively βn is a constant determined by the relative orientation of the nth molecule to the plasmonic nanostructure and B is a constant determined by the type of the molecule. En depends on the type of plasmonic nanostructures and the degree of the spectral overlap between the LSPRs and the molecular fluorescence. We further denote E1,n as En for zwitterionic MC molecules near the AuNT, E2,n as En for zwitterionic MC molecules near the AuNS aggregate, E3,n as En for quinoidal MC molecules near the AuNT, and E4,n as En for quinoidal MC molecules near the AuNS aggregate.
Based on Equations (1) and (2), we define the average QY of zwitterionic MC molecules near the AuNT (ϕ̄NT) and near the AuNS aggregate (ϕ̄Agg), and the average QY of quinoidal MC molecules near the AuNT ( ) and near the AuNS aggregate ( ) as:
| (8) |
| (9) |
| (10) |
and,
| (11) |
where ᾱNT and β̄NT are the average α and β of molecules near the AuNT; ᾱAgg and β̄Agg are the average α and β of molecules near the AuNS aggregate; and , , , and . Since no obvious enhancement or quenching was observed for quinoidal MC molecules near the AuNT and AuNS aggregate, we assume , which leads to ᾱNT ≈ ᾱAgg and β̄NT ≈ β̄Agg. From Equations (8) and (9), we know that, if is large, fluorescence QY can be significantly increased when the E-field is strongly increased. This QY increase indicates that, even if the plasmon-induced nonradiative rate enhancement is equivalent to the plasmon-induced radiative rate enhancement, a large fluorescence enhancement can be still obtained due to the large ISC rate. Moreover, the fluorescence can be tuned by controlling the ISC rate.
We further investigated the fluorescence lifetime of zwitterionic MC molecules at single AuNS aggregates. We employed fluorescence lifetime imaging microscopy (FLIM) to achieve single-nanostructure resolution (see detailed information in the Experimental Section).[38,55] As a control experiment, the FLIM image of MC-doped PMMA film without AuNSs is shown in Figure 7a. The image was taken after UV irradiation of the film, which reveals that the zwitterionic MC molecules in the PMMA film have a fluorescence lifetime of ≈400 ps. The FLIM image of MC-doped PMMA film that covers 60 nm AuNSs is shown in Figure 7b. Most parts of the MC-doped PMMA film have a fluorescence lifetime of ≈400 ps, while some regions have a reduced fluorescence lifetime down to ≈150 ps. The regions with shorter lifetimes contain the AuNS aggregates, which are confirmed by SEM (Figure 7b). Two examples of the AuNS aggregates are marked by black dashed rectangles in Figure 7b. Figure 7c shows the dark-field optical microscopy image of the same sample covered with a pure PMMA film. By comparing the dark-field optical image with the FLIM image, we conclude that the fluorescence signals of reduced lifetime are obtained from the larger orange spots with the stronger optical scattering in the dark-field optical image. In addition, green spots with weaker scattering in the dark-field optical image are individual 60 nm AuNSs, which have an LSPR peak wavelength around 545 nm (Figure S7, Supporting Information). We verified the individual AuNSs by an SEM image shown in the green dashed rectangle. No obvious reduction of lifetime occurs at the green spots, meaning that the reduced fluorescence lifetime of zwitterionic MC molecules at the aggregates arises from the strong E-field enhancement at interparticle gaps. Since fluorescence lifetime is , the lifetime measurements indicate that the average kr is less than 3. Since both γr and γnr increase with E-field enhancement, Equations (1) and (9) indicate that, without changes in γ ISC, the fluorescence QY enhancement is smaller than kr Therefore, the QY enhancement (as listed in Table 1) larger than kr proves that the ISC in zwitterionic MC molecules can further enhance the fluorescence when the E-field enhancement is large.
Figure 7.
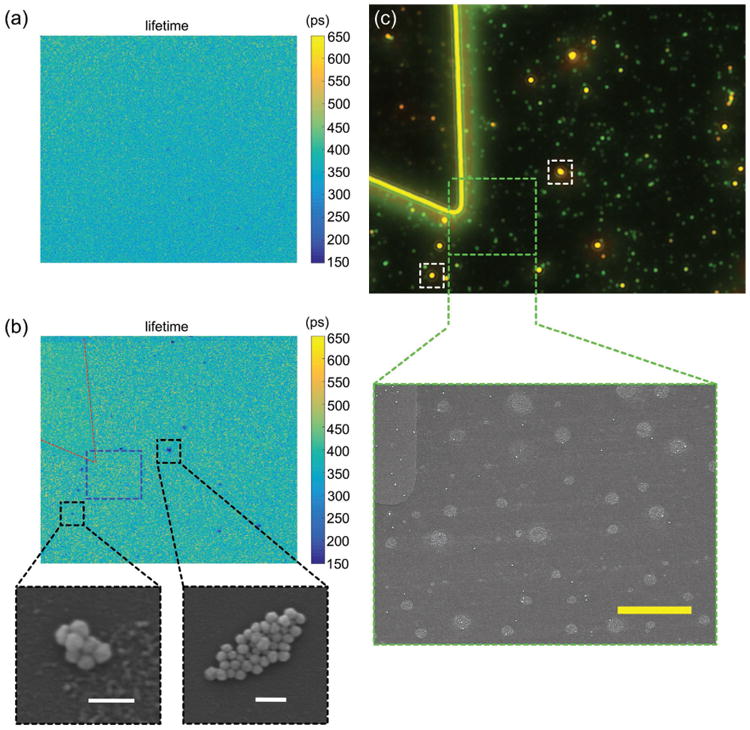
a) FLIM image of MC-doped PMMA film without AuNSs after UV irradiation. b) FLIM image of MC-doped PMMA film with 60 nm AuNSs after UV irradiation. SEM images of AuNS aggregates obtained from the spots of the shorter lifetime in the black dashed rectangles. Red dashed lines outline the position of the marker. c) Dark-field optical image of the same area of the sample as shown in (b). SEM image is obtained from the area indicated by the green dashed rectangle, which corresponds to the blue dashed rectangle in the FLIM image of (b). The white dashed rectangles correspond to the black dashed rectangles in the FLIM image of (b). The large circular regions with light color in the SEM image are residual PMMA on the glass substrate. White scale bars in SEM image of (b) are 200 nm and yellow scale bar in SEM image of (c) is 5 μm.
3. Conclusion
In summary, we elucidate how ISC influences the plasmon-enhanced fluorescence based on hybrid systems of plasmonic nanostructures and SP-derived MC molecules. Due to the high ISC rate, a large fluorescence enhancement can be obtained even if the plasmon-induced nonradiative rate enhancement is equivalent to the plasmon-induced radiative rate enhancement. The ISC-mediated fluorescence enhancement by the plasmonic nanostructures represents a new phenomenon in molecular plasmonics, which provides a new insight into how to select and design molecule–plasmon hybrid nanostructures to obtain a large plasmon-induced fluorescence enhancement. In addition, spiropyran and merocyanine molecules are sensitive to external stimuli and environmental changes, such as light with different wavelengths, temperature changes, and pH changes. Therefore, we propose that ISC-mediated fluorescence enhancement can be used for applications such as optical modulators, optical switches, bio-sensing, and bioimaging.[32,39,56-58]
4. Experimental Section
Sample Preparation
AuNSs (Sigma-Aldrich) with a diameter of 60 nm and AuNTs of variable sizes[37] were drop-coated on microscope calibration slides (AmScope) and dried naturally. Chlorobenzene (Fisher Scientific) was used to dissolve SP (Sigma-Aldrich) and PMMA (Sigma-Aldrich) with a weight ratio of 2:1 (SP:PMMA) to prepare PMMA films with a high concentration of SP molecules (8 wt%). A spin coater (Laurell Technologies) was employed to create SP-doped PMMA films on microscope slides with AuNSs or AuNTs. The spin coater was run with a speed of 2000 revolutions per minute for 1 min.
Optical Measurements
The optical scattering spectra and the white-light-excited fluorescence of MC molecules were measured via a dark-field optical microscope (Ti-E inverted microscope, Nikon) with a halogen white light source (12 V, 100 W). UV light and green light were obtained by a mercury light source (C-HGFIE, power: 130 W, Nikon) with excitation filters (DAPI Shift Filter set, excitation: 358 nm; TRITC HYQ Shift Filter set, excitation: 530–560 nm). Microscope calibration slides with markers were used to locate individual AuNS aggregates and AuNTs. The UV or green light (irradiation time was 1 min) was applied to convert molecules from SP to MC isomers or from MC to SP isomers. An oil-immersion dark-field condenser in conjunction with 100× objective was used for single-particle and single-aggregate spectroscopy. Scanning electron microscopy (S5500, Hitachi) and transmission electron microscopy (JEM1400PLUS, JEOL) were used to measure the morphology of AuNS aggregates and AuNTs.
Temperature Measurement
A thermometer was used to measure the temperature increase at the samples due to the photothermal effects. Upon irradiation with white light, the sample temperature increased from 22 to 31 °C within 2 min. The supply voltage of the white light source was 6 V. It should be noted that the thermometer was directly placed under the white light source and the head of thermometer is much larger than the irradiated spot in the dark-field optical measurement. Therefore, it was believed that the actual temperature increase rate was faster than the measured value.
FDTD Simulation
A commercially available software package (FDTD Solutions, Lumerical) was employed to conduct the FDTD simulations. The AuNSs and AuNT were positioned at the top of a glass substrate (modeled with refractive index n = 1.4). The refractive index of background environment was set as 1.49 to represent the PMMA films. A plane wave was applied as the incident light source, and the scattered light was collected in transmission mode to obtain the optical scattering spectra. The wavelength-dependent dielectric functions of Au were adapted from Johnson and Christy. [59]
DFT Simulation
All of the density functional theory (DFT) calculations reported herein were performed using the Gaussian 09 suite of programs.[60] Semi-local Perdew–Bruke–Ernzhof (PBE)[61] and hybrid Becke 3-Lee-Yang-Parr (B3LYP)[62] exchange-correlation functionals were both considered for comparison. The 6-311G(d,p) and 6-311+G(2d,p) basis sets were employed respectively for the calculations of atomic configurations (and their relative stabilities) and vertical excitation energies. The environment of the molecule within a PMMA matrix was described using the integral equation formalism-polarizable continuum model (IEF-PCM). [63]
Fluorescence Lifetime Imaging Microscopy
A femtosecond titanium:sapphire laser tuned to 800 nm (≈ 200 fs) (Mira 900, Coherent), galvo scanning mirrors (6215H, Cambridge Tech.), and a GaAsP photomultiplier tube (PMT) (H7422PA-40, Hamamatsu) in non-descanned detection scheme were utilized to constitute the FLIM setup. Before the signal reached the photon counting board (SPC-150, Becker and Hickl GmbH), a preamplifier (HFAC-26, Becker and Hickl GmbH) was used to amplify the output current of the PMT. The average laser power, time correlated single photon counting (TCSPC) bin resolution, and FLIM pixel integration time were set to 4 mW, 20 ps, and 5 ms, respectively, when recording the fluorescence lifetime. A least squares' method using a model of a single exponential decay was then used to fit the fluorescence lifetime.[64]
Supplementary Material
Acknowledgments
The authors acknowledge the financial support of the Office of Naval Research Young Investigator Program (N00014-17-1-2424), the R. A. Welch Foundation (No. F-1535) and the MINECO (project MAT2013-46101-R).
Footnotes
Supporting Information: Supporting Information is available from the Wiley Online Library or from the author.
Conflict of Interest: The authors declare no conflict of interest.
Contributor Information
Mingsong Wang, Department of Mechanical Engineering, Texas Materials Institute, The University of Texas at Austin, Austin, TX 78712, USA.
Gregory Hartmann, Department of Chemical Engineering, The University of Texas at Austin, Austin, TX 78712, USA.
Zilong Wu, Department of Mechanical Engineering, Texas Materials Institute, The University of Texas at Austin, Austin, TX 78712, USA.
Leonardo Scarabelli, Bionanoplasmonics Laboratory, CIC biomaGUNE, Paseo de Miramón 182, 20014 Donostia–San Sebastián, Spain; Department of Chemistry and Biochemistry, California NanoSystems Institute, University of California, Los Angeles, Los Angeles, CA 90095, USA
Bharath Bangalore Rajeeva, Department of Mechanical Engineering, Texas Materials Institute, The University of Texas at Austin, Austin, TX 78712, USA.
Jeremy W. Jarrett, Department of Biomedical Engineering, The University of Texas at Austin, Austin, TX 78712, USA
Evan P. Perillo, Department of Biomedical Engineering, The University of Texas at Austin, Austin, TX 78712, USA
Prof. Andrew K. Dunn, Department of Biomedical Engineering, The University of Texas at Austin, Austin, TX 78712, USA
Prof. Luis M. Liz-Marzán, Bionanoplasmonics Laboratory, CIC biomaGUNE, Paseo de Miramón 182, 20014 Donostia–San Sebastián, Spain; Ikerbasque, Basque Foundation for Science, 48013 Bilbao, Spain; Biomedical Research Networking Center in Bioengineering, Biomaterials, and Nanomedicine, CIBER-BBN, 20014 Donostia-San Sebastián, Spain
Prof. Gyeong S. Hwang, Department of Chemical Engineering, The University of Texas at Austin, Austin, TX 78712, USA
Prof. Yuebing Zheng, Department of Mechanical Engineering, Texas Materials Institute, The University of Texas at Austin, Austin, TX 78712, USA
References
- 1.Noda S, Fujita M, Asano T. Nat Photonics. 2007;1:449. [Google Scholar]
- 2.Lakowicz JR. Anal Biochem. 2005;337:171. doi: 10.1016/j.ab.2004.11.026. [DOI] [PMC free article] [PubMed] [Google Scholar]
- 3.Pelton M. Nat Photonics. 2015;9:427. [Google Scholar]
- 4.Cang H, Liu Y, Wang Y, Yin X, Zhang X. Nano Lett. 2013;13:5949. doi: 10.1021/nl403047m. [DOI] [PubMed] [Google Scholar]
- 5.Lodahl P, Floris van Driel A, Nikolaev IS, Irman A, Overgaag K, Vanmaekelbergh D, Vos WL. Nature. 2004;430:654. doi: 10.1038/nature02772. [DOI] [PubMed] [Google Scholar]
- 6.Song JH, Atay T, Shi S, Urabe H, Nurmikko AV. Nano Lett. 2005;5:1557. doi: 10.1021/nl050813r. [DOI] [PubMed] [Google Scholar]
- 7.Belacel C, Habert B, Bigourdan F, Marquier F, Hugonin JP, Michaelis de Vasconcellos S, Lafosse X, Coolen L, Schwob C, Javaux C, Dubertret B, Greffet JJ, Senellart P, Maitre A. Nano Lett. 2013;13:1516. doi: 10.1021/nl3046602. [DOI] [PubMed] [Google Scholar]
- 8.Purcell EM, Torrey HC, Pound RV. Phys Rev. 1946;69:37. [Google Scholar]
- 9.Anger P, Bharadwaj P, Novotny L. Phys Rev Lett. 2006;96:113002. doi: 10.1103/PhysRevLett.96.113002. [DOI] [PubMed] [Google Scholar]
- 10.Kühn S, Håkanson U, Rogobete L, Sandoghdar V. Phys Rev Lett. 2006;97:017402. doi: 10.1103/PhysRevLett.97.017402. [DOI] [PubMed] [Google Scholar]
- 11.Akselrod GM, Argyropoulos C, Hoang TB, Ciracì C, Fang C, Huang J, Smith DR, Mikkelsen MH. Nat Photonics. 2014;8:835. [Google Scholar]
- 12.Rose A, Hoang TB, McGuire F, Mock JJ, Ciracì C, Smith DR, Mikkelsen MH. Nano Lett. 2014;14:4797. doi: 10.1021/nl501976f. [DOI] [PubMed] [Google Scholar]
- 13.Tovmachenko OG, Graf C, van den Heuvel DJ, van Blaaderen A, Gerritsen HC. Adv Mater. 2006;18:91. [Google Scholar]
- 14.Bardhan R, Grady NK, Cole JR, Joshi A, Halas NJ. ACS Nano. 2009;3:744. doi: 10.1021/nn900001q. [DOI] [PubMed] [Google Scholar]
- 15.Fujita M, Takahashi S, Tanaka Y, Asano T, Noda S. Science. 2005;308:1296. doi: 10.1126/science.1110417. [DOI] [PubMed] [Google Scholar]
- 16.Chen H, Shao L, Li Q, Wang J. Chem Soc Rev. 2013;42:2679. doi: 10.1039/c2cs35367a. [DOI] [PubMed] [Google Scholar]
- 17.Eustis S, El-Sayed MA. Chem Soc Rev. 2006;35:209. doi: 10.1039/b514191e. [DOI] [PubMed] [Google Scholar]
- 18.Halas NJ, Lal S, Chang WS, Link S, Nordlander P. Chem Rev. 2011;111:3913. doi: 10.1021/cr200061k. [DOI] [PubMed] [Google Scholar]
- 19.Ming T, Chen H, Jiang R, Li Q, Wang J. J Phys Chem Lett. 2012;3:191. [Google Scholar]
- 20.Gandra N, Portz C, Tian L, Tang R, Xu B, Achilefu S, Singamaneni S. Angew Chem Int Ed. 2014;53:866. doi: 10.1002/anie.201308516. [DOI] [PMC free article] [PubMed] [Google Scholar]
- 21.Ayala-Orozco C, Liu JG, Knight MW, Wang Y, Day JK, Nordlander P, Halas NJ. Nano Lett. 2014;14:2926. doi: 10.1021/nl501027j. [DOI] [PMC free article] [PubMed] [Google Scholar]
- 22.Tam F, Goodrich GP, Johnson BR, Halas NJ. Nano Lett. 2007;7:496. doi: 10.1021/nl062901x. [DOI] [PubMed] [Google Scholar]
- 23.Giannini V, Fernández-Domínguez AI, Heck SC, Maier SA. Chem Rev. 2011;111:3888. doi: 10.1021/cr1002672. [DOI] [PubMed] [Google Scholar]
- 24.Gu Y, Wang L, Ren P, Zhang J, Zhang T, Martin OJF, Gong Q. Nano Lett. 2012;12:2488. doi: 10.1021/nl300655n. [DOI] [PubMed] [Google Scholar]
- 25.Ming T, Zhao L, Chen H, Woo KC, Wang J, Lin HQ. Nano Lett. 2011;11:2296. doi: 10.1021/nl200535y. [DOI] [PubMed] [Google Scholar]
- 26.Holzmeister P, Pibiri E, Schmied JJ, Sen T, Acuna GP, Tinnefeld P. Nat Commun. 2014;5:5356. doi: 10.1038/ncomms6356. [DOI] [PMC free article] [PubMed] [Google Scholar]
- 27.Fu Y, Zhang J, Lakowicz JR. J Am Chem Soc. 2010;132:5540. doi: 10.1021/ja9096237. [DOI] [PMC free article] [PubMed] [Google Scholar]
- 28.Ming T, Zhao L, Yang Z, Chen H, Sun L, Wang J, Yan C. Nano Lett. 2009;9:3896. doi: 10.1021/nl902095q. [DOI] [PubMed] [Google Scholar]
- 29.Kinkhabwala A, Yu Z, Fan S, Avlasevich Y, Mullen K, Moerner WE. Nat Photonics. 2009;3:654. [Google Scholar]
- 30.Gorner H. Phys Chem Chem Phys. 2001;3:416. [Google Scholar]
- 31.Chibisov AK, Görner H. J Photochem Photobiol, A. 1997;105:261. [Google Scholar]
- 32.Klajn R. Chem Soc Rev. 2014;43:148. doi: 10.1039/c3cs60181a. [DOI] [PubMed] [Google Scholar]
- 33.Ming T, Zhao L, Xiao M, Wang J. Small. 2010;6:2514. doi: 10.1002/smll.201000920. [DOI] [PubMed] [Google Scholar]
- 34.Kita F, Adam W, Jordan P, Nau WM, Wirz J. J Am Chem Soc. 1999;121:9265. [Google Scholar]
- 35.Cogan S, Haas Y, Zilberg S, Photochem J. Photobiol, A. 2007;190:200. [Google Scholar]
- 36.Salem L, Rowland C. Angew Chem Int Ed. 1972;11:92. [Google Scholar]
- 37.Scarabelli L, Coronado-Puchau M, Giner-Casares JJ, Langer J, Liz-Marzán LM. ACS Nano. 2014;8:5833. doi: 10.1021/nn500727w. [DOI] [PubMed] [Google Scholar]
- 38.Wang M, Bangalore Rajeeva B, Scarabelli L, Perillo EP, Dunn AK, Liz-Marzán LM, Zheng Y. J Phys Chem C. 2016;120:14820. doi: 10.1021/acs.jpcc.6b04205. [DOI] [PMC free article] [PubMed] [Google Scholar]
- 39.Zhu MQ, Zhu L, Han JJ, Wu W, Hurst JK, Li ADQ. J Am Chem Soc. 2006;128:4303. doi: 10.1021/ja0567642. [DOI] [PMC free article] [PubMed] [Google Scholar]
- 40.Xue Y, Tian J, Tian W, Gong P, Dai J, Wang X. J Phys Chem C. 2015;119:20762. [Google Scholar]
- 41.Tian W, Tian J. Langmuir. 2014;30:3223. doi: 10.1021/la404628p. [DOI] [PubMed] [Google Scholar]
- 42.Song X, Zhou J, Li Y, Tang Y. J Photochem Photobiol, A. 1995;92:99. [Google Scholar]
- 43.Wu Y, Sasaki T, Kazushi K, Seo T, Sakurai K. J Phys Chem B. 2008;112:7530. doi: 10.1021/jp800957c. [DOI] [PubMed] [Google Scholar]
- 44.Rosario R, Gust D, Hayes M, Springer J, Garcia AA. Langmuir. 2003;19:8801. [Google Scholar]
- 45.Wojtyk JTC, Wasey A, Kazmaier PM, Hoz S, Buncel E. J Phys Chem A. 2000;104:9046. [Google Scholar]
- 46.Bharadwaj P, Novotny L. Opt Express. 2007;15:14266. doi: 10.1364/oe.15.014266. [DOI] [PubMed] [Google Scholar]
- 47.Xiong Y, McLellan JM, Chen J, Yin Y, Li ZY, Xia Y. J Am Chem Soc. 2005;127:17118. doi: 10.1021/ja056498s. [DOI] [PubMed] [Google Scholar]
- 48.Rycenga M, Camargo PHC, Li W, Moran CH, Xia Y. J Phys Chem Lett. 2010;1:696. doi: 10.1021/jz900286a. [DOI] [PMC free article] [PubMed] [Google Scholar]
- 49.Sun Y, Xia Y. Science. 2002;298:2176. doi: 10.1126/science.1077229. [DOI] [PubMed] [Google Scholar]
- 50.Wustholz KL, Henry AI, McMahon JM, Freeman RG, Valley N, Piotti ME, Natan MJ, Schatz GC, Duyne RPV. J Am Chem Soc. 2010;132:10903. doi: 10.1021/ja104174m. [DOI] [PubMed] [Google Scholar]
- 51.Kleinman SL, Sharma B, Blaber MG, Henry AI, Valley N, Freeman RG, Natan MJ, Schatz GC, Van Duyne RP. J Am Chem Soc. 2013;135:301. doi: 10.1021/ja309300d. [DOI] [PubMed] [Google Scholar]
- 52.Kleinman SL, Frontiera RR, Henry AI, Dieringer JA, Van Duyne RP. Phys Chem Chem Phys. 2013;15:21. doi: 10.1039/c2cp42598j. [DOI] [PubMed] [Google Scholar]
- 53.Camden JP, Dieringer JA, Wang Y, Masiello DJ, Marks LD, Schatz GC, Van Duyne RP. J Am Chem Soc. 2008;130:12616. doi: 10.1021/ja8051427. [DOI] [PubMed] [Google Scholar]
- 54.Pazos-Perez N, Wagner CS, Romo-Herrera JM, Liz-Marzán LM, García de Abajo FJ, Wittemann A, Fery A, Alvarez-Puebla RA. Angew Chem Int Ed. 2012;51:12688. doi: 10.1002/anie.201207019. [DOI] [PMC free article] [PubMed] [Google Scholar]
- 55.Perillo EP, Liu YL, Huynh K, Liu C, Chou CK, Hung MC, Yeh HC, Dunn AK. Nat Commun. 2015;6:7874. doi: 10.1038/ncomms8874. [DOI] [PMC free article] [PubMed] [Google Scholar]
- 56.Zhu MQ, Zhang GF, Li C, Aldred MP, Chang E, Drezek RA, Li ADQ. J Am Chem Soc. 2011;133:365. doi: 10.1021/ja106895k. [DOI] [PubMed] [Google Scholar]
- 57.Zhu MQ, Zhang GF, Hu Z, Aldred MP, Li C, Gong WL, Chen T, Huang ZL, Liu S. Macromolecules. 014;247:1543. [Google Scholar]
- 58.Berkovic G, Krongauz V, Weiss V. Chem Rev. 2000;100:1741. doi: 10.1021/cr9800715. [DOI] [PubMed] [Google Scholar]
- 59.Johnson PB, Christy RW. Phys Rev B. 1972;6:4370. [Google Scholar]
- 60.Frisch GWTMJ, Schlegel HB, Scuseria GE, Robb MA, Cheeseman JR, Scalmani G, Barone V, Mennucci B, Petersson GA, Nakatsuji H, Caricato M, Li X, Hratchian HP, Izmaylov AF, Bloino J, Zheng G, Sonnenberg JL, Hada M, Ehara M, Toyota K, Fukuda R, Hasegawa J, Ishida M, Nakajima T, Honda Y, Kitao O, Nakai H, Vreven T, Montgomery JA, Peralta JE, Ogliaro F, Bearpark M, Heyd JJ, Brothers E, Kudin KN, Staroverov VN, Keith T, Kobayashi R, Normald J, Raghavachari K, Rendell A, Burant JC, Iyengar SS, Tomasi J, Cossi M, Rega N, Millam JM, Klene M, Knox JE, Cross JB, Bakken V, Adamo C, Jaramillo J, Gomperts R, Stratmann RE, Yazyev O, Austin AJ, Cammi R, Pomelli C, Ochterski JW, Martin RL, Morokuma K, Zakrzewski VG, Voth GA, Salvador P, Dannenberg JJ, Dapprich S, Daniels AD, Farkas O, Foresman JB, Ortiz JV, Cioslowskiand J, Fox DJ. Gaussian 09 Revision C.01. Gaussian, Inc; Wallingord, CT: 2010. [Google Scholar]
- 61.Perdew JP, Burke K, Ernzerhof M. Phys Rev Lett. 1996;77:3865. doi: 10.1103/PhysRevLett.77.3865. [DOI] [PubMed] [Google Scholar]
- 62.Becke AD. J Chem Phys. 1993;98:5648. [Google Scholar]
- 63.Mennucci B, Cancès E, Tomasi J. J Phys Chem B. 1997;101:10506. [Google Scholar]
- 64.Warren SC, Margineanu A, Alibhai D, Kelly DJ, Talbot C, Alexandrov Y, Munro I, Katan M, Dunsby C, French PMW. PLoS One. 2013;8:e70687. doi: 10.1371/journal.pone.0070687. [DOI] [PMC free article] [PubMed] [Google Scholar]
Associated Data
This section collects any data citations, data availability statements, or supplementary materials included in this article.