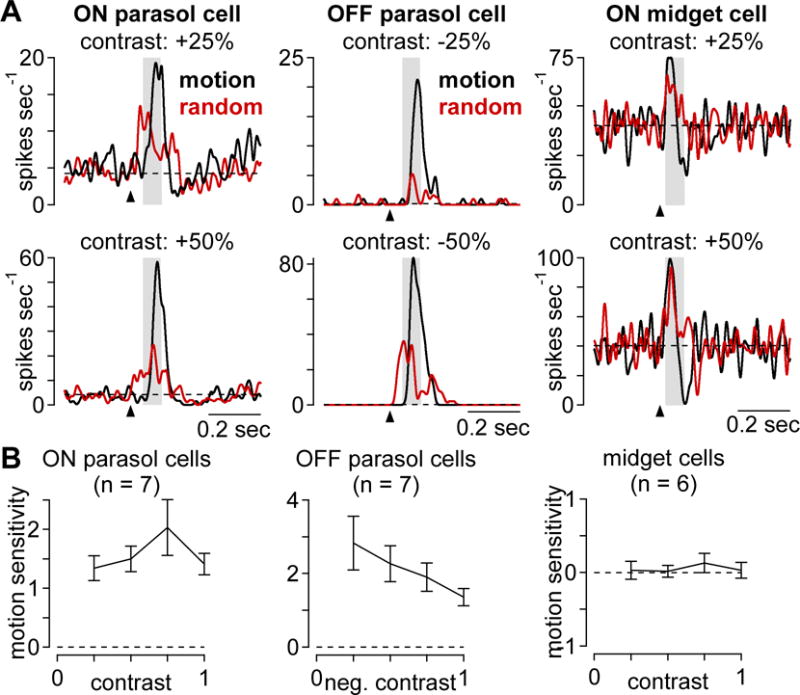
Figure 3.

Motion sensitivity persists across a range of stimulus contrasts. (A) Example spike responses to the apparent-motion (black) and random-bar sequences (red) at 25% and 50% contrast. Arrow indicates stimulus onset and shaded region indicates sampling window. (B) Motion sensitivity values as function of contrast for ON parasol (n = 7), OFF parasol (n = 7), and midget ganglion cells (n = 6). Error bars indicate mean ± SEM.
