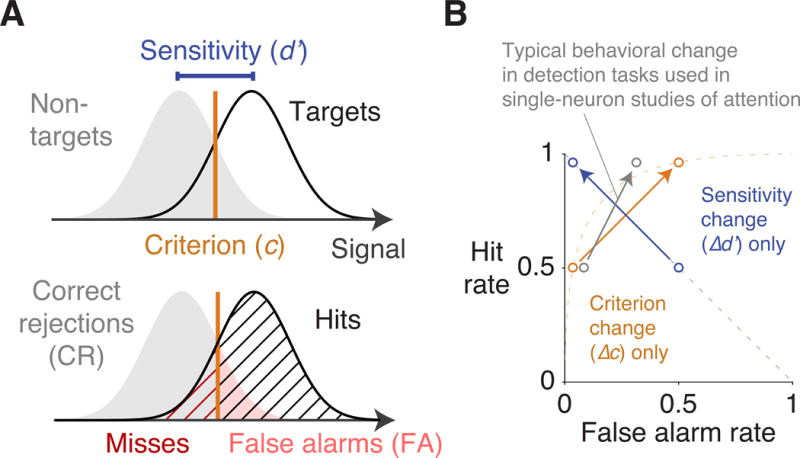
Figure 1. Visuospatial attention can be partitioned using signal detection theory.

(A) In the signal detection model, each stimulus evokes a noisy internal signal. If the signal is stronger than the criterion (c), the stimulus is reported as a target. The distributions of internal signals evoked by the target and by the nontarget overlap, and the separation between these two distributions is indexed as sensitivity (d′). The subject’s response to each stimulus is categorized as a hit (H), miss (M), false alarm (FA), or correct rejection (CR), and the frequency of these responses are used to calculate c and d′. (B) An increase in hit rate, which is used to operationalize attention in many single-neuron studies, typically consists of a combination of changes in criterion and sensitivity (Luo and Maunsell, 2015). A typical behavioral change of this sort is shown (in gray), along with an isolated change in criterion (in orange) and an isolated change in sensitivity (in blue). The dashed orange line represents an isopleth along which d′ is constant and only c varies, and the dashed blue line represents the isopleth along which c is constant and only d′ varies. Any change in hit rate can be brought about by a change in criterion alone, a change in sensitivity alone, or both.
