

Abstract
Background
Despite pathophysiological relevance and promising experimental data, the usefulness of biomarkers of oxidative stress for cardiac risk prediction is unclear. The aim of our study was to investigate the prognostic value of 6 biomarkers exploring different pathways of oxidative stress for predicting adverse cardiovascular outcomes in patients with type 2 diabetes mellitus beyond established risk factors.
Methods and Results
The SURDIAGENE (Survie, Diabete de type 2 et Genetique) prospective cohort study consecutively recruited 1468 patients with type 2 diabetes mellitus. Assays were performed at baseline, and incident cases of major adverse cardiovascular events (MACE)—first occurrence of cardiovascular death, nonfatal myocardial infarction, or stroke—were recorded during a median of 64 months. Advanced oxidation protein products, oxidative hemolysis inhibition assay, ischemia‐modified albumin, and total reductive capacity of plasma were not associated with the risk of MACE in univariate analyses. Fluorescent advanced glycation end products and carbonyls were associated with MACE (hazard ratio=1.38 per SD, 95% confidence interval 1.24‐1.54, P<0.001 and hazard ratio=1.15 per SD, 95% confidence interval 1.04‐1.27, P=0.006, respectively) in univariate analysis, but when added to a multivariate predictive model including traditional risk factors for MACE, these markers did not significantly improve c‐statistics or integrated discrimination index of the model.
Conclusions
These plasma concentrations of 6 markers, which cover a broad spectrum of oxidative processes, were not significantly associated with MACE occurrence and were not able to improve MACE risk discrimination and classification beyond classical risk factors in type 2 diabetes mellitus patients.
Keywords: biomarkers, cardiovascular outcome, cohort study, diabetes mellitus, negative study, oxidative stress
Subject Categories: Cardiovascular Disease; Diabetes, Type 2
Clinical Perspective
What Is New?
In a prospective cohort of diabetic patients, none of 6 different biomarkers of oxidative stress was significantly associated with the occurrence of major adverse cardiovascular events.
What Are the Clinical Implications?
To date, despite physiopathological relevance and promising preclinical data, no redox biomarker displays enough accuracy to be used in clinical practice for cardiac risk stratification.
Prognosis in type 2 diabetes mellitus (T2D) is mainly dominated by adverse cardiovascular events.1 For years, research has focused on the development of predictive tools that could improve the accuracy of risk prediction and individual risk stratification beyond traditional risk factors. Two main issues stand out with regard to precision medicine: (1) improvement of risk stratification at an individual level to optimize primary or secondary prevention and (2) identification of potential therapeutic targets through modification of these marker levels.
Several candidates have been studied, such as clinical findings and additional examinations including circulating biomarkers.2 In this regard, translational studies have identified redox biomarkers as potential targets, based on the hypothesis that excessive oxidative stress could drive disease development and/or progression.3 These markers usually include the sources of reactive oxygen species (ROS), ROS levels, and molecules that have been modified by interactions with ROS. ROS excess was proposed as a primary mechanism in diabetic complications,4 and ROS‐derived biomarkers are therefore logical candidate markers for diabetic complications.
In spite of their biological relevance and promising observational clinical results for some of these biomarkers such as myeloperoxidase,5 protein and lipid oxidation,6 advanced glycation end products (AGEs),7 and their soluble receptor,8 none of them has reached clinical application. This could be partly due to the lack of data, the complexity of the redox balance, and the high level of interaction between these markers and some known risk factors (age, renal failure, smoking, inflammatory disease, drugs). Conversely, several markers have only been studied in other settings than risk stratification, such as ischemia‐modified albumin (IMA),9, 10 carbonyl moieties,11, 12 or advanced oxidation protein products (AOPP).13, 14 Interestingly, these oxidative modifications of proteins may cause cell dysfunction, accelerate cell death and tissue injury, and thus represent promising biomarkers of oxidative stress that closely reflect the redox imbalance associated with cardiovascular disease.15
Last, some pathophysiologically relevant biomarkers are at an early stage of their development, with a lack of clinical data in humans in the field of atherosclerosis, including measurement of total reductive capacity of plasma (TRCP) or oxidative hemolysis inhibition assay (OxHLIA)16 and could be promising candidates. A better understanding of the relationship between circulating concentrations of markers of oxidative stress and cardiovascular events is therefore needed, along with an investigation of novel biomarkers.
The aim of our study was to investigate the additional prognostic value of 6 different measurements of oxidative stress level (AGEs, AOPP, carbonyls, IMA, TRCP, and OxHLIA), alone or in combination, beyond the traditional risk factors for predicting major cardiovascular outcome in patients with T2D.
Materials and Methods
The data, analytic methods, and study materials will not be made available to other researchers for purposes of reproducing the results or replicating the procedure.
Study Participants
The SURDIAGENE (Survie, Diabete de type 2 et Genetique) study is a prospective cohort designed to identify the determinants of microvascular and macrovascular diabetic complications in T2D and has been described previously.17, 18, 19 Patients aged ≥18 years with a definite diagnosis of T2D for ≥2 years were recruited (2002‐2011) in a study with regular follow‐up every second year since 2007. The main exclusion criteria were evidence of nondiabetic kidney disease and/or follow‐up duration <1 month. The Poitiers University Hospital Ethics Committee approved the SURDIAGENE study. All participants gave written informed consent.
Clinical Data
Clinical data were obtained at inclusion from the patients. History of macrovascular disease was defined by any of the following events in the patient medical record: myocardial infarction, stable angina, stroke or transient ischemic attack, and coronary or carotid artery revascularization. History of hypertension was defined by blood pressure ≥140/90 mm Hg at inclusion and/or antihypertensive treatment. Electrocardiographic left ventricular hypertrophy was defined by the presence of at least 1 of the following criteria: Sokolow‐Lyon >35 mm, Gubner‐Ungerlaider >25 mm, or sex‐adjusted Cornell product >2440 mm·ms.
Estimated glomerular filtration rate (eGFR) was calculated according to the CKD‐EPI (Chronic Kidney Disease Epidemiology Collaboration) equation. Chronic kidney disease stages were defined as follows: stage 1, eGFR ≥90 mL/min per 1.73 m2; stage 2, eGFR 89.9 to 60 mL/min per 1.73 m2; stage 3, eGFR ≥59.9 to 30 mL/min per 1.73 m2; stage 4, 29.9 to 15 mL/min per 1.73 m2; and stage 5, eGFR <15 mL/min per 1.73 m2 or renal replacement therapy. The urinary albumin‐to‐creatinine ratio was considered abnormal if it was above 30 mg/mmol. Drug prescriptions were assessed on the day of inclusion.
Biobanking
Blood samples and second morning urines were obtained after an overnight fast and stored at −80°C until use at the CHU Poitiers biobanking facility, having undergone only 1 prior freeze‐thaw cycle (CRB0033‐00068).
Serum and urine creatinine and urinary albumin were measured by nephelometry on a Modular System P (Roche Diagnostics GmbH, Mannheim, Germany). Glycated hemoglobin was determined using a high‐performance liquid chromatography method: ADAMS A1C HA‐8160 analyzer (Menarini, Florence, Italy). Total and HDL‐cholesterol and triglyceride concentrations were measured with enzymatic methods. LDL‐cholesterol was calculated using the Friedewald formula.
Biological Determinations of Redox Biomarkers
Venous blood samples were collected into EDTA‐containing tubes. Samples were centrifuged twice for 20 minutes at 2500g, recollecting the supernatant of the first centrifugation to be used in the second centrifugation step. For each sample, 300 mL of plasma was aliquoted into 96‐well plates and immediately frozen at −80°C. Absorbance intensity at 280 nm was used to measure total protein concentration.
Fluorescent AGEs
Fluorescent AGEs were assessed using a black 96‐well plate spectrofluorometer (Fluostar Omega, BM6, Labtech, Ortenberg, Germany). Briefly, 100 μL of 1:5 diluted plasma was placed in 1 of the wells of a 96‐well plate, and the fluorescence intensity was read at 460 nm after excitation at 355 nm. Results were expressed as arbitrary units (AU).
Advanced Oxidation Protein Products
The concentration of AOPPs was obtained by spectrophotometry as previously described.20 A chloramine‐T solution was used as a standard in each experiment. Plasma samples were diluted 1:10 (final volume 100 mL), and 20 μL of acetic acid was added to samples and to the chloramine‐T solution just before the absorbance intensity was read at 340 nm. Results were expressed as micromoles per liter of chloramine‐T equivalents. Because 529 AOPP samples were below the detection limit of the assay in the performance laboratory, analyses involving this biomarker were categorized as either below the limit of detection (undetected category), below the median of detectable values (detected <median category), or above the median (detected ≥median category).
Oxidative Hemolysis Inhibition Assay
OxHLIA is based on inhibition of free radical–induced membrane damage in erythrocytes by antioxidants present in plasma. For all experiments, erythrocytes were obtained from the same healthy volunteer and collected in EDTA tubes. Red blood cells were isolated by centrifugation (1000g for 5 minutes) and subsequently washed 3 times with 0.15 mol/L NaCl. Plasma samples were diluted 1:200 with 0.15 mol/L NaCl, and 100 mL was placed into 96‐well plates. Then, 100 μL of 1:50 diluted red blood cells (about 1×10⁸ erythrocytes) was added to the samples. Finally, 40 mL of a 0.5 mol/L solution of 2,2′‐azo‐bis‐(2‐amidinopropane) dihydrochloride was used to induce red blood cell peroxidation, and the rate of hemolysis was determined at 37°C by spectrophotometry measuring the absorbance at 450 nm every 10 minutes for 16 hours. Results were expressed as 50% of maximal hemolysis time (in minutes) and were obtained using a nonlinear regression in which the data were fit to a Boltzmann sigmoid equation.
Enzyme‐Linked Immunosorbent Assay Carbonyl
The degree of carbonylation in plasma was determined by enzyme‐linked immunosorbent assay, based on the recognition of protein‐bound 2,4‐dinitrophenylhydrazine in carbonylated proteins with an anti‐DNP antibody as previously described with slight modifications.21 Each sample was prepared as follows: 2 μg of total plasma protein was diluted in 10 μL 0.1 mol/L Na2CO3 buffer (pH 10.35) and 10 μL of 10 mmol/L DNPH (2,4‐dinitrophenylhydrazine in 6 mol/L guanidine hydrochloride, 0.5 mol/L potassium phosphate, pH 2.5) were added to the sample. After 20 minutes of incubation, samples were diluted again to 1:50 in 0.1 mol/L Na2CO3 buffer. Standards of oxidized and reduced BSA were prepared as indicated by the manufacturer (Oxiselect™, Protein Carbonyl ELISA Kit, Cell Biolabs, Inc, San Diego, CA) (carbonyl concentration range 0.375‐7.5 nmol/mg) and modified by 10 mmol/L DNPH for 20 minutes before dilution to 1:50 in 0.1 mol/L Na2CO3 buffer. MaxiSorp 96‐well plates (Nunc, Roskilde, Denmark) were coated with 100 μL of the antigen solution (samples and standard curve) overnight at 4°C. The coating solution was discarded, and the wells were first 4 times with 250 μL PBS:ethanol 1:1 and then 3 times with PBS. Unspecific sites were blocked by adding 200 μL of 5% nonfat dry milk in PBS/Tween 0.05% for 1.5 hours at room temperature. The wells were then washed 3 times with 250 μL PBS, and the appropriate antibody was added (100 μL of mouse anti‐DNP, Sigma D8406; diluted 1:2000 in Na2CO3 0.1 mol/L buffer). After 2 hours of incubation at room temperature, the wells were washed 5 times with 250 μL PBS/Tween 0.05% before addition of 100 μL of the secondary horseradish peroxidase–conjugated antibody (sheep anti‐mouse NXA931, GE Healthcare, Chicago, IL) diluted 1:4000 in Na2CO3 0.1 mol/L buffer for 1 hour at room temperature.
Finally, the wells were washed 5 times with 250 μL PBS/Tween 0.05% before addition of 100 μL of TMB solution per well and 100 μL of stop solution (HCl) when the development of the color was sufficient. The absorbance (optical density) was read at 450 nm. The concentration of the samples was calculated from the standard curve.
Total Reductive Capacity of Plasma
To measure the antioxidant capacity of plasma, the Folin‐Ciocalteu method was performed as previously described, with slight modifications. Gallic acid was used as a standard. Briefly, 20 μL of plasma was precipitated with 60 μL of methanol. After centrifugation for 5 minutes at 14 000g, the resulting supernatant (25 μL) was transferred to a 96‐well plate, and 125 μL of 1:10 Folin reagent (Sigma, St. Louis, MO) was added. Then, 100 μL of Na2CO3 0.1 mol/L was added, and the plate was incubated for 5 minutes at 50°C in a shaker. Next, the plate was cooled down for 5 minutes at 4°C, and the absorbance was measured at 760 nm in a plate reader. Gallic acid (Sigma) was used as a standard, and results were expressed as gallic acid equivalents.
Ischemic Modified Albumin
This assay is based on the decreased capacity of IMA to bind metals, in this case cobalt. Twenty microliters of 1:4–diluted samples were added to a 96‐well plate along with 15 μL of 0.1% cobalt solution and 125 μL of PBS. The plate was incubated for 15 minutes at 37°C, and the absorbance was immediately measured at 470 nm in a plate reader. Then, 20 μL of a 1.5 mg/mL DTT solution was added to the wells (solution becomes yellow), and after 2 minutes, 20 μL of 0.9 mol/L NaCl was added to stop the reaction. A second reading was performed in order to calculate the increment in the absorbance. Results were expressed as an IMA index.
Outcomes
Clinical events and biological data were recorded prospectively from patients’ hospital records and interviews with general practitioners every second year since 2007. The end point was the first major adverse cardiovascular event (MACE), a composite of cardiovascular death, nonfatal acute myocardial infarction or nonfatal stroke. An independent adjudication committee centrally reviewed each outcome according to international definitions of clinical outcomes.
Statistical Analyses
Means±SD were presented for normally distributed variables and medians (25th to 75th percentile) for nonnormally distributed variables. For regression analyses, we log‐transformed all biomarker concentrations with skewed distributions. Spearman correlations were used to assess the relationships between biomarkers and clinical characteristics.
Kaplan‐Meier survival curves for the outcomes of MACE were plotted by tertiles of biomarker concentrations/activity and by the 3 categories of AOPP. Cox proportional hazards models were used to estimate the effect of each biomarker on the risk of MACE with the biomarkers divided into tertiles/categories or logarithmically transformed. Hazard ratio was expressed for a 1‐SD increment in the distribution of the logarithm of the biomarker. A univariate analysis and 2 multivariate models were considered. The multivariate model (model A) was adjusted for cardiovascular risk factors: age, sex, body mass index, smoking status, history of hypertension, personal history of cardiovascular disease, left ventricular hypertrophy, diabetes mellitus duration, glycated hemoglobin, use of statins, total cholesterol, HDL‐cholesterol, abnormal urinary albumin‐to‐creatinine ratio. We tested each model for log‐linearity and proportionality assumptions. We conducted a sensitivity analysis by using the competing risk model of Fine and Gray to estimate the subdistribution hazard ratios for MACE while accounting for the competing risk of noncardiovascular deaths.22
Generalized c‐statistics were calculated for model A, accounting for variable follow‐up times. Comparisons of model adequacy were assessed using the likelihood ratio chi‐squared tests.23 The relative integrated discrimination improvement index was calculated to assess the improvement in 5‐year risk prediction of each biomarker in addition to traditional risk factors (model A).24 Five‐year risk was selected because it approximates the median follow‐up time for MACE.
P<0.05 was considered statistically significant. Analyses were conducted using SAS version 9.4 (SAS Inc, Cary, NC).
Results
Baseline Characteristics
Overall, 1468 T2D patients were included in the SURDIAGENE study, with data from 1 subject not available for technical reasons. Baseline characteristics of the 1467 patients included in the analyses, including the levels of the 6 studied redox markers, are given in Table 1. Correlations of the biomarkers with clinical parameters are given in Table 2. Overall, only 6 of the 15 tested associations were statistically significant, indicating that the markers bring different information. AGEs, carbonyls, IMA, and OxHLIA were negatively associated with eGFR.
Table 1.
Baseline Characteristics
| Variables | n=1467 |
|---|---|
| Male sex, n (%) | 847 (58) |
| Age, y | 65±11 |
| Body mass index, kg/m2 | 31±6 |
| BMI ≥30 kg/m2, n (%) | 830 (57) |
| Active smoking, n (%) | 153 (11) |
| Diabetes mellitus duration, y | 13 (6‐21) |
| HbA1c, % | 7.8±1.5 |
| Serum creatinine, μmol/L | 83 (34) |
| eGFR, mL/min per 1.73 m2 | 72.7±25.1 |
| uACR, mg/mmol | 3 (1‐14) |
| History of myocardial infarction, n (%) | 224 (15) |
| History of stable angina, n (%) | 256 (17) |
| History of transient ischemic attack, n (%) | 127 (9) |
| History of amputation, n (%) | 73 (5) |
| History of coronary artery revascularization, n (%) | 219 (15) |
| History of carotid artery revascularization, n (%) | 35 (2) |
| History of peripheral artery revascularization, n (%) | 73 (5) |
| History of atrial fibrillation, n (%) | 71 (5) |
| Hypertension, n (%) | 1274 (87) |
| Systolic blood pressure, mm Hg | 132.5±17.7 |
| Diastolic blood pressure, mm Hg | 72.4±11.1 |
| Total cholesterol, mmol/L | 4.8±1.2 |
| HDL cholesterol, mmol/L | 1.2±0.4 |
| LDL cholesterol, mmol/L | 2.7±1.0 |
| Resting heart rate, beats/min | 71±14 |
| Left ventricular hypertrophy, n (%) | 237 (17) |
| Use of metformin, n (%) | 690 (47) |
| Use of insulin, n (%) | 882 (60) |
| Use of statins, n (%) | 666 (45) |
| Use of β blockers, n (%) | 498 (34) |
| Fluorescent AGEs (AU)a | 112 027 (92 969‐133 082) |
| AOPP (chloramin T equiv)a | 129 (52‐278) |
| ELISA carbonyls, mmol/mga | 28.3 (25.9‐30.9) |
| IMA (AU)a | 0.52 (0.34‐0.64) |
| OxHLIA (V50 min)a | 413 (353‐481) |
| TRCP (gallic acid equiv)a | 120 (103‐146) |
AGEs indicates advanced glycation end products; AOPP, advanced oxidation protein products; AU, arbitrary unit; BMI, body mass index; eGFR, estimated glomerular filtration rate; ELISA, enzyme‐linked immunosorbent assay; equiv, equivalents; HbA1c, glycated hemoglobin; HDL, high‐density lipoprotein; IMA, ischemia‐modified albumin; LDL, low‐density lipoprotein; OxHLIA, oxidative hemolysis inhibition assay; TRCP, total reductive capacity of plasma; uACR, urine albumin‐creatinine ratio.
Below limit of detection AOPP 529, carbonyls 1, IMA 11, OxHLIA 11, TRCP 104. Data are shown as means±SD, median (25th‐75th percentiles), or n (%).
Table 2.
Spearman Correlations Between Redox Biomarkers and Clinical Parameters (Rho and P Value)
| Fluorescent AGEs | AOPP | Carbonyls | IMA | OxHLIA | TRCP | |
|---|---|---|---|---|---|---|
| Age | 0.16 (<0.0001)a | 0.01 (0.7885) | 0.09 (0.0007)a | 0.03 (0.324) | 0.07 (0.0126)a | 0.04 (0.1017) |
| Sex | 0.02 (0.4934) | −0.05 (0.1076) | −0.002 (0.9487) | −0.03 (0.2262) | 0.02 (0.5055) | −0.01 (0.8138) |
| Diabetes mellitus duration | 0.06 (0.0172) | −0.01 (0.7487) | 0.10 (<0.0001)a | 0.11 (<0.0001)a | −0.002 (0.9362) | 0.06 (0.0308)a |
| BMI | −0.06 (0.0146)a | 0.03 (0.3024) | −0.02 (0.4233) | −0.06 (0.024)a | 0.04 (0.1526) | −0.02 (0.3856) |
| HbA1c | −0.10 (0.0003)a | 0.04 (0.2465) | −0.0008 (0.9771) | −0.01 (0.8081) | −0.08 (0.0018)a | −0.01 (0.7336) |
| MAP | −0.004 (0.8685) | 0.04 (0.1742) | 0.05 (0.0359)a | 0.06 (0.0294)a | −0.05 (0.043)a | −0.01 (0.6845) |
| GFR | −0.34 (<0.0001)a | −0.03 (0.4334) | −0.11 (<0.0001)a | −0.12 (<0.0001)a | −0.10 (<0.0001)a | −0.03 (0.3526) |
| ACR | 0.17 (<0.0001)a | 0.05 (0.1566) | 0.08 (0.0018)a | 0.06 (0.0313)a | 0.08 (0.0019)a | 0.06 (0.0232)a |
ACR indicates urinary albumin/creatinine ratio; AGEs, advanced glycation end products; AOPP, advanced oxidation protein products; BMI, body mass index; GFR, glomerular filtration rate; HbA1c, glycated hemoglobin; IMA, ischemia‐modified albumin; MAP, mean arterial pressure; OxHLIA, oxidative hemolysis inhibition assay; TRCP, total reductive capacity of plasma.
P<0.05.
Follow‐Up Data
The median duration of follow‐up was 64 months. During the follow‐up, 354 participants presented a MACE (incidence rate of 4.3 events per 100 person‐years, among whom 267 died from cardiovascular cause, 107 presented a nonfatal myocardial infarction, and 74 had a nonfatal stroke) and 447 died from any cause (incidence rate of 5.2 per 100 person‐years).
Kaplan‐Meier survival curves for the outcome of MACE by tertiles of biomarker concentrations/activity of the biomarkers are presented in Figure, and the univariate hazard ratios for MACE occurrence are given for each redox marker in Table 3. In univariate analyses, only fluorescent AGEs and carbonyl levels were associated with cardiac events, unlike IMA, OxHLIA, TRCP, and AOPP. Multivariate analysis including the traditional risk factors for MACE is also presented in Table 3. When tested, neither AGEs nor carbonyls remained independently associated with MACE occurrence. We found no significant statistical interaction between the obesity status and each biomarker in the multivariate models, suggesting no different association between redox biomarkers and outcome according the presence of obesity (data not shown).
Figure 1.
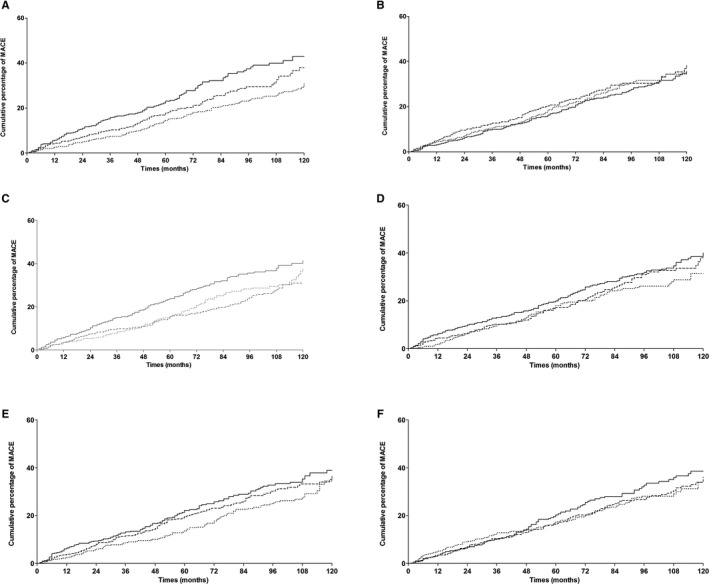
Kaplan‐Meier cumulative incidence curves for major adverse cardiovascular event by tertiles (dotted line, lowest tertile; dashed line, middle tertile; solid line, highest tertile) of (A) AGE, P=0.0002; (B) AOPP, P=0.5247; (C) carbonyls, P=0.0032; (D) IMA, P=0.18; (E) OxHLIA, P=0.097, (F) TRCP, P=0.37 or by groups (dotted line, below limit of detection; dashed line, below detected median; solid line, above detected median for B) AOPP, P=0.52. AGEs indicates advanced glycation end products; AOPP, advanced oxidation protein products; IMA, ischemia‐modified albumin; MACE, major adverse cardiovascular events; OxHLIA, oxidative hemolysis inhibition assay; TRCP, total reductive capacity of plasma.
Table 3.
Hazard Ratios and 95% Confidence Interval for Major Adverse Cardiovascular Event According to Each Redox Biomarker
| Univariate | Model A | |||
|---|---|---|---|---|
| HR (95% CI) | P Value | HR (95% CI) | P Value | |
| Fluorescent AGEs | ||||
| Per SD | 1.38 (1.24‐1.54) | <0.0001a | 1.08 (0.96‐1.21) | 0.2189 |
| Tertile 1 | Reference | 0.0002a | Reference | 0.2862 |
| Tertile 2 | 1.26 (0.97‐1.63) | 1.22 (0.93‐1.61) | ||
| Tertile 3 | 1.72 (1.33‐2.23) | 1.03 (0.77‐1.37) | ||
| AOPP | ||||
| Undetected | Reference | 0.5263 | Reference | 0.0881 |
| Detected < median | 1.08 (0.83‐1.4) | 1.03 (0.77‐1.36) | ||
| Detected ≥ median | 0.93 (0.72‐1.21) | 0.77 (0.57‐1.04) | ||
| Carbonyls | ||||
| Per SD | 1.15 (1.04‐1.27) | 0.006a | 1.03 (0.93‐1.15) | 0.533 |
| Tertile 1 | Reference | 0.0034a | Reference | 0.0268a |
| Tertile 2 | 0.89 (0.68‐1.17) | 0.75 (0.56‐0.99) | ||
| Tertile 3 | 1.34 (1.05‐1.72) | 1.07 (0.82‐1.40) | ||
| IMA | ||||
| Per SD | 1.04 (0.92‐1.17) | 0.584 | 0.96 (0.85‐1.08) | 0.473 |
| Tertile 1 | Reference | 0.1839 | Reference | 0.9058 |
| Tertile 2 | 1.14 (0.86‐1.50) | 1.07 (0.80‐1.43) | ||
| Tertile 3 | 1.27 (0.98‐1.65) | 1.03 (0.78‐1.36) | ||
| OxHLIA | ||||
| Per SD | 1.05 (0.93‐1.18) | 0.465 | 1.01 (0.89‐1.14) | 0.9 |
| Tertile 1 | Reference | 0.0987 | Reference | 0.7099 |
| Tertile 2 | 1.19 (0.92‐1.54) | 0.94 (0.72‐1.24) | ||
| Tertile 3 | 1.33 (1.03‐1.73) | 1.06 (0.8‐1.40) | ||
| TRCP | ||||
| Per SD | 1.00 (0.90‐1.12) | 0.979 | 0.99 (0.88‐1.12) | 0.888 |
| Tertile 1 | Reference | 0.375 | Reference | 0.6678 |
| Tertile 2 | 1.00 (0.76‐1.30) | 0.98 (0.73‐1.30) | ||
| Tertile 3 | 1.18 (0.90‐1.54) | 1.10 (0.83‐1.47) | ||
Data are presented as hazard ratio (95% confidence interval). Model A: adjusted for age, sex, BMI, smoking status, history of hypertension, history of macrovascular disease, LVH, diabetes duration, HbA1c, use of statin, total cholesterol, HDL‐cholesterol, abnormal uACR. AGEs indicates advanced glycation end products; AOPP, advanced oxidation protein products; CI, confidence interval; HbA1c, glycated hemoglobin; HDL, high‐density lipoprotein; HR, hazard ratio; IMA, ischemia‐modified albumin; LVH, left ventricular hypertrophy; OxHLIA, oxidative hemolysis inhibition assay; TRCP, total reductive capacity of plasma; uACR, urine albumin/creatinine ratio.
P<0.05.
After the competing risk of noncardiovascular death was accounted for in a Fine and Gray analysis (Table S1) results were largely unchanged.
Discrimination and reclassification data are presented in Table 4. When integrated in a predictive model including classical risk factors, the markers did not allow proper reclassification of a significant part of the participants or improvement of the model discrimination.
Table 4.
C‐Statistics and 5‐Year Relative Integrated Discrimination Improvement Index Using Biomarkers in Addition to Traditional Risk Factors for the Prediction of Adverse Cardiovascular Event for the Cox Model With and Without Biomarkers
| C‐Statistics With Biomarker | Difference in C‐Statisticsa (95% CI) | Log‐Likelihood Ratio Test P Value | Relative IDI (95% CI) | |
|---|---|---|---|---|
| Fluorescent AGEs | ||||
| Tertiles | 0.747 | 0 | 0.84 | −0.002 |
| Per SD | 0.748 | 0.001 | 0.22 | −0.006 |
| Carbonyls | ||||
| Tertiles | 0.748 | 0.001 | 0.51 | 0.005 |
| Per SD | 0.748 | 0.001 | 0.54 | 0.002 |
AGEs indicates advanced glycation end products; BMI, body mass index; CI, confidence interval; HDL, high‐density lipoprotein; IDI, integrated discrimination improvement index; LVH, left ventricular hypertrophy; uACR, urine albumin/creatinine ratio.
C‐statistics reference for model including age, sex, BMI, smoking status, history of hypertension, history of cardiovascular disease, LVH, diabetes mellitus duration, HbA1c, use of statin, total cholesterol, HDL‐cholesterol, abnormal uACR, =0.747.
Discussion
Our main findings suggest no prognostic role of the 6 studied biomarkers or MACE prediction.
First, we found some negative results concerning several potential redox biomarkers that had never or scarcely been studied before to optimize cardiac prognosis in T2D. We showed that AOPP, OxHLIA, IMA, and TRCP were neither associated with the risk of MACE in our cohort. To our best knowledge, AOPP, OxHLIA, and IMA markers had never been studied for the prediction of cardiac or cardiovascular adverse events, and TRCP has recently been reported to be associated with coronary artery disease incidence in a relatively small cohort of T2D patients.25 However, it does not seem to be a promising marker in our study.
Second, we found that fluorescent AGEs and carbonyls were both significantly associated with MACE in univariate analyses but not after adjustment for classical risk factors, diabetes duration, and glycated hemoglobin. Because none of the studied markers appeared to be independently associated with MACE, we did not test the markers simultaneously in the model. Concerning carbonyls, they have been studied in human pediatric settings11 for predicting cardiac remodeling in heart failure12 or graft rejection after heart transplantation26 but not to our knowledge for predicting cardiac events in T2D.
Fluorescent AGEs are the most often studied of oxidative stress markers selected in the present study. They have been shown to be associated with angiographic severity of CAD,27 restenosis,28 heart failure,29, 30 and adverse clinical outcome in patients with diabetes mellitus undergoing percutaneous coronary intervention.8 Assessment of AGE levels by fluorescence is rather inexpensive and reproducible. This method targets pentosidine and crosslinks between free amino‐groups such as lysine and glucose, the fluorescence being chiefly associated with high‐molecular‐weight proteins such as albumin.31 However, epidemiological evidence for an association between high levels of plasma AGEs and increased cardiovascular risk has remained inconclusive to date. Associations between AGEs and cardiac events have been reported since early 2000s, first in case‐control studies7, 32, 33 then in a Finnish cohort of nondiabetics with an 18‐year follow‐up.34 In the latter report, there was a weak association between AGEs and coronary heart disease mortality, restricted to women and not taking as many covariates into account as in our study. More recently, AGEs and incident cardiovascular events were strongly associated in a case‐cohort study.35 Conversely, some studies were negative, reporting no association between AGEs and MACE, such as in a post hoc analysis of the ADVANCE study,7 in accordance with our study. Inconsistencies in previous literature may be due to heterogeneous variable adjustment for such confounders. Moreover, we demonstrated that AGEs provided no additional information that could allow an improvement in the accuracy of risk stratification for individuals in primary or secondary prevention, over the recommended risk scores.
Because the role of biomarkers related to the redox process is discussed in the case of prior renal replacement or significant chronic kidney disease, we examined if our negative results could have been due to the inclusion of such subjects in our study. At baseline, 1361 (90%) participants had no history of renal replacement therapy and an eGFR >30 mL/min. When reanalyzing our data in these patients as a sensitivity analysis, we found no association between any biomarker and MACE risk, with no substantial difference from the results presented in Table 3 (data not shown).
Some limitations must be acknowledged. First, our hospital‐based recruitment could possibly lead to a selection of patients with a high cardiovascular risk or more frequent comorbidities. However, risk score levels were similar to those observed in some population‐based cohort studies.36 Moreover, because of its single‐center recruitment, generalization of the results to other populations must be cautiously considered. Finally, measurements were performed only at baseline and can vary over time and environmental changes, making a definite causality link hard to establish, even though our prospective design is a clear asset for such an issue.
Our main strengths are the large number of subjects and events observed and the variety of covariates and risk factors. Moreover, our main goal was not to validate a novel or already existing biomarker. It focused on a global set of redox biomarkers that involve different physicochemical pathways and various ways to approach oxidative stress. A large and heterogeneous panel of biomarkers can be found in the literature, resulting from ROS production and subsequent modification of proteins, lipids, or DNA, but also more integrative markers reflecting the global imbalance between pro‐ and antioxidants in plasma (such as the total reductive capacity), but none has studied these types of biomarkers taken all together. For example, OxLIA and TRCP provide a picture of global systemic redox state, whereas carbonyls target all oxidized proteins, fluoAGEs imply a glycation component, and AOPP and IMA focus on more specific types of proteins modified by interaction with ROS (ie, tyrosine‐containing proteins or albumin). Actually, TRCP and OxHLIA constitute integrative and functional biomarkers reflecting the imbalance between the levels of both endogenous and exogenous antioxidants and those of pro‐oxidants such as ROS. Similarly to biochemical assays measuring AGEs, AOPP, carbonyls, and IMA, both TRCP and oxHLIA tests are simple, fast and do not require specialized equipment. Of note, factors determining the clinical use of a biomarker include the specificity, sensitivity, and reproducibility of the assay and also the ease and the cost of the assay.15 In addition, we decided to test both already developed markers with existing scientific background and dosage kits (such as AGEs) and experimental markers for which we had to develop more complex methods of determination.
In conclusion, we found no independent association between 6 redox biomarkers widely exploring oxidative stress pathways and the risk of incident MACE or all‐cause death. Moreover, these markers did not significantly improve risk discrimination and risk reclassification. A better understanding of the role of oxidative stress in atherosclerosis remains a challenge, and our results do not support clinical implementation of these markers or possible therapeutic applications.
Sources of Funding
The SURDIAGENE study was supported by grants from the French Ministry of Health (Programme Hospitalier de Recherche Clinique‐Poitiers 2004, Programme Hospitalier de Recherche Clinique Interregional 2008), Association Française des Diabétiques (Research Grant 2003), Groupement pour l'Etude des Maladies Métaboliques et Systémiques (GEMMS, Poitiers, France). The analysis and interpretation of the data have been done without any participation of these organizations.
Disclosures
None.
Supporting information
Appendix S1. Centers and Staff Involved in SURDIAGENE Recruitment and Adjudication
Table S1. Subhazard Ratios and 95% Confidence Interval for Major Adverse Cardiovascular Event According to Each Redox Biomarker With Correction for Competing Risk of Noncardiovascular Death
Acknowledgments
All SURDIAGENE study participants are acknowledged. Description of centers and personnel involved in SURDIAGENE recruitment and adjudication is shown in Appendix S1.
(J Am Heart Assoc. 2018;7:e007397 DOI: 10.1161/JAHA.117.007397.)29478972
References
- 1. Emerging Risk Factors Collaboration , Seshasai SR, Kaptoge S, Thompson A, Di Angelantonio E, Gao P, Sarwar N, Whincup PH, Mukamal KJ, Gillum RF, Holme I, Njolstad I, Fletcher A, Nilsson P, Lewington S, Collins R, Gudnason V, Thompson SG, Sattar N, Selvin E, Hu FB, Danesh J. Diabetes mellitus, fasting glucose, and risk of cause‐specific death. N Engl J Med. 2011;364:829–841. [DOI] [PMC free article] [PubMed] [Google Scholar]
- 2. Piepoli MF, Hoes AW, Agewall S, Albus C, Brotons C, Catapano AL, Cooney MT, Corra U, Cosyns B, Deaton C, Graham I, Hall MS, Hobbs FD, Lochen ML, Lollgen H, Marques‐Vidal P, Perk J, Prescott E, Redon J, Richter DJ, Sattar N, Smulders Y, Tiberi M, van der Worp HB, van Dis I, Verschuren WM; Authors/Task Force Members . 2016 European guidelines on cardiovascular disease prevention in clinical practice: the Sixth Joint Task Force of the European Society of Cardiology and Other Societies on Cardiovascular Disease Prevention in Clinical Practice (constituted by representatives of 10 societies and by invited experts) developed with the special contribution of the European Association for Cardiovascular Prevention & Rehabilitation (EACPR). Eur Heart J. 2016;37:2315–2381. [DOI] [PMC free article] [PubMed] [Google Scholar]
- 3. Karimi Galougahi K, Antoniades C, Nicholls SJ, Channon KM, Figtree GA. Redox biomarkers in cardiovascular medicine. Eur Heart J. 2015;36:1576–1582, 1582a‐b. [DOI] [PubMed] [Google Scholar]
- 4. Brownlee M. Biochemistry and molecular cell biology of diabetic complications. Nature. 2001;414:813–820. [DOI] [PubMed] [Google Scholar]
- 5. Meuwese MC, Stroes ES, Hazen SL, van Miert JN, Kuivenhoven JA, Schaub RG, Wareham NJ, Luben R, Kastelein JJ, Khaw KT, Boekholdt SM. Serum myeloperoxidase levels are associated with the future risk of coronary artery disease in apparently healthy individuals: the EPIC‐Norfolk Prospective Population Study. J Am Coll Cardiol. 2007;50:159–165. [DOI] [PubMed] [Google Scholar]
- 6. Holvoet P. Oxidized LDL and coronary heart disease. Acta Cardiol. 2004;59:479–484. [DOI] [PubMed] [Google Scholar]
- 7. Thomas MC, Woodward M, Neal B, Li Q, Pickering R, Marre M, Williams B, Perkovic V, Cooper ME, Zoungas S, Chalmers J, Hillis GS; ADVANCE Collaborative Group . Relationship between levels of advanced glycation end products and their soluble receptor and adverse outcomes in adults with type 2 diabetes. Diabetes Care. 2015;38:1891–1897. [DOI] [PubMed] [Google Scholar]
- 8. Yang ZK, Shen Y, Shen WF, Pu LJ, Meng H, Zhang RY, Zhang Q, Chen QJ, De Caterina R, Lu L. Elevated glycated albumin and reduced endogenous secretory receptor for advanced glycation endproducts levels in serum predict major adverse cardio‐cerebral events in patients with type 2 diabetes and stable coronary artery disease. Int J Cardiol. 2015;197:241–247. [DOI] [PubMed] [Google Scholar]
- 9. Yucel H, Turkdogan KA, Zorlu A, Aydin H, Kurt R, Yilmaz MB. Association between oxidative stress index and post‐CPR early mortality in cardiac arrest patients: a prospective observational study. Anatol J Cardiol. 2015;15:737–743. [DOI] [PMC free article] [PubMed] [Google Scholar]
- 10. Charpentier S, Ducasse JL, Cournot M, Maupas‐Schwalm F, Elbaz M, Baixas C, Juchet H, Lang T, Lauque D. Clinical assessment of ischemia‐modified albumin and heart fatty acid‐binding protein in the early diagnosis of non‐ST‐elevation acute coronary syndrome in the emergency department. Acad Emerg Med. 2010;17:27–35. [DOI] [PubMed] [Google Scholar]
- 11. Manso PH, Carmona F, Dal‐Pizzol F, Petronilho F, Cardoso F, Castro M, Carlotti AP. Oxidative stress markers are not associated with outcomes after pediatric heart surgery. Paediatr Anaesth. 2013;23:188–194. [DOI] [PubMed] [Google Scholar]
- 12. Radovanovic S, Savic‐Radojevic A, Pljesa‐Ercegovac M, Djukic T, Suvakov S, Krotin M, Simic DV, Matic M, Radojicic Z, Pekmezovic T, Simic T. Markers of oxidative damage and antioxidant enzyme activities as predictors of morbidity and mortality in patients with chronic heart failure. J Card Fail. 2012;18:493–501. [DOI] [PubMed] [Google Scholar]
- 13. Wykretowicz A, Adamska K, Krauze T, Guzik P, Szczepanik A, Rutkowska A, Wysoki H. The plasma concentration of advanced oxidation protein products and arterial stiffness in apparently healthy adults. Free Radic Res. 2007;41:645–649. [DOI] [PubMed] [Google Scholar]
- 14. Chiu‐Braga YY, Hayashi SY, Schafranski M, Messias‐Reason IJ. Further evidence of inflammation in chronic rheumatic valve disease (CRVD): high levels of advanced oxidation protein products (AOPP) and high sensitive C‐reactive protein (hs‐CRP). Int J Cardiol. 2006;109:275–276. [DOI] [PubMed] [Google Scholar]
- 15. Ho E, Karimi Galougahi K, Liu CC, Bhindi R, Figtree GA. Biological markers of oxidative stress: applications to cardiovascular research and practice. Redox Biol. 2013;1:483–491. [DOI] [PMC free article] [PubMed] [Google Scholar]
- 16. Prieto MA, Vazquez JA. A time‐dose model to quantify the antioxidant responses of the oxidative hemolysis inhibition assay (OxHLIA) and its extension to evaluate other hemolytic effectors. Biomed Res Int. 2014;2014:632971. [DOI] [PMC free article] [PubMed] [Google Scholar]
- 17. Hadjadj S, Fumeron F, Roussel R, Saulnier PJ, Gallois Y, Ankotche A, Travert F, Abi Khalil C, Miot A, Alhenc‐Gelas F, Lievre M, Marre M; DIABHYCAR Study Group, DIAB2NEPHROGENE Study Group, SURDIAGENE Study Group . Prognostic value of the insertion/deletion polymorphism of the ACE gene in type 2 diabetic subjects: results from the non‐insulin‐dependent diabetes, hypertension, microalbuminuria or proteinuria, cardiovascular events, and ramipril (DIABHYCAR), diabete de type 2, nephropathie et genetique (DIAB2NEPHROGENE), and survie, diabete de type 2 et genetique (SURDIAGENE) studies. Diabetes Care. 2008;31:1847–1852. [DOI] [PMC free article] [PubMed] [Google Scholar]
- 18. Saulnier PJ, Gand E, Ragot S, Ducrocq G, Halimi JM, Hulin‐Delmotte C, Llaty P, Montaigne D, Rigalleau V, Roussel R, Velho G, Sosner P, Zaoui P, Hadjadj S; SURDIAGENE Study Group . Association of serum concentration of TNFR1 with all‐cause mortality in patients with type 2 diabetes and chronic kidney disease: follow‐up of the SURDIAGENE cohort. Diabetes Care. 2014;37:1425–1431. [DOI] [PubMed] [Google Scholar]
- 19. Sosner P, Hulin‐Delmotte C, Saulnier PJ, Cabasson S, Gand E, Torremocha F, Piguel X, Miot A, Marechaud R, Herpin D, Ragot S, Hadjadj S; SURDIAGENE Study Group . Cardiovascular prognosis in patients with type 2 diabetes: contribution of heart and kidney subclinical damage. Am Heart J. 2015;169:108–114.e107. [DOI] [PubMed] [Google Scholar]
- 20. Delbosc S, Diallo D, Dejouvencel T, Lamiral Z, Louedec L, Martin‐Ventura JL, Rossignol P, Leseche G, Michel JB, Meilhac O. Impaired high‐density lipoprotein anti‐oxidant capacity in human abdominal aortic aneurysm. Cardiovasc Res. 2013;100:307–315. [DOI] [PubMed] [Google Scholar]
- 21. Range H, Labreuche J, Louedec L, Rondeau P, Planesse C, Sebbag U, Bourdon E, Michel JB, Bouchard P, Meilhac O. Periodontal bacteria in human carotid atherothrombosis as a potential trigger for neutrophil activation. Atherosclerosis. 2014;236:448–455. [DOI] [PubMed] [Google Scholar]
- 22. Fine JP, Gray RJ. A proportional hazards model for the subdistribution of a competing risk. J Am Stat Assoc. 1999;94:496–509. [Google Scholar]
- 23. Demler OV, Pencina MJ, D'Agostino RB Sr. Misuse of DeLong test to compare AUCs for nested models. Stat Med. 2012;31:2577–2587. [DOI] [PMC free article] [PubMed] [Google Scholar]
- 24. Pencina MJ, D'Agostino RB Sr, D'Agostino RB Jr, Vasan RS. Evaluating the added predictive ability of a new marker: from area under the ROC curve to reclassification and beyond. Stat Med. 2008;27:157–172; discussion 207‐112. [DOI] [PubMed] [Google Scholar]
- 25. Masi S, D'Aiuto F, Cooper J, Salpea K, Stephens JW, Hurel SJ, Deanfield JE, Humphries SE. Telomere length, antioxidant status and incidence of ischaemic heart disease in type 2 diabetes. Int J Cardiol. 2016;216:159–164. [DOI] [PMC free article] [PubMed] [Google Scholar]
- 26. Koestenbauer S, Stiegler P, Stadlbauer V, Mayrhauser U, Leber B, Schweiger M, Wasler A, Prenner G, Sereinigg M, Zelzer S, Stojakovic T, Scarpatetti M, Griesbacher A, Greilberger J, Tscheliessnigg K. Myeloperoxidase and carbonyl proteins: promising markers for non‐invasive monitoring of graft rejection after heart transplantation. J Heart Lung Transplant. 2010;29:1352–1357. [DOI] [PubMed] [Google Scholar]
- 27. Lu L, Pu LJ, Zhang Q, Wang LJ, Kang S, Zhang RY, Chen QJ, Wang JG, De Caterina R, Shen WF. Increased glycated albumin and decreased esRAGE levels are related to angiographic severity and extent of coronary artery disease in patients with type 2 diabetes. Atherosclerosis. 2009;206:540–545. [DOI] [PubMed] [Google Scholar]
- 28. Spadaccio C, Patti G, De Marco F, Coccia R, Di Domenico F, Pollari F, Zanzonico R, Pettinari M, Lusini M, Di Sciascio G, Covino E, Chello M. Usefulness of preprocedural levels of advanced glycation end products to predict restenosis in patients with controlled diabetes mellitus undergoing drug‐eluting stent implantation for stable angina pectoris (from the Prospective ARMYDA‐AGEs Study). Am J Cardiol. 2013;112:21–26. [DOI] [PubMed] [Google Scholar]
- 29. Lazo M, Halushka MK, Shen L, Maruthur N, Rebholz CM, Rawlings AM, Hoogeveen RC, Brinkley TE, Ballantyne CM, Astor BC, Selvin E. Soluble receptor for advanced glycation end products and the risk for incident heart failure: the Atherosclerosis Risk in Communities Study. Am Heart J. 2015;170:961–967. [DOI] [PMC free article] [PubMed] [Google Scholar]
- 30. Bodiga VL, Eda SR, Bodiga S. Advanced glycation end products: role in pathology of diabetic cardiomyopathy. Heart Fail Rev. 2014;19:49–63. [DOI] [PubMed] [Google Scholar]
- 31. Munch G, Keis R, Wessels A, Riederer P, Bahner U, Heidland A, Niwa T, Lemke HD, Schinzel R. Determination of advanced glycation end products in serum by fluorescence spectroscopy and competitive ELISA. Eur J Clin Chem Clin Biochem. 1997;35:669–677. [DOI] [PubMed] [Google Scholar]
- 32. Kiuchi K, Nejima J, Takano T, Ohta M, Hashimoto H. Increased serum concentrations of advanced glycation end products: a marker of coronary artery disease activity in type 2 diabetic patients. Heart. 2001;85:87–91. [DOI] [PMC free article] [PubMed] [Google Scholar]
- 33. Aso Y, Inukai T, Tayama K, Takemura Y. Serum concentrations of advanced glycation endproducts are associated with the development of atherosclerosis as well as diabetic microangiopathy in patients with type 2 diabetes. Acta Diabetol. 2000;37:87–92. [DOI] [PubMed] [Google Scholar]
- 34. Kilhovd BK, Juutilainen A, Lehto S, Ronnemaa T, Torjesen PA, Birkeland KI, Berg TJ, Hanssen KF, Laakso M. High serum levels of advanced glycation end products predict increased coronary heart disease mortality in nondiabetic women but not in nondiabetic men: a population‐based 18‐year follow‐up study. Arterioscler Thromb Vasc Biol. 2005;25:815–820. [DOI] [PubMed] [Google Scholar]
- 35. Hanssen NM, Beulens JW, van Dieren S, Scheijen JL, van der A DL, Spijkerman AM, van der Schouw YT, Stehouwer CD, Schalkwijk CG. Plasma advanced glycation end products are associated with incident cardiovascular events in individuals with type 2 diabetes: a case‐cohort study with a median follow‐up of 10 years (EPIC‐NL). Diabetes. 2015;64:257–265. [DOI] [PubMed] [Google Scholar]
- 36. Roper NA, Bilous RW, Kelly WF, Unwin NC, Connolly VM; South Tees Diabetes Mortality Study . Cause‐specific mortality in a population with diabetes: South Tees Diabetes Mortality Study. Diabetes Care. 2002;25:43–48. [DOI] [PubMed] [Google Scholar]
Associated Data
This section collects any data citations, data availability statements, or supplementary materials included in this article.
Supplementary Materials
Appendix S1. Centers and Staff Involved in SURDIAGENE Recruitment and Adjudication
Table S1. Subhazard Ratios and 95% Confidence Interval for Major Adverse Cardiovascular Event According to Each Redox Biomarker With Correction for Competing Risk of Noncardiovascular Death