

Abstract
Fibroblast growth factor 23 (FGF23) production is upregulated by iron deficiency and hypoxia. However, the influence of acute blood loss, and the resulting increases in circulating erythropoietin, on FGF23 production is unknown. Using wild-type C57BL/6 mice, we show that acute loss of 10% total blood volume leads to an increase in plasma C-terminal FGF23 (cFGF23) levels within 6 h, while plasma levels of intact FGF23, phosphate, calcium, parathyroid hormone, iron, and ferritin remain similar to control mice without acute blood loss. Volume resuscitation with PBS did not significantly alter these findings. The increase in plasma cFGF23 levels in bled animals was accompanied by increased plasma erythropoietin levels at 6 h. Administration of erythropoietin led to an acute increase in plasma cFGF23 levels similar to that observed in acute blood loss. Fgf23 mRNA expression was increased 20-fold in bone marrow, but not in bone, of bled vs. control mice, suggesting bone marrow as a key source of elevated plasma FGF23 levels following acute blood loss. To extend these findings to humans, we measured plasma cFGF23 levels in 131 critically ill patients admitted to the intensive care unit. In univariate and multivariate models, we found a positive association between number of red blood cell transfusions, an indirect indicator of acute blood loss, and plasma cFGF23 levels. We conclude that FGF23 production is rapidly increased after acute blood loss and that erythropoietin may be the mediator of this increase. Thus erythropoietin may represent a novel physiological regulator of FGF23 production.
Keywords: FGF23, bleeding, anemia, erythropoietin, iron
fibroblast growth factor 23 (FGF23) is an osteocyte-derived hormone that regulates phosphate excretion and vitamin D activation by the kidneys. FGF23 levels increase with loss of kidney function and have been linked with increased morbidity and mortality in chronic kidney disease patients (10, 13). Off-target effects of elevated FGF23 levels have been described, namely, as a mediator of cardiac hypertrophy (9), impairment of neutrophil function (22), inflammation (26), and bone loss (3). FGF23 may also affect erythropoiesis (4).
Circulating FGF23 levels are comprised of the functional intact hormone (iFGF23) and N-terminal and C-terminal fragments. Current assays detect either the intact hormone alone, or both the intact hormone and the C-terminal fragments (cFGF23). The ELISA that measures cFGF23 uses antibodies directed against epitopes present within the C-terminal portion of FGF23, and thus detects both the intact hormone and C-terminal products, whereas the ELISA that measures iFGF23 uses antibodies that flank the C-terminal cleavage site, and thus measures iFGF23 only (30). Accordingly, simultaneous measurement of cFGF23 and iFGF23 provides insights into FGF23 cleavage.
FGF23 production can be increased by calcitriol, high dietary phosphate intake, and parathyroid hormone (PTH), although the effect of these regulators on FGF23 cleavage is unknown (2, 17). Iron deficiency leads to increased circulating cFGF23 but not iFGF23 levels, indicating increased FGF23 production matched by a commensurate increase in FGF23 cleavage (8, 12). Functional iron deficiency, as induced by inflammation, seems to result in similar elevation (5). The physiological regulation of FGF23 production and cleavage, however, is incompletely understood.
While conducting experiments investigating the acute effects of exogenous PTH on FGF23 production in mice, which required repeated bleeding, we observed that cFGF23 levels in the control mice tended to increase over time (15). In addition, markers of anemia have been linked with elevated FGF23 levels in patients with chronic kidney disease, independent of iron status (27, 28). We therefore sought to determine whether acute blood loss affects FGF23 production and to thus identify additional mechanisms that regulate FGF23 homeostasis.
MATERIALS AND METHODS
Experimental Animals
Wild-type C57BL/6 mice were purchased from Charles River Laboratory (Wilmington, MA) and were housed in the department of Comparative Medicine at New York Medical College (NYMC; Valhalla, NY). Animals were exposed to 12:12-h light-dark cycles and had access to food and water ad libitum. Experiments were performed in 6–8 wk old male mice. All mice experiments were performed in accordance with the guidelines of Institutional Animal Care and Use Committee (IACUC) and followed the protocols approved by IACUC at NYMC.
Experimental mice were placed in a restrainer and were bled only once via a 1-mm tail incision. Approximately 10% of total blood volume (TBV) was removed from experimental mice, as determined by weight; this was roughly 0.8% of total body weight (e.g., 180 μl blood from a 22-g mouse). Control mice were kept in a restrainer for the same amount of time as the experimental group. Whole blood from control and experimental mice was collected at 2, 4, 6, 24, or 48 h after the initial bleed depending on the experiment (as indicated in the text). Each animal was bled once at t = 0 (or not if control) and then only one more time at the prespecified time point (e.g., either 6 or 24 h but not both). Blood was collected in heparinized capillary tubes (Fisher Scientific, Hampton, NH), and the plasma was separated by centrifugation at 8,000 rpm for 10 min. For mRNA analyses (discussed below), separate subsets of mice were euthanized after 6 h via cervical dislocation, and bone marrow, femur, and calvaria bones were harvested. Bone marrow was flushed from femur bone by centrifugation.
Drug Treatment
For erythropoietin injections, rhEPO (Sigma-Aldrich, St. Louis, MO) was injected at 50 IU ip/mouse; vehicle-injected mice received a similar volume of PBS.
Biochemical Analyses in Mice
Biochemical measurements were done on plasma samples using commercially available kits: calcium was measured using a Calcium (CPC) Liquicolor kit (Stanbio Laboratory, Boerne, TX); iron was measured using an Iron/TIBC kit (Pointe Scientific, Canton, MI); blood urea nitrogen (BUN) was measured using a Blood Urea Nitrogen Stanbio kit (Stanbio Laboratory); PTH was measured using a Mouse Intact PTH ELISA Kit (Immutopics, San Clemente, CA); iFGF23 was measured using a Mouse/Rat FGF-23 (Intact) ELISA kit (Immutopics); C-terminal FGF23 was measured using a Mouse/Rat FGF-23 (C-Term) ELISA kit (Immutopics); epogen was measured using a mouse Erythropoietin Quantikine ELISA kit (R&D Systems, Minneapolis, MN); phosphate was measured using a Phospho-C Test Wako kit (Wako Pure Chemical Industries, Osaka, Japan). All procedures were completed per the manufacturer’s directions.
Bone Marrow Cell Sorting
Bone marrow cells obtained from femurs of bled or control mice were separated using positive selection for the erythroid lineage marker Ter119 (4). Ter119-coated magnetic beads were used to select erythroid precursors and mature erythrocytes as per the manufacturer’s instructions (Miltenyi Biotec, Gaithersburg, MD). mRNA was then extracted from Ter119+ cells and the remaining bone marrow cells (Ter119-).
Quantitative Real-Time PCR Analysis
Femur, calvaria bone, and bone marrow were homogenized in TRIzol (Invitrogen, Carlsbad, CA) reagent, and RNA was isolated using a PureLink RNA Mini kit (Invitrogen), as per the manufacturer’s instructions. During isolation, RNA was treated on-column with RNase-free DNase set (Qiagen, Venlo, Limburg, The Netherlands), according to the manufacturer’s protocol, to eliminate DNA contamination. Total RNA (250 ng–1 µg) was reverse transcribed to cDNA using a High-Capacity RNA-to-cDNA Kit (Applied Biosystems, Foster City, CA) in accordance with the manufacturer’s protocol. Subsequently, quantitative real-time PCR (qRT-PCR) was performed using Perfecta SYBR Fast mix Low ROX 1250 (Quanta Biosciences) and analyzed using Stratagene MX3000P (Agilent Technologies, Santa Clara, CA). Relative expression was calculated for each sample and normalized to actin, and fold-change was calculated in comparison with control samples.
Protein Analyses
Bone marrow proteins flushed from femurs at 6 h were solubilized using commercially available lysis buffer (Cell Signaling). Bone lysates were prepared as described (15). FGF23 protein levels were measured using an Immutopics ELISA kit after 1:1 dilution of samples with std 0. In pilot experiments, this amount of lysis buffer did not affect measurements significantly. Results were normalized to the amount of total input protein.
Statistical Analyses for Animal Studies
Microsoft Excel was used for statistical analysis, and comparisons between groups were evaluated by an unpaired Student’s t-test. Longitudinal comparisons within groups (circulating cFGF23 levels over time following acute blood loss) were evaluated by a paired Student’s t-test. All comparisons are two-tailed, with P < 0.05 considered significant.
Human ICU Cohort
Overview.
We conducted a prospective cohort study in 131 patients admitted to intensive care units (ICUs) at Brigham and Women’s Hospital (Boston, MA) to assess the association between transfusion of packed red blood cells (pRBCs), an indirect indicator of acute blood loss, and plasma cFGF23 levels. Detailed methodology is reported elsewhere (19). In brief, we collected and stored EDTA plasma aliquots within 24 h of arrival to the ICU. Samples were stored at −80°C within 2 h of collection. All patients provided written informed consent, and all protocols were approved by our hospital’s Institutional Review Board.
Inclusion/exclusion criteria.
Inclusion criteria were age >18 yr and admission to a medical or surgical ICU. Exclusion criteria were 1) anticipated ICU stay <24 h; 2) admitted to the ICU for a low-risk condition; 3) serum creatinine >4.5 mg/dl or receiving dialysis; and 4) pregnancy.
Measurement of cFGF23 in humans.
We measured plasma cFGF23 levels in duplicate using a commercial ELISA kit (Immutopics). The interassay coefficient of variation, calculated using blinded replicate samples from study patients, was 11.5%.
Statistical analyses.
Statistical analysis was performed with SAS Version 9.4 (Cary, NC). Univariate and multivariate linear regression was used to assess the association between the number of pRBC transfusions within 48 h before ICU admission and plasma cFGF23 levels on arrival to the ICU. In these models, cFGF23 levels were natural log-transformed, due to their skewed distribution. Multivariate models were adjusted for age, gender, baseline estimated glomerular filtration rate (eGFR), phosphate, calcium, PTH, Acute Physiology and Chronic Health Evaluation (APACHE) II score, AKI on enrollment (yes/no), and mechanical ventilation on enrollment. All comparisons are two-tailed, with P < 0.05 considered significant.
RESULTS
Circulating cFGF23 Levels Increase After Acute Blood Loss
Plasma cFGF23 levels measured 6 h after acute blood loss were significantly higher compared with control mice that were not bled (Fig. 1A). While the peak increase in cFGF23 levels occurred at 6 h after blood loss, cFGF23 levels remained significantly elevated compared with baseline levels for up to 48 h after an acute bleed (Fig. 1B). Since the peak increase occurred at 6 h, subsequent experiments and measurements were also performed at the 6-h time point unless otherwise indicated. Plasma phosphate, calcium, and PTH levels were similar between the two groups (Fig. 1, C, D, and E). BUN levels were also no different between the two groups (21.7 ± 0.7 and 21.9 ± 0.47 mg/dl in control and bled mice, respectively; P = 0.97), indicating that renal function was not acutely impaired by the volume loss. Interestingly, iFGF23 levels were also similar at 6 h in mice with acute blood loss vs. without acute blood loss (Fig. 1F).
Fig. 1.

FGF23 and mineral metabolism marker levels in mice after acute blood loss. All “bled” mice lost ∼10% of total blood volume (or 0.8% body weight) over 90–120 s; control mice spent a similar amount of time in the bleeding holder but were not bled. A: levels of plasma C-terminal (c)FGF23 in bled and control mice 6 h after an acute bleed. The time 0 levels could only be determined in the bled group since the control group was not bled at time 0. B: percent change in cFGF23 levels compared with time 0 levels at different time points after an acute bleed. Each group of mice was bled just once after the initial acute bleed at time 0 to avoid the effect of repetitive blood loss; n = 5 or more mice/group. At all time points, the respective cFGF23 levels were significantly elevated compared with time 0 (i.e., time 2 h vs. time 0, time 6 h vs. time 0, etc.). C: phosphate levels in bled and control mice 6 h after an acute bleed. The time 0 levels could only be determined in the bled group. D: calcium levels in bled and control mice 6 h after an acute bleed. E: PTH levels in bled and control mice 6 h after an acute bleed. F: intact (i)FGF23 levels 6 h after acute blood loss. bld, bleed; ctl, control; NA, not applicable. Bars represent means and SE. *P < 0.05 comparing control vs. bled group at the indicated time points (between-group comparison).
Role of Volume Depletion in FGF23 Elevation After Acute Blood Loss
We sought to determine whether the increase in cFGF23 levels was a consequence of volume loss. We thus administered an intraperitoneal (ip) injection of PBS at 2.5–3 × the volume lost during bleeding to account for redistribution into the vasculature. This injection was given within 15 min after bleeding. We gave control mice the same volume. As shown in Fig. 2, despite the volume resuscitation cFGF23 levels remained significantly higher in bled vs. control mice.
Fig. 2.
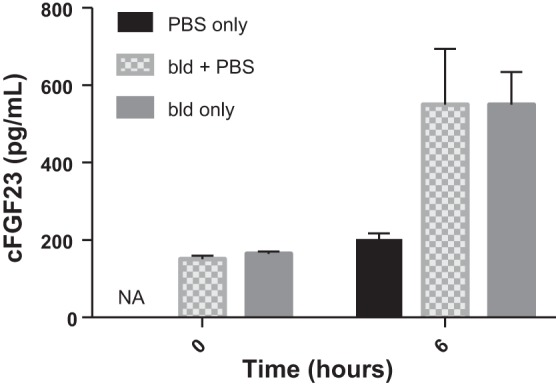
Restoring lost circulating volume has no effect on cFGF23 levels 6 h after acute blood loss. Both control and bled animals were injected with PBS at a volume 2.5–3 × the volume lost through bleeding; n = 5 mice/group.
Role of Iron Deficiency in FGF23 Elevation After Acute Blood Loss
Since iron deficiency has been implicated in upregulating FGF23 transcription (8), we measured iron and ferritin levels 6 h after acute blood loss. Iron levels were similar between the two groups (116 ± 19 and 134 ± 8 μg/dl in control and bled mice, respectively; P = 0.38). Ferritin levels were also similar between groups (1,095 ± 158 and 1038 ± 157 ng/ml in control and bled mice, respectively; P = 0.81).
Erythropoietin Increases FGF23 Levels
After acute blood loss in dogs, plasma erythropoietin (EPO) levels increase within 3 h (7). We therefore investigated EPO levels in our mice. Six hours after bleeding, EPO levels were significantly elevated in bled vs. control mice (775 ± 145 in bled vs 254 ± 61 pg/ml in control mice; P = 0.03). We next sought to determine whether exogenous EPO administration can lead to increased plasma FGF23 levels. We injected human recombinant EPO at a dose of 50 IU ip into mice and then assessed cFGF23 and iFGF23 levels. As shown on Fig. 3A, cFGF23 levels increased significantly as early as 3 h (but not 1 h; data not shown) postinjection compared with vehicle-injected mice, and then decreased slightly by 6 h post-EPO injection. Similar to what we observed for acute blood loss, intact FGF23 levels did not change after EPO injection (Fig. 3B) assessed at 3 and 6 h.
Fig. 3.

Role of erythropoietin (EPO). A: cFGF23 levels before and 3 and 6 h after 50 IU EPO or vehicle injection; n = 5 mice/group. B: iFGF23 levels before and 3 and 6 h after 50 IU EPO or vehicle injection; n = 5 mice/group. *P < 0.05 comparing bled vs. control groups at each time point.
Fgf23 mRNA Expression is Elevated in Bone Marrow But Not Bone After Acute Blood Loss
To investigate the site of production of FGF23 after acute blood loss, we assessed Fgf23 mRNA levels in femur bone after flushing out the bone marrow and found that mRNA levels were no different 6 h after acute blood loss compared with control mice (Fig. 4A, left); similar results were obtained for calvarial bone (data not shown). Next we measured Fgf23 mRNA in bone marrow, since others have reported expression of Fgf23 mRNA in isolated bone marrow erythroid cells in adult mice (4). Fgf23 mRNA levels in the bone marrow fraction were significantly elevated in bled vs. control mice (Fig. 4A, right). We also assessed the mRNA expression of three other known modulators of FGF23: Furin, Fam20c, and Galnt3. While Furin and Fam20c expression were similar in bled vs. control mice, Galnt3 mRNA levels were significantly decreased in bled vs. control mice (Fig. 4B). We further separated bone marrow cells into those of erythroid lineage (erythroid precursors and mature erythroblasts) and those of nonerythroid lineage using the erythroid cell surface marker Ter119 to determine which bone marrow cell population upregulates Fgf23 after acute blood loss. As shown in Fig. 4C, Ter119+ cells, or erythroid precursors and mature erythroblasts, show elevated levels of Fgf23 mRNA after acute blood loss compared with Ter119- cells. In Ter119+ cells Furin, Fam20c, and Galnt3 expression levels were similar in bled vs. control mice, different from our results for unfractionated bone marrow cells (data not shown, Fig. 4B).
Fig. 4.

A: Fgf23 mRNA levels in bone and bone marrow from control and bled mice 6 h after acute blood loss. Levels in bone femur and calvaria were not different in the bled and control groups (here femur is shown). Expression levels are normalized to actin expression. B: mRNA levels in bone marrow of Furin, Fam20c and Galnt3 as normalized to actin; n = 4 mice/group. C: Fgf23 mRNA levels in Ter119+ vs. Ter119- cells from bone marrow of control and bled mice 6 h after acute blood loss. Levels are normalized to actin; n = 4 mice/group. D: cFGF23 protein levels in bone lysates after 6 h in bled vs. control mice. E: cFGF23 protein levels in bone marrow lysates after 6 h in bled vs. control mice. Protein levels in D and E were measured using a cFGF23 ELISA kit and normalized to total input protein. *P < 0.05 comparing bled vs. control groups at 6 h.
We further sought to determine whether the effects of acute blood loss on Fgf23 mRNA expression could be reproduced with exogenous EPO administration. Fgf23 mRNA levels increased in the bone marrow of EPO-treated mice compared with vehicle-treated mice (8.6 ± 2.3 in EPO-treated mice vs. 1.2 ± 0.3 in vehicle-treated mice, mRNA expression normalized to actin, P = 0.03). Levels in bone were unchanged (data not shown).
FGF23 Protein Levels are Elevated in Bone Marrow But Not Bone After Acute Blood Loss
To determine whether the elevated Fgf23 mRNA levels after acute blood loss correlate with elevated FGF23 protein levels, we measured FGF23 protein in lysates from bone marrow and cortical bone in control and bled mice. As shown in Fig. 4, D and E, FGF23 protein levels in bone were not different between the control and bled groups, while FGF23 protein levels were elevated in bone marrow lysates from bled mice compared with control mice.
FGF23 Levels are Increased in Critically Ill Patients After pRBC Transfusion
To investigate whether similar increases in FGF23 are found in humans experiencing acute blood loss, we measured plasma cFGF23 levels in a cohort of patients within 24 h of arrival to the ICU. We reasoned that transfusion of pRBCs within 48 h before ICU arrival could be used as a surrogate for acute blood loss in this patient population. Baseline characteristics of this cohort are shown in Table 1. We found that transfusion of a greater number of pRBCs was associated with higher plasma cFGF23 levels (Fig. 5 and Table 2). In multivariate models adjusted for age, gender, baseline eGFR, calcium, phosphate, PTH, APACHE II score, AKI, and mechanical ventilation, the association was unchanged (Table 2).
Table 1.
Baseline characteristics of ICU patient cohort
| Characteristic | n = 131 |
|---|---|
| Demographics | 63 (56–73) |
| Age, yr, median (IQR) | |
| Male gender, n (%) | 82 (63) |
| White race, n (%) | 120 (92) |
| Baseline renal function | |
| SCr (mg/dl), median (IQR)a | 0.7 (0.5–0.9) |
| eGFR (ml·min−1·1.73 m−2), median (IQR)b | 97 (81–107) |
| Chronic kidney disease, n (%)c | 8 (6) |
| Comorbidities, n (%) | |
| Hypertension | 69 (53) |
| Diabetes mellitus | 30 (23) |
| Active malignancy | 40 (31) |
| COPD | 40 (31) |
| Surgical ICU, n (%) | 109 (83) |
| Severity of illness | |
| APACHE II score, median (IQR)d | 14 (11–18) |
| Urgent surgery, n (%) | 63 (48) |
| Mechanical ventilation, n (%) | 105 (80) |
| AKI on enrollment, n (%)e | 10 (8) |
Data are shown as median (IQR). AKI, acute kidney injury; APACHE II, Acute Physiology and Chronic Health Evaluation II; COPD, chronic obstructive pulmonary disease; eGFR, estimated glomerular filtration rate; ICU, intensive care unit; IQR, interquartile range; SCr, serum creatinine; CKD-EPI, chronic kidney disease-epidemiology.
Defined as the lowest value within 365 days before hospitalization. If no SCr values were available before hospitalization, the lowest SCr during hospitalization (excluding values obtained during renal replacement therapy) was used as the baseline (25).
Determined using the CKD-EPI equation (20).
Defined as baseline eGFR <60 ml·min−1·1.73 m−2.
An ICU severity of illness scoring system ranging from 0 to 71, with higher scores indicating more severe disease.
Defined as an increase in SCr ≥0.3 mg/dl within 48 h, ≥50% in 7 days, or need for renal replacement therapy (14).
Fig. 5.
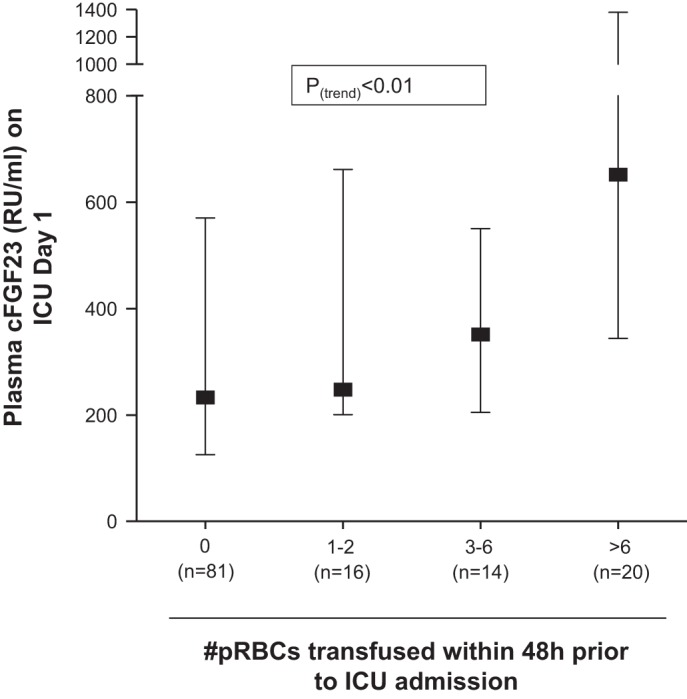
Transfusion of pRBCs before ICU admission is positively associated with plasma cFGF23 levels. Shown are median (interquartile range) values for cFGF23.
Table 2.
Linear regression model showing the association between number of pRBC transfusions and natural log-transformed plasma cFGF23 levels
| Univariate |
Multivariate |
|||||
|---|---|---|---|---|---|---|
| β | SE | P Value | β | SE | P Value | |
| pRBC transfusions (no. of units) | 0.07 | 0.03 | 0.03 | 0.06 | 0.03 | 0.05 |
| Age, yr | 0.000 | 0.01 | 0.99 | |||
| Male gender | −0.08 | 0.25 | 0.75 | |||
| Baseline eGFR (ml·min−1·1.73 m−2) | −0.01 | 0.01 | 0.09 | |||
| APACHE II score | 0.04 | 0.03 | 0.10 | |||
| AKI on enrollment | 0.40 | 0.47 | 0.40 | |||
| Mechanical ventilation | −0.11 | 0.32 | 0.72 | |||
| Calcium | −0.14 | 0.13 | 0.30 | |||
| Phosphate | 0.28 | 0.12 | 0.02 | |||
| Parathyroid hormone | 0.003 | 0.002 | 0.13 | |||
N = 131 (univariate); n = 105 (multivariate). SE, standard error.
DISCUSSION
We found that acute blood loss leads to increased circulating levels of cFGF23, but not iFGF23, in wild-type mice. These effects were observed as early as 6 h following acute blood loss and were detected up to 48 h after the event. Furthermore, we found increased Fgf23 mRNA transcription in the bone marrow, but not bone, following acute blood loss, suggesting bone marrow as the source of increased circulating cFGF23 levels. The effects of acute blood loss on FGF23 appeared to be independent of iron deficiency and potentially dependent on EPO signaling, since exogenous EPO largely reproduced the effects of blood loss on FGF23 regulation. These findings extend prior observations of the effects of anemia and iron deficiency on FGF23 production.
Our observations that acute blood loss leads to increased circulating cFGF23 levels but not iFGF23 levels suggest that increased FGF23 production is coupled with increased cleavage. Similar findings of elevated circulating cFGF23 levels but normal or only mildly increased iFGF23 levels have been observed in humans with chronic anemia (29), acute kidney injury (18), and in animals on a low-iron diet (8, 11). While the precise mechanisms are unknown, some have hypothesized that this coupling exists to prevent hypophosphatemia, which may result if intact FGF23 levels were increased chronically. Interestingly, in our recent study on the effects of acute PTH injection on FGF23 production, we found a similar coupling of increased Fgf23 transcription and increased circulating cFGF23 but not iFGF23 levels (15). Thus the coupling of production and degradation may be a default mechanism of FGF23 production under different stimuli, with the degradation step being the ultimate control point.
Blood loss could result in iron deficiency, a known regulator of FGF23 production and cleavage (5, 8). However, in the early time frame of our experiments total iron and ferritin levels were similar in bled and control mice, and thus we conclude that iron deficiency was not likely an important mechanism driving the initial increase in FGF23 production, although an effect of iron deficiency on later increases in cFGF23 levels observed at 24 and 48 h cannot be excluded. Additionally, we cannot exclude the possibility of “subacute” iron deficiency that might only be detectable locally and thus might not be observed using traditional circulating iron parameters.
Circulating EPO levels increase 60–90 min after acute exposure to hypoxia in humans (6) and within 3–6 h of bleeding or hypovolemia in rats and dogs (7, 21), and were elevated in our mice 6 h after bleeding (Fig. 3A). We therefore investigated whether an EPO injection can acutely increase FGF23 levels in the circulation. Three hours after EPO injection, cFGF23 levels were increased, while intact FGF23 levels remained similar to vehicle-injected controls. Similarly to what was observed in bled animals, Fgf23 mRNA and protein levels increased in the bone marrow, but not bone, of EPO-treated mice compared with vehicle-treated mice. Thus our data suggest that the increases in Fgf23 mRNA transcription in the bone marrow, and specifically in erythroid precursors, and the increases in circulating cFGF23 levels in the circulation following an episode of acute blood loss may be due to increases in EPO. Signaling through the EPO receptor activates multiple pathways including MAPK and phosphoinositide-3 kinase (PI-3K)/AKT (16), both of which have been shown to control expression of FGF23 in vitro in osteoblasts (31), suggesting a possible mechanism through which EPO may regulate FGF23 production. There is no currently known potential role for increased FGF23 production in acute anemia. Since FGF23 was shown to inhibit erythropoiesis in mice and reduce EPO levels (4), it is conceivable that it may participate in a negative feedback loop with EPO, which stimulates erythropoiesis. Further complicating these pathways, FGF23 inhibits the activation of 1,25-dihydroxyvitamin D (24), and the latter downregulates hepcidin (1), the main hormone responsible for maintaining systemic iron homeostasis. Thus it is likely that multiple feedback loops and redundant pathways are responsible for maintaining erythropoiesis homeostasis.
Our study further includes patient data on the association between plasma cFGF23 levels and blood transfusions during the prior 48 h. The association remained significant even after adjustment for several covariates known to affect FGF23 levels. These human data are consistent with an effect of acute bleeding on FGF23 levels, although the time frame examined is longer than in the animal studies, and thus we cannot exclude an effect of iron deficiency on FGF23 production in this cohort. In addition, blood products may contribute a phosphate load due to phosphate present in the preservative, although this is half the amount compared with the low dose intravenous (iv) phosphate load recently reported by Scanni et al. (23) in their paper on the human response to iv phosphate challenge. The magnitude of change we observed is much greater than that reported by these investigators after oral or iv phosphate loading. Nonetheless, these data suggest that acute blood loss may be an additional factor influencing FGF23 production in hospitalized patients and deserves further study.
A limitation of the human arm of our study is the lack of concurrent intact FGF23 measurements to confirm the animal observations on increased cleavage. However, our previous work demonstrated that plasma iFGF23 levels increase only modestly even in patients with severe AKI (18). Additionally, while we adjusted for a number of clinical characteristics in multivariate models, we acknowledge that residual confounding may nonetheless be present. A limitation of our animal study is that it looked at the effect of a single episode of acute loss of large blood volume on FGF23 production in adult wild-type mice with normal renal function.
We have identified EPO as a potential mediator of the increased FGF23 production associated with acute blood loss described here, although our results do not exclude the possibility that other molecules or pathways may be playing a role. FGF23 has emerged as a powerful predictor of morbidity and mortality in all patient populations; thus it is important to continue to elucidate mechanisms that affect its production.
GRANTS
This work was supported by National Institute of Diabetes and Digestive Kidney Diseases Grants K23DK106448 (to D. E. Leaf) and K08DK093608 (to M. Christov) and by the Westchester Community Foundation (to M. Christov).
DISCLOSURES
No conflicts of interest, financial or otherwise, are declared by the authors.
AUTHOR CONTRIBUTIONS
S.R., I.U., D.E.L., S.W., and M.C. performed experiments; S.R., D.E.L., and M.C. analyzed data; S.R., D.E.L., S.W., and M.C. edited and revised manuscript; S.R., I.U., D.E.L., S.W., and M.C. approved final version of manuscript; D.E.L. and M.C. conceived and designed research; D.E.L. and M.C. interpreted results of experiments; D.E.L. and M.C. prepared figures; M.C. drafted manuscript.
ACKNOWLEDGMENTS
The authors thank H. Jüppner for helpful comments on the manuscript.
REFERENCES
- 1.Bacchetta J, Zaritsky JJ, Sea JL, Chun RF, Lisse TS, Zavala K, Nayak A, Wesseling-Perry K, Westerman M, Hollis BW, Salusky IB, Hewison M. Suppression of iron-regulatory hepcidin by vitamin D. J Am Soc Nephrol 25: 564–572, 2014. doi: 10.1681/ASN.2013040355. [DOI] [PMC free article] [PubMed] [Google Scholar]
- 2.Bergwitz C, Jüppner H. Regulation of phosphate homeostasis by PTH, vitamin D, and FGF23. Annu Rev Med 61: 91–104, 2010. doi: 10.1146/annurev.med.051308.111339. [DOI] [PMC free article] [PubMed] [Google Scholar]
- 3.Carrillo-López N, Panizo S, Alonso-Montes C, Román-García P, Rodríguez I, Martínez-Salgado C, Dusso AS, Naves M, Cannata-Andía JB. Direct inhibition of osteoblastic Wnt pathway by fibroblast growth factor 23 contributes to bone loss in chronic kidney disease. Kidney Int 90: 77–89, 2016. doi: 10.1016/j.kint.2016.01.024. [DOI] [PubMed] [Google Scholar]
- 4.Coe LM, Madathil SV, Casu C, Lanske B, Rivella S, Sitara D. FGF-23 is a negative regulator of prenatal and postnatal erythropoiesis. J Biol Chem 289: 9795–9810, 2014. doi: 10.1074/jbc.M113.527150. [DOI] [PMC free article] [PubMed] [Google Scholar]
- 5.David V, Martin A, Isakova T, Spaulding C, Qi L, Ramirez V, Zumbrennen-Bullough KB, Sun CC, Lin HY, Babitt JL, Wolf M. Inflammation and functional iron deficiency regulate fibroblast growth factor 23 production. Kidney Int 89: 135–146, 2016. doi: 10.1038/ki.2015.290. [DOI] [PMC free article] [PubMed] [Google Scholar]
- 6.Eckardt KU, Boutellier U, Kurtz A, Schopen M, Koller EA, Bauer C. Rate of erythropoietin formation in humans in response to acute hypobaric hypoxia. J Appl Physiol (1985) 66: 1785–1788, 1989. [DOI] [PubMed] [Google Scholar]
- 7.Ehmke H, Just A, Eckardt KU, Persson PB, Bauer C, Kirchheim HR. Modulation of erythropoietin formation by changes in blood volume in conscious dogs. J Physiol 488: 181–191, 1995. doi: 10.1113/jphysiol.1995.sp020956. [DOI] [PMC free article] [PubMed] [Google Scholar]
- 8.Farrow EG, Yu X, Summers LJ, Davis SI, Fleet JC, Allen MR, Robling AG, Stayrook KR, Jideonwo V, Magers MJ, Garringer HJ, Vidal R, Chan RJ, Goodwin CB, Hui SL, Peacock M, White KE. Iron deficiency drives an autosomal dominant hypophosphatemic rickets (ADHR) phenotype in fibroblast growth factor-23 (Fgf23) knock-in mice. Proc Natl Acad Sci USA 108: E1146–E1155, 2011. doi: 10.1073/pnas.1110905108. [DOI] [PMC free article] [PubMed] [Google Scholar]
- 9.Faul C, Amaral AP, Oskouei B, Hu M-C, Sloan A, Isakova T, Gutiérrez OM, Aguillon-Prada R, Lincoln J, Hare JM, Mundel P, Morales A, Scialla J, Fischer M, Soliman EZ, Chen J, Go AS, Rosas SE, Nessel L, Townsend RR, Feldman HI, St John Sutton M, Ojo A, Gadegbeku C, Di Marco GS, Reuter S, Kentrup D, Tiemann K, Brand M, Hill JA, Moe OW, Kuro-o M, Kusek JW, Keane MG, Wolf M. FGF23 induces left ventricular hypertrophy. J Clin Invest 121: 4393–4408, 2011. doi: 10.1172/JCI46122. [DOI] [PMC free article] [PubMed] [Google Scholar]
- 10.Gutiérrez OM, Mannstadt M, Isakova T, Rauh-Hain JA, Tamez H, Shah A, Smith K, Lee H, Thadhani R, Jüppner H, Wolf M. Fibroblast growth factor 23 and mortality among patients undergoing hemodialysis. N Engl J Med 359: 584–592, 2008. doi: 10.1056/NEJMoa0706130. [DOI] [PMC free article] [PubMed] [Google Scholar]
- 11.Hanudel MR, Chua K, Rappaport M, Gabayan V, Valore E, Goltzman D, Ganz T, Nemeth E, Salusky IB. Effects of dietary iron intake and chronic kidney disease on fibroblast growth factor 23 metabolism in wild-type and hepcidin knockout mice. Am J Physiol Renal Physiol 311: F1369–F1377, 2016. doi: 10.1152/ajprenal.00281.2016. [DOI] [PMC free article] [PubMed] [Google Scholar]
- 12.Imel EA, Peacock M, Gray AK, Padgett LR, Hui SL, Econs MJ. Iron modifies plasma FGF23 differently in autosomal dominant hypophosphatemic rickets and healthy humans. J Clin Endocrinol Metab 96: 3541–3549, 2011. doi: 10.1210/jc.2011-1239. [DOI] [PMC free article] [PubMed] [Google Scholar]
- 13.Isakova T, Xie H, Yang W, Xie D, Anderson AH, Scialla J, Wahl P, Gutiérrez OM, Steigerwalt S, He J, Schwartz S, Lo J, Ojo A, Sondheimer J, Hsu CY, Lash J, Leonard M, Kusek JW, Feldman HI, Wolf M; Chronic Renal Insufficiency Cohort (CRIC) Study Group . Fibroblast growth factor 23 and risks of mortality and end-stage renal disease in patients with chronic kidney disease. JAMA 305: 2432–2439, 2011. doi: 10.1001/jama.2011.826. [DOI] [PMC free article] [PubMed] [Google Scholar]
- 14.Kidney Disease Improving Global Outcomes (KDIGO); Acute Kidney Injury Work Group KDIGO clinical practice guideline for acute kidney injury. Kidney Int Suppl 2: 1–138, 2012. doi: 10.1038/kisup.2012.2. [DOI] [Google Scholar]
- 15.Knab VM, Corbin B, Andrukhova O, Hum JM, Ni P, Rabadi S, Maeda A, White KE, Erben RG, Jüppner H, Christov M. Acute parathyroid hormone injection increases C-terminal, but not intact fibroblast growth factor 23 levels. Endocrinology 158: 1130–1139, 2017. doi: 10.1210/en.2016-1451. [DOI] [PMC free article] [PubMed] [Google Scholar]
- 16.Kuhrt D, Wojchowski DM. Emerging EPO and EPO receptor regulators and signal transducers. Blood 125: 3536–3541, 2015. doi: 10.1182/blood-2014-11-575357. [DOI] [PMC free article] [PubMed] [Google Scholar]
- 17.Lavi-Moshayoff V, Wasserman G, Meir T, Silver J, Naveh-Many T. PTH increases FGF23 gene expression and mediates the high-FGF23 levels of experimental kidney failure: a bone parathyroid feedback loop. Am J Physiol Renal Physiol 299: F882–F889, 2010. doi: 10.1152/ajprenal.00360.2010. [DOI] [PubMed] [Google Scholar]
- 18.Leaf DE, Christov M, Jüppner H, Siew E, Ikizler TA, Bian A, Chen G, Sabbisetti VS, Bonventre JV, Cai X, Wolf M, Waikar SS. Fibroblast growth factor 23 levels are elevated and associated with severe acute kidney injury and death following cardiac surgery. Kidney Int 89: 939–948, 2016. doi: 10.1016/j.kint.2015.12.035. [DOI] [PMC free article] [PubMed] [Google Scholar]
- 19.Leaf DE, Jacob KA, Srivastava A, Chen ME, Christov M, Jüppner H, Sabbisetti VS, Martin A, Wolf M, Waikar SS. Fibroblast growth factor 23 levels associate with AKI and death in critical illness. J Am Soc Nephrol 28: 1877–1885, 2017. doi: 10.1681/ASN.2016080836. [DOI] [PMC free article] [PubMed] [Google Scholar]
- 20.Levey AS, Stevens LA, Schmid CH, Zhang YL, Castro AF III, Feldman HI, Kusek JW, Eggers P, Van Lente F, Greene T, Coresh J; CKD-EPI (Chronic Kidney Disease Epidemiology Collaboration) . A new equation to estimate glomerular filtration rate. Ann Intern Med 150: 604–612, 2009. doi: 10.7326/0003-4819-150-9-200905050-00006. [DOI] [PMC free article] [PubMed] [Google Scholar]
- 21.Miller ME, Rörth M, Stohlman F Jr, Valeri CR, Lowrie G, Howard D, McGilvray N. The effects of acute bleeding on acid-base balance erythropoietin (Ep) production and in vivo P50 in the rat. Br J Haematol 33: 379–385, 1976. doi: 10.1111/j.1365-2141.1976.tb03554.x. [DOI] [PubMed] [Google Scholar]
- 22.Rossaint J, Oehmichen J, Van Aken H, Reuter S, Pavenstädt HJ, Meersch M, Unruh M, Zarbock A. FGF23 signaling impairs neutrophil recruitment and host defense during CKD. J Clin Invest 126: 962–974, 2016. doi: 10.1172/JCI83470. [DOI] [PMC free article] [PubMed] [Google Scholar]
- 23.Scanni R, vonRotz M, Jehle S, Hulter HN, Krapf R. The human response to acute enteral and parenteral phosphate loads. J Am Soc Nephrol 25: 2730–2739, 2014. doi: 10.1681/ASN.2013101076. [DOI] [PMC free article] [PubMed] [Google Scholar]
- 24.Shimada T, Hasegawa H, Yamazaki Y, Muto T, Hino R, Takeuchi Y, Fujita T, Nakahara K, Fukumoto S, Yamashita T. FGF-23 is a potent regulator of vitamin D metabolism and phosphate homeostasis. J Bone Miner Res 19: 429–435, 2004. doi: 10.1359/JBMR.0301264. [DOI] [PubMed] [Google Scholar]
- 25.Siew ED, Matheny ME. Choice of Reference Serum Creatinine in Defining Acute Kidney Injury. Nephron 131: 107–112, 2015. doi: 10.1159/000439144. [DOI] [PMC free article] [PubMed] [Google Scholar]
- 26.Singh S, Grabner A, Yanucil C, Schramm K, Czaya B, Krick S, Czaja MJ, Bartz R, Abraham R, Di Marco GS, Brand M, Wolf M, Faul C. Fibroblast growth factor 23 directly targets hepatocytes to promote inflammation in chronic kidney disease. Kidney Int 90: 985–996, 2016. doi: 10.1016/j.kint.2016.05.019. [DOI] [PMC free article] [PubMed] [Google Scholar]
- 27.Tsai MH, Leu JG, Fang YW, Liou HH. High Fibroblast Growth Factor 23 Levels Associated With Low Hemoglobin Levels in Patients With Chronic Kidney Disease Stages 3 and 4. Medicine (Baltimore) 95: e3049, 2016. doi: 10.1097/MD.0000000000003049. [DOI] [PMC free article] [PubMed] [Google Scholar]
- 28.van Breda F, Emans ME, van der Putten K, Braam B, van Ittersum FJ, Kraaijenhagen RJ, de Borst MH, Vervloet M, Gaillard CA. Relation between Red Cell Distribution Width and Fibroblast Growth Factor 23 Cleaving in Patients with Chronic Kidney Disease and Heart Failure. PLoS One 10: e0128994, 2015. doi: 10.1371/journal.pone.0128994. [DOI] [PMC free article] [PubMed] [Google Scholar]
- 29.Wolf M, Koch TA, Bregman DB. Effects of iron deficiency anemia and its treatment on fibroblast growth factor 23 and phosphate homeostasis in women. J Bone Miner Res 28: 1793–1803, 2013. doi: 10.1002/jbmr.1923. [DOI] [PubMed] [Google Scholar]
- 30.Wolf M, White KE. Coupling fibroblast growth factor 23 production and cleavage: iron deficiency, rickets, and kidney disease. Curr Opin Nephrol Hypertens 23: 411–419, 2014. doi: 10.1097/01.mnh.0000447020.74593.6f. [DOI] [PMC free article] [PubMed] [Google Scholar]
- 31.Xiao Z, Huang J, Cao L, Liang Y, Han X, Quarles LD. Osteocyte-specific deletion of Fgfr1 suppresses FGF23. PLoS One 9: e104154, 2014. doi: 10.1371/journal.pone.0104154. [DOI] [PMC free article] [PubMed] [Google Scholar]