Abstract
The urea channel UT-A1 and the water channel aquaporin-2 (AQP2) mediate vasopressin-regulated transport in the renal inner medullary collecting duct (IMCD). To identify the proteins that interact with UT-A1 and AQP2 in native rat IMCD cells, we carried out chemical cross-linking followed by detergent solubilization, immunoprecipitation, and LC-MS/MS analysis of the immunoprecipitated material. The analyses revealed 133 UT-A1-interacting proteins and 139 AQP2-interacting proteins, each identified in multiple replicates. Fifty-three proteins that were present in both the UT-A1 and the AQP2 interactomes can be considered as mediators of housekeeping interactions, likely common to all plasma membrane proteins. Among proteins unique to the UT-A1 list were those involved in posttranslational modifications: phosphorylation (protein kinases Cdc42bpb, Phkb, Camk2d, and Mtor), ubiquitylation/deubiquitylation (Uba1, Usp9x), and neddylation (Nae1 and Uba3). Among the proteins unique to the AQP2 list were several Rab proteins (Rab1a, Rab2a, Rab5b, Rab5c, Rab7a, Rab11a, Rab11b, Rab14, Rab17) involved in membrane trafficking. UT-A1 was found to interact with UT-A3, although quantitative proteomics revealed that most UT-A1 molecules in the cell are not bound to UT-A3. In vitro incubation of UT-A1 peptides with the protein kinases identified in the UT-A1 interactome revealed that all except Mtor were capable of phosphorylating known sites in UT-A1. Overall, the UT-A1 and AQP2 interactomes provide a snapshot of a dynamic process in which UT-A1 and AQP2 are produced in the rough endoplasmic reticulum, processed through the Golgi apparatus, delivered to endosomes that move into and out of the plasma membrane, and are regulated in the plasma membrane.
Keywords: vasopressin, urea, water, protein kinase, mass spectrometry, kidney
INTRODUCTION
The urea channel UT-A1 and the water channel aquaporin-2 (AQP2) mediate vasopressin-regulated transport in the renal inner medullary collecting duct (IMCD). UT-A1, along with another urea channel protein UT-A3, mediates facilitated urea transport across the epithelium of the IMCD, which delivers urea to the inner medullary interstitium (16, 34, 50), resulting in urea accumulation necessary for urinary concentration (2). Both UT-A1 and UT-A3 are derived from the Slc14a2 gene through alternative exon usage (18, 31). UT-A1 has two homologous hydrophobic regions connected by a middle loop region. UT-A3 is a shorter isoform (31) and is identical to UT-A1 throughout most of the first hydrophobic region (17, 31). Because of the use of an alternative exon, UT-A3 has a unique COOH-terminal sequence. Inner medullary collecting ducts (IMCDs) from mice with deletion of both UT-A1 and -A3 exhibited a lack of vasopressin-regulated urea transport (16). Structural studies using X-ray crystallography have demonstrated that UT-A proteins are channel-like in structure (36), which has led us to refer to UT-A proteins in this paper as “urea channel” proteins rather than “urea transporters.” Urea transport is regulated in the IMCD by vasopressin, which increases the urea permeability within minutes of its addition in isolated perfused tubule experiments (50, 62). The regulation is believed to involve phosphorylation (1, 4, 19, 25, 27) as well as membrane trafficking (4, 33). In addition, urea channel proteins undergo other posttranslational modifications including ubiquitylation (8, 52, 55) and glycosylation (5, 7).
The water channel aquaporin-2 (AQP2) mediates water transport across the apical plasma membrane of IMCD cells. Like UT-A, it is regulated by vasopressin (11, 44). Short-term regulation of AQP2 results from regulated membrane trafficking (43) and through modification of AQP2 protein half-life (42, 49). Vasopressin regulates phosphorylation of a cluster of four serines in the carboxyl-terminal tail of AQP2 (21, 22, 24).
Regulation of a given protein by posttranslational modification or membrane trafficking is dependent on selective interactions between the target protein and the relevant regulatory proteins. For example, phosphorylation of a protein must involve the direct physical interaction between the relevant protein kinases and the target protein. Similarly, ubiquitylation, which is involved in protein turnover, results from direct physical interactions between the target protein and the relevant ubiquitin E3 ligase. Following the same logic, we can expect regulation of protein trafficking to involve physical interactions between the regulated protein and small GTP-binding proteins or various cytoskeletal proteins via their molecular motors. Thus, identification of interacting proteins can provide important clues to what proteins mediate regulatory events pertinent to a specific target protein.
Aside from regulatory interactions in the cell, direct protein-protein interactions can occur as a result of housekeeping functions in the cell. We can expect to see interactions of a given protein with various molecular chaperones, with proteins in the endoplasmic reticulum and Golgi apparatus involved in protein maturation, and with mediators of degradation of senescent proteins. Such housekeeping interactions can be expected to involve a common set of proteins for virtually every integral membrane protein targeted to the plasma membrane.
Here, to carry out proteome-wide identification of UT-A1 and AQP2-interacting proteins in the IMCD, we performed chemical cross-linking in native IMCD cells isolated from rat kidneys followed by detergent solubilization, immunoprecipitation of UT-A1 or AQP2, and LC-MS/MS analysis of the immunoprecipitated material. To identify if any of the interactions are dependent on vasopressin, we carried out multiple experiments with and without preincubation of the IMCD cells with the vasopressin V2 receptor analog dDAVP. The derived UT-A1 and AQP2 interactomes provide a basis for modeling vasopressin signaling in the renal collecting duct.
METHODS
IMCD suspensions.
Inner medullary collecting ducts were isolated from male Sprague-Dawley rats weighing 180–250 g (National Heart, Lung, and Blood Institute ACUC animal approval protocol H-0110R3) using the method of Stokes et al. (53) with modifications (48). The suspensions were incubated at 37°C for 15 min with either dDAVP at 1 nM or its vehicle.
In-cell cross-linking.
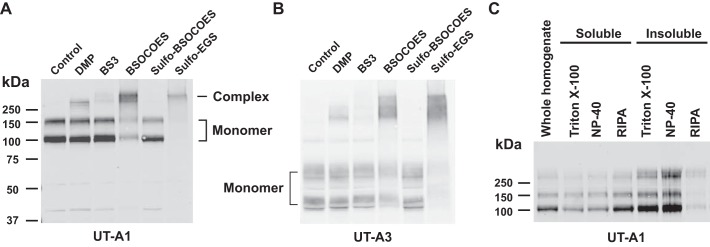
The cross-linking reagent bis[2-(succinimidyloxycarbonyloxy)ethyl]-sulfone (BSOCOES, spacer arm length 13.0 Å, Thermo Scientific, Rockford, IL) was added to the IMCD suspensions for 30 min according to the manufacturer’s instructions. The reaction was quenched by adding 1 M Tris, pH 7.5 to a final concentration of 50 mM for 10 min. IMCDs were harvested by centrifugation (16,000 g, 1 min). The pellet was homogenized (Potter-Elvehjem) in PBS containing 1× RIPA (1% NP-40, 0.1% SDS, 0. 5% sodium deoxycholate) and 1× HALT protease/phosphatase inhibitor cocktail (Thermo Scientific). The lysate was incubated at 4°C for 3 h and spun at 100,000 g for 30 min to remove insoluble components before immunoprecipitation. The experimental basis for the choice of cross-linkers and detergents is given in Fig. 1.
Fig. 1.
Optimization of in-cell cross-linking and protein solubilization. Initial experiments were carried out in rat inner medullary collecting duct (IMCD) suspensions to identify a homobifunctional chemical cross-linker that efficiently cross-links UT-A1 to other proteins forming high-molecular-weight complexes. A: among the five cross-linkers tested, 2 mM each, BSOCOES was the most effective, yielding the greatest amount of UT-A1 immunoreactivity above molecular mass 250 kDa. The two UT-A1 bands labeled “Monomer” are uncross-linked monomers whose mobilities are the result of two different levels of glycosylation (5). B: the same samples were also immunoblotted for UT-A3. In addition to the known monomeric bands of UT-A3 at 44 and 64 kDa (58), a broad band also appeared at 150–250 kDa. C: to identify the interacting proteins via LC-MS/MS, it was necessary to solubilize the cross-linked complexes and immunoprecipitate them with the UT-A1 antibody. We tested nonionic detergents and detergent mixtures. BSOCOES-cross-linked samples were treated with different detergents (1% concentration each for 60 min at 4°C), followed by ultracentrifugation to separate the soluble and insoluble fractions. RIPA, a mixture of Triton X-100, deoxycholate, and SDS, provided the best solubilization and was chosen for subsequent experiments. DMP, dimethyl pimelimidate-2 HCl; BS3, bis[sulfosuccinimidyl] suberate; BSOCOES, bis[2-(succinimidooxycarbonyloxy)ethyl]sulfone; EGS, ethylene glycol bis[succinimidylsuccinate].
Immunoprecipitation.
Direct immunoprecipitation was performed using antibody-laden magnetic beads as previously described (5). Briefly, protein G-linked Dynabeads (Invitrogen Dynal, Oslo, Norway, 9 mg per sample) were incubated with 30 μg of affinity purified UT-A1 antibody L194 (5) or preimmune IgG in wash buffer (PBS-0.02% Tween 20) at 4°C for 2–3 h. The beads were washed with 0.2 M triethanolamine (pH 8.2) and then were incubated with cross-linking reagent dimethyl pimelimidate (DMP, 20 mM) in 0.2 M triethanolamine (pH 8.9) at room temperature for 45 min as described previously (28). The reaction was quenched by 0.2 M triethanolamine (pH 8.2) for 5 min. The beads were subsequently incubated in 1% Triton X-100 in 0.2 M triethanolamine (pH 8.2) for 10 min to remove uncross-linked IgG. After two washes with the bead wash buffer, the beads were incubated with the RIPA-solubilized, cross-linked IMCD proteins (600 μg) prepared as above at 4°C overnight. The total reaction volume was adjusted by addition of PBS to reach a final 0.2× RIPA concentration. After three washes with wash buffer, the immunoprecipitated (IP) products were eluted with 50 μl of 2× Laemmli elution buffer twice at 70°C for 20 min. The samples were pooled and mixed with 25 μl of 1× Laemmli containing 40 mM DTT before storage at −80°C.
Immunoblotting.
Samples were loaded onto a 12.5% polyacrylamide SDS-PAGE gels (Bio-Rad, Hercules, CA), and electrophoresis was performed at 200 V. Proteins were transferred onto a nitrocellulose membrane (0.45 µm pore size) under 80 V for 45 min (Bio-Rad). After incubating in Odyssey Blocking Buffer (LI-COR, Lincoln, NE) for 1 h, primary antibody was added to the membrane and incubated at 4°C overnight. The membrane was washed three times using 1× PBS with 0.1% Tween 20 followed by the application of goat anti-rabbit IRDye 680 secondary antibody (LI-COR) for 1 h. The membrane was washed three times with 1× PBS containing 0.1% Tween 20 followed by a final rinse with 1× PBS. The protein bands on the membrane were detected using the LI-COR Odyssey Scanner and analyzed with Odyssey software (version 2.1).
In-gel digestion.
UT-A1-specific and preimmune IgG IP products were loaded on a 12-well 12.5% polyacrylamide gel for one-dimensional SDS-PAGE. The gel was stained with Imperial Protein Stain (Thermo Scientific) for 15 min followed by incubation in deionized H2O for 30 min. Gel blocks corresponding to >250 kDa region, where most of the cross-linked protein was present, were isolated using a razor blade. In addition, in some experiments, lower-molecular-mass bands at 117 and 97 kDa (UT-A1) and at 44 and 66 kDa (UT-A3) were isolated for ancillary analysis. Each gel piece was further sliced into 1 mm3 blocks and transferred to Eppendorf tubes. The gel pieces were dehydrated by incubating in 25 mM NH4HCO3 in 50% acetonitrile (ACN) for 10 min three times and then dried in a speed vacuum concentrator (SpeedVac, Thermo).
Reduction, alkylation, and trypsinization were performed as previously described (24) with minor modifications. Samples were reduced with 10 mM DTT in 25 mM NH4HCO3 for 1 h at 56°C and alkylated with 55 mM iodoacetamide in 25 mM NH4HCO3 for 45 min in the dark at room temperature. After washing with 25 mM NH4HCO3, the gel pieces were dehydrated in 50% ACN for 10 min twice and dried in a SpeedVac concentrator (Thermo Scientific). Enzyme digestion was carried out by adding 100 μl of 12.5 ng/µl Sequencing Grade Modified Trypsin (porcine, Promega, Madison, WI) in 25 mM NH4HCO3 for 30 min to rehydrate gel pieces. After removal of excess trypsin solution, the gel pieces were covered with 25 mM NH4HCO3 and incubated at 37°C overnight. The digested peptides were extracted from the gel pieces twice with 50% ACN-0.5% formic acid and twice with 50% isopropanol-0.5% formic acid and dried in a SpeedVac. The peptide samples were acidified in 0.1% formic acid and desalted with C-18 spin columns (Thermo Scientific). The dried peptide samples were resuspended in 0.1% formic acid for LC-MS/MS analysis.
LC-MS/MS analysis.
The MS samples were analyzed on an Orbitrap Elite mass spectrometer (Thermo Scientific) interfaced with an Eksigent NanoLC Ultra system (Eksigent Technologies). Fragmentation of peptide ions was achieved via collision-induced dissociation. Samples were loaded onto an Agilent Zorbax 300SB-C18 trap column (0.3 mm i.d. × 5 mm length, 5-μm particle size) at a flow rate of 6 μl/min for 10 min. Reversed-phase C18 chromatographic separation of trapped peptides was carried out on a prepacked BetaBasic C18 PicoFrit column (75 μm i.d. × 25 cm length; New Objective) at 250 nl/min using the following gradient: 2–5% solvent B for 1 min; 5–35% solvent B for 40 min; 35–85% solvent B for 3 min; 85% solvent B for 5 min (solvent A: 0.1% formic acid in water; solvent B: 0.1% formic acid in acetonitrile). Data-dependent mode was employed such that a single survey MS1 scan for precursor ions was followed by six data-dependent MS2 scans. Survey MS scans were acquired in the Orbitrap component with a resolution of 60,000, and MS2 scanning was performed in the linear ion trap.
Data searching and scoring.
Spectra were matched to peptide sequences using SEQUEST (12) and InsPecT (57) to maximize the number of peptide identifications from high-quality spectra. InsPecT searches were carried out by the Biowulf Linux cluster at the National Institutes of Health (https://hpc.nih.gov). The posttranslational modifications added were a fixed carbamidomethyl modification on cysteine and variable deamination modifications on asparagine and glutamine and a variable oxidation modification on methionine. Searches were performed using the latest version of the rat RefSeq database (National Center for Biotechnology Information) with concatenated forward and reversed sequences to allow for target-decoy analysis to control false positive. Spectra were filtered to obtain a nominal false discovery rate of 1%. The target database also contained sequences for common MS contaminants. Raw files, search results, and all spectra have been uploaded to the ProteomeXchange Consortium via the PRIDE partner repository with the data set identifier PXD003496. These data are accessible at https://www.ebi.ac.uk/pride/archive (reviewer password: EM2qF3i8; accession no.: PXD003496). Label-free peptide quantification was performed using National Heart, Lung, and Blood Institute (NHLBI) Proteomic Core’s QUOIL software (63). QUOIL analyzes the peak areas of reconstructed parent ion chromatogram for each peptide in the UT-A1 specific sample and their ratios relative to those in the pre-immune IgG sample, presented as Log2(antibody-specific IP/preimmune IgG-IP). Peptides uniquely matching a single protein were identified using an in-house Java application “ProteinMatcher.” Peptides that matched more than one protein were not used in the analysis. (This conservative approach means that some common proteins like β-actin are eliminated from consideration.)
Gene Ontology and network analyses.
Gene Ontology and Conserved Domain Database analysis were performed using an in-house Java application, Automated Bioinformatics Extractor (ABE, https://hpcwebapps.cit.nih.gov/ESBL/ABE/). Enrichment of individual Gene Ontology (GO) terms from the interactome was assessed using the Database for Annotation, Visualization and Integrated Discovery (DAVID, National Institute of Allergy and Infectious Diseases, version 6.7, https://david.abcc.ncifcrf.gov/). The complete IMCD transcriptome (59) (https://dir.nhlbi.nih.gov/papers/lkem/imcdtr/) was used as the background data set. Functional clustering was performed in DAVID using the following databases: Gene-Ontology, GO FAT; Pathways: KEGG pathway and Panther pathway; Protein Domain: InterPro, Panther family, Panther subfamily, PFAM, PIR-Superfamily, Prosite, and SMART; Functional Categories: COG-Ontology, Swiss-Prot/Protein Information Resource Keywords, and UniProt Sequence Features. The level of enrichment was assessed by a modified Fisher’s exact test in which enriched Biological Process, Molecular Function, Cellular Component terms, and Protein Domains terms with a corrected P value < 0.01 were reported. Comparisons of enrichments between different lists of protein were made by Metascape (http://metascape.org/). STRING Functional Association Networks (version 10.0) (https://string-db.org/) was used to display protein interaction networks. Settings of STRING analysis were: active interaction sources, all; minimum required interaction score, high confidence (0.700). Both the node coordinates and interaction edges of the protein interaction networks were then exported and illustrated in Cytoscape.
Gel-free fractionation.
The Protein Discovery GelFree 8100 fractionation system (Protein Discovery, Knoxville, TN) was used to fractionate cross-linked, solubilized IMCD samples based on molecular weight. Solubilized IMCD (500 μg) was loaded on a 5% Tris-acetate cartridge (optimal MW range: 75–500 kDa) for fractionation. Fractions were collected for standard immunoblotting analysis.
In vitro phosphorylation.
Synthetic peptides corresponding to the previously identified phosphorylation sites in UT-A, Ser84-UT-A1/3 (Biotin-LC-PNERSKRRESELPRR), Ser486-UT-A1 (Biotin-LC-ETVFPRRKSVFHIEWSSIR), and Ser499-UT-A1 (Biotin-LC-FHIEWSSIRRRSKVFGKSEH) were used (Anaspec, Fremont, CA). Synthetic peptides, 2 nmol each, were incubated with ATP and reaction buffer in the presence or absence of 0.5 μM of active recombinant kinases for 1 h (or up to 24 h in time course study) at 30°C. Active, recombinant protein kinase A catalytic subunit (gene symbol: Prkaca) was purchased from New England Biolabs (Ipswich, MA). Active kinases Cdc42bpb (MRCKβ), Phkg2 (gamma catalytic subunit of Phkb), Camk2d were purchased from SignalChem (Richmond, BC, Canada). Active Mtor/Raptor/MLST8 was purchased from Sigma-Aldrich (St. Louis, MO). For reactions using Camk2d, calcium/calmodulin was also added to the reaction buffer following the manufacturer’s protocol. Reactions were stopped by adding 5× Laemmli or 8 M urea. Phosphorylation on Ser84 and Ser486 was analyzed both by immunoblotting using previously characterized phospho-specific antibodies (27) and by mass spectrometric analysis of phosphopeptide using QUOIL software. Phosphorylation on Ser499 was measured by mass spectrometry only.
RESULTS
UT-A1 immunoprecipitation.
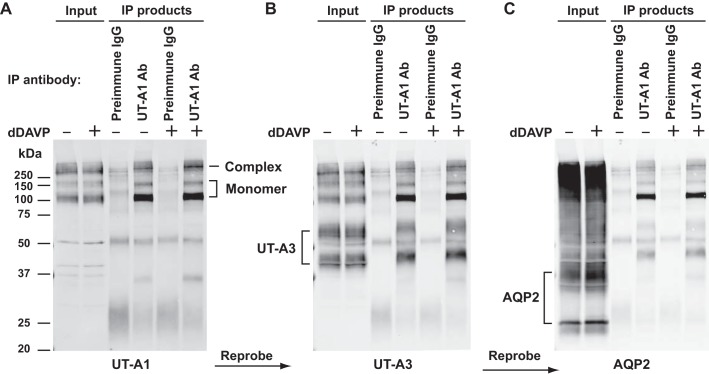
Figure 2 shows a representative immunoblot from immunoprecipitation experiments using BSOCOES-cross-linked, RIPA-solubilized IMCD samples. UT-A1 antibody-laden beads, but not preimmune IgG beads, successfully pulled down both the UT-A1 monomer and the presumed high-molecular-mass complexes (>250 kDa) (Fig. 2A). No obvious difference can be seen between samples treated with dDAVP or its vehicle. Figure 2, B and C, shows the results of reprobing the same blot sequentially with UT-A3 antibody and AQP2 antibody, suggesting that UT-A3, but not AQP2, was bound to the immunoprecipitated UT-A1. This possibility is further addressed below using quantitative mass spectrometry.
Fig. 2.
UT-A1 immunoprecipitation. A: a representative UT-A1 immunoblot of immunoprecipitation (IP) experiment. IMCD suspensions were incubated with vehicle or dDAVP (1 nM for 15 min), followed by in-cell cross-linking using BSOCOES, RIPA-solubilization, and immunoprecipitation using UT-A1 antibody or preimmune IgG-laden Dynabeads as control. The IP input was the RIPA-solubilized fraction. Equal volumes of IP products were loaded for immunoblotting using the UT-A1 antibody. The same membrane was reprobed, without stripping, with the UT-A3 antibody (B), and then with the aquaporin 2 (AQP2) antibody (C).
UT-A1 interactome identification by mass spectrometry.
To identify UT-A1-interacting proteins and to obtain information about how vasopressin can regulate UT-A1 in IMCD cells, tryptic peptides extracted from gel pieces corresponding to >250 kDa UT-A1 complex band of all immunoprecipitated products were analyzed by LC-MS/MS as described in methods. Proteins that were present in all three biological replicates (either vehicle- or dDAVP-treated group) and with averaged peptide intensity of log2(antibody specific-IP/preimmune IgG-IP) greater than 2 (a fourfold increase in antibody-specific IP) were selected into the interactome list. A total of 133 UT-A1-interacting proteins were identified. A complete list of these interacting proteins is available on a publicly accessible webpage (URL: https://hpcwebapps.cit.nih.gov/ESBL/Database/UTA1-interactome. Temporary login: clp; password: Esbl!@#$). The proteins bound to UT-A1 in both vehicle and dDAVP-treated samples included four protein kinases (Camk2d, Mtor, Cdc42bpb, Phkb) whose possible role in UT-A1 phosphorylation is investigated below.
Peptides that map selectively to UT-A isoforms.
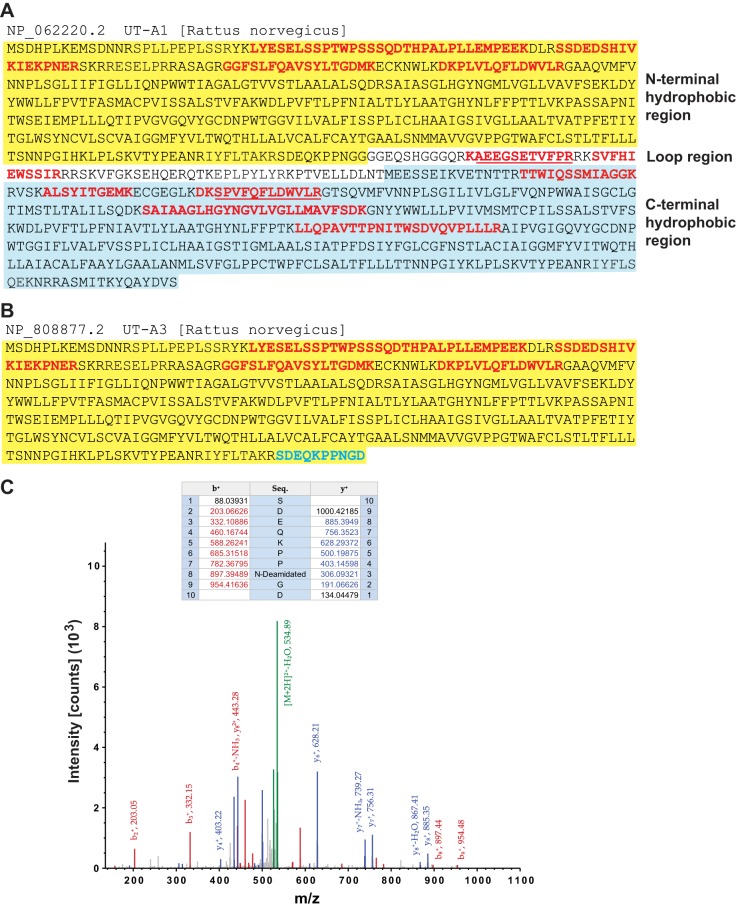
Figure 3A shows the peptides identified for UT-A1 (red) mapped to the full UT-A1 sequence. Figure 3B shows peptides that mapped to UT-A3 including a UT-A3 specific COOH-terminal peptide (cyan). The MS2 spectrum for this peptide is shown in Fig. 3C. Mapping the spectra to the original gel slices shows that this UT-A3 unique peptide was identified with high confidence in UT-A3 monomer bands only and was not detectable in the high-molecular-weight complex. Thus, the mass spectrometry confirms the finding from immunoblotting that immunoprecipitation of UT-A1 with a COOH-terminal-directed UT-A1 antibody that is targeted to a region of UT-A1 not shared by UT-A3 (5), nevertheless, brings down UT-A3, suggestive of a direct interaction between UT-A1 and UT-A3.
Fig. 3.
Peptides that map selectively to UT-A isoforms. A and B: amino acid sequence of UT-A1 protein (A) and UT-A3 protein (B). UT-A1 contains three regions: an NH2-terminal hydrophobic region (yellow background), a COOH-terminal hydrophobic region (blue background), and a middle loop region connecting the two hydrophobic regions. UT-A3 is identical to the NH2-terminal part of UT-A1 except for the last amino acid with aspartic acid (D) in position 260 in UT-A3 and glycine (G) in position 260 in UT-A1. The middle loop and COOH-terminal part of UT-A1 are unique to UT-A1. Trypsin-digested peptides are marked with red fonts. Red underlined indicates the alternative peptide found. Cyan sequence (SDEQKPPNGD) depicts the only UT-A3-unique peptide. C: MS2 fragment spectrum of peptide SDEQKPPnGD (n, deamidated N) identified from gel band corresponding to the UT-A3 protein.
It has been proposed that urea transport may be mediated by a channel complex that combines UT-A1 and UT-A3 (36). If so, the molar abundances of these two proteins in the immunoprecipitated material should be similar, or at least their amounts should be of the same order of magnitude. Additional mass spectrometry experiments were done using both label-free quantification and absolute quantification to quantify the relative amounts of the two isoforms immunoprecipitated by the UT-A1 antibody after cross-linking. Both quantification methods showed, however, that the amount of immunoprecipitated UT-A1 far outstrips the amount of UT-A3 (see appendix). Thus, complexes that contain both UT-A1 and UT-A3 are far less abundant than complexes containing only the former.
Subcellular distribution of UT-A1 interacting proteins.
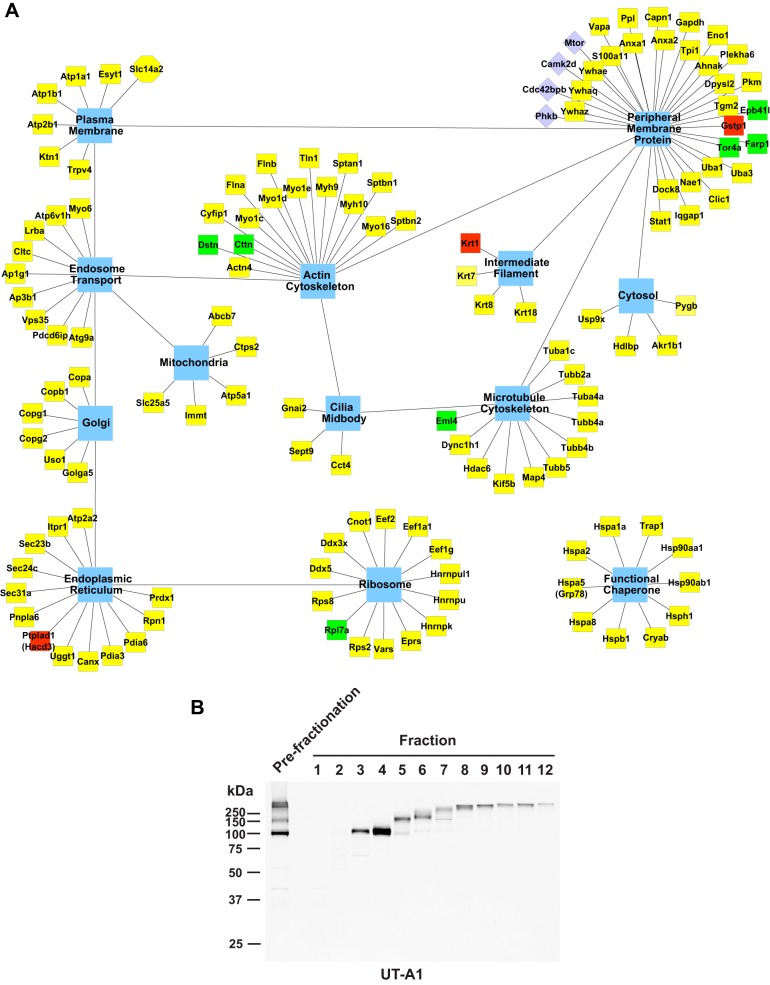
Figure 4A maps all identified UT-A1-interacting proteins to the subcellular compartments with which they are associated (based on Gene Ontology Cellular Component terms and UniProt annotations). Among the proteins that we found associated with UT-A1 were resident proteins of various subcellular compartments, such as the endoplasmic reticulum and Golgi apparatus, as well as various cytoskeletal components and chaperone proteins. Thus, UT-A1 seemingly does not form a single complex, but is involved in multiple protein complexes in different subcellular compartments throughout the cell. In agreement with this view, immunoblotting using molecular weight-fractionated samples (Gelfree fractionation system) showed that the UT-A1 high-molecular-weight complex in prefractionation sample consists of a series of UT-A1 protein bands with variable molecular weight (Fig. 4B fractions 6–12).
Fig. 4.
A: intracellular distribution of UT-A1-interacting proteins. All identified UT-A1 interacting proteins with official gene symbols (yellow box) were mapped to their principal subcellular compartments (blue hub). Proteins with green blocks (Eml4, Cttn, Tor4a, Rpl7a, Dstn, Farp1, Epb41l1) were present only in dDAVP-treated samples. Proteins with red blocks (Ptplad1, Krt1, Gstp1) were present only in vehicle-treated samples. B: gel-free fractionation of UT-A1 protein complexes. Molecular weight-fractionated IMCD samples (1–12) were collected for immunoblotting using UT-A1 antibody. The left-hand lane was loaded with the prefractionation sample.
Functional classification of UT-A1 interactome: GO term enrichment.
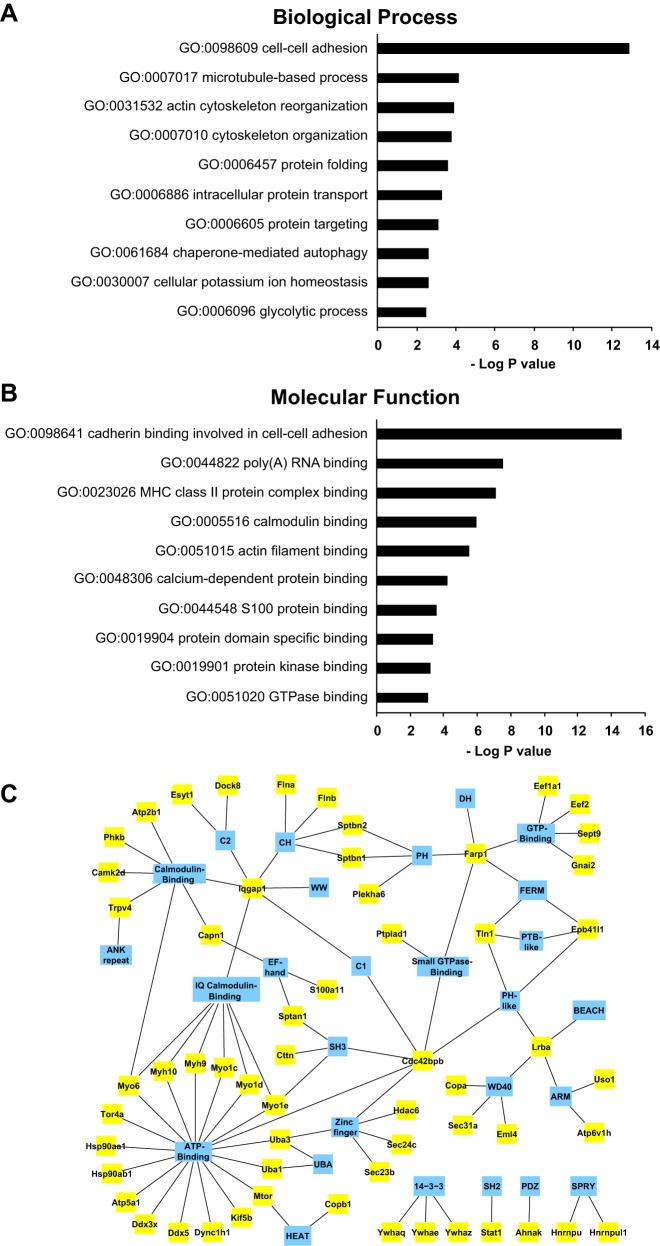
Figure 5 shows statistical analysis of Gene Ontology Terms of Biological Process (Fig. 5A) and Molecular Function (Fig. 5B) among the UT-A1-interacting proteins. Proteins that stand out are those with GO terms related to “intracellular protein transport,” “cell-cell adhesion,” “microtubule-based process,” and “cytoskeletal organization.” Figure 5C maps the UT-A1 interacting proteins to their protein domains. Among UT-A1 interactome, Farp1, Cdc42bpb (also known as MRCKβ) and Iqgap1 have multiple binding domains, and thus are of special interest because of their potential role as scaffold proteins in forming UT-A1 complexes.
Fig. 5.
Bioinformatics analysis of UT-A1 interactome. A and B: depicted are the enriched Gene Ontology (GO) terms Biological Process (A) and Molecular Function (B) in UT-A1 interactome relative to rat IMCD transcriptome as determined by DAVID analysis. C: interacting protein domain analysis. Interacting proteins (yellow boxes) are linked to their interacting or structural domains (blue hubs). Protein domains were extracted using ABE and AbDesigner (see methods). Protein domains: 14-3-3, 14-3-3 homologous, ANK, ankyrin; ARM, armadillo/β-catenin-like repeat; BEACH, beige/BEACH; C1 (protein kinase C conserved region 1); C2 (protein kinase C conserved region 2); CH, calponin homology; DH, Dbl-homologous, RhoGEF; EF-hand, EF-hand calcium binding motif; FERM, 4.1 protein/ezrin/radixin/moesin; HEAT, Huntingtin, elongation factor 3, protein phosphatase 2A, and kinase TOR1 repeat; IQ, calmodulin-binding motif containing conserved Ile and Gln residues; PDZ, domain present in PSD-95, Dlg, and ZO-1/2; PH, pleckstrin homology; PTB, phosphotyrosine-binding-like; SH2, Src homology 2; SH3, Src homology 3; SPRY, domain in Spla and the ryanodine receptor; UBA, ubiquitin-associated; zinc-finger, ZnF_C2H2 zinc-finger.
AQP2 interactome.
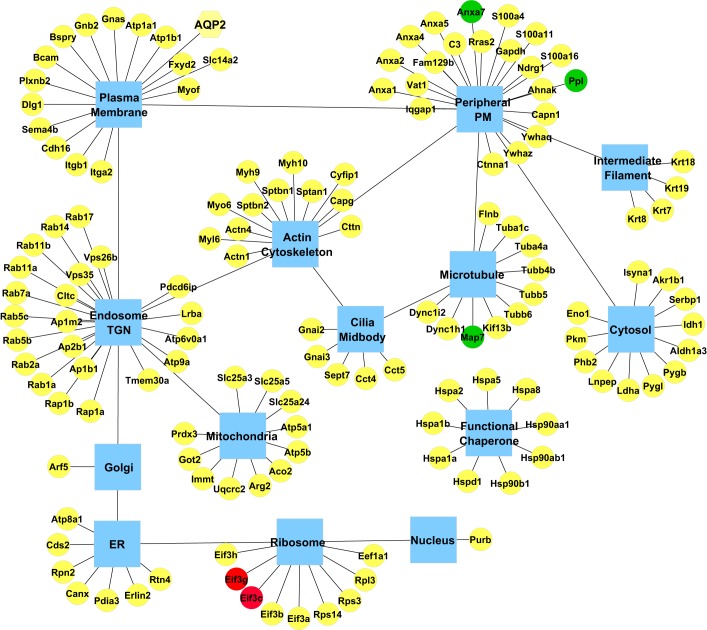
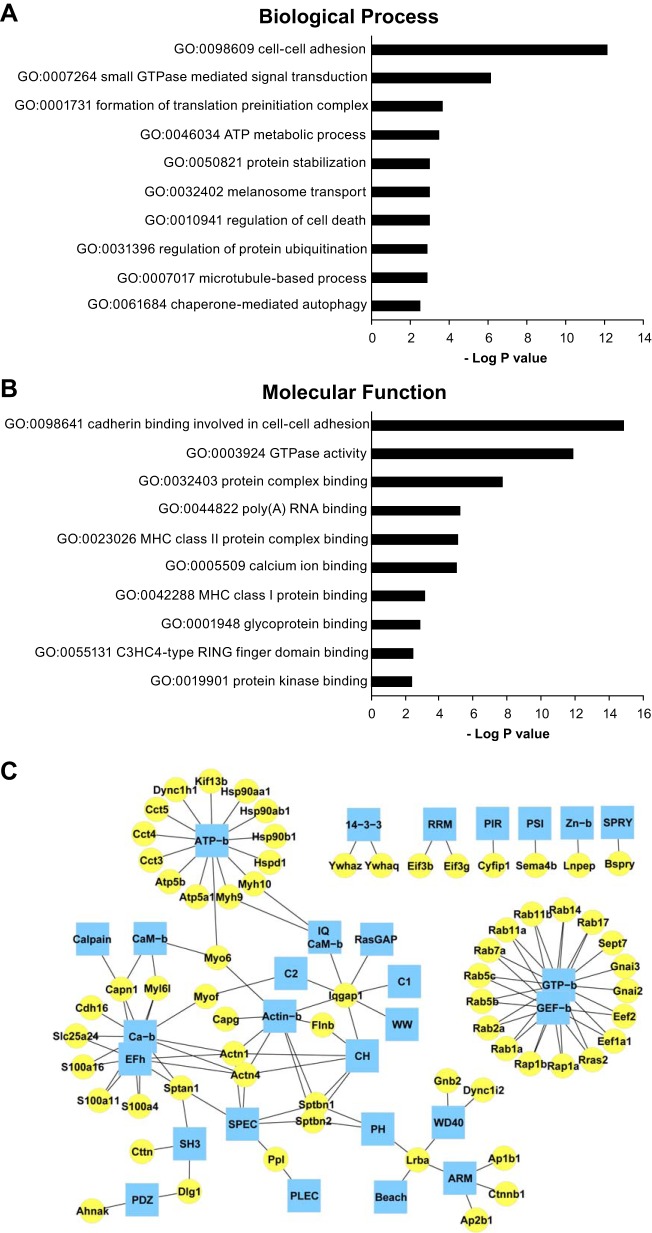
The presence of many proteins associated with endoplasmic reticulum, Golgi, trans-Golgi network and endosomes in the UT-A1-immunoprecipitated material (Fig. 4) suggests that our experimental approach identifies many “housekeeping” interactions in addition to target-specific interactions. Such housekeeping interactions should be seen for any integral membrane protein in the plasma membrane. To test this, we have repeated the same cross-linking/immunoprecipitation protocol with an antibody to another abundant integral membrane protein, viz. the aquaporin-2 (AQP2) water channel, which is also regulated by the vasopressin V2 receptor signaling pathway (50, 51, 62). Figure 6 shows a representative immunoblot from immunoprecipitation experiments using BSOCOES-cross-linked, RIPA-solubilized IMCD samples. To identify AQP2-interacting proteins, gel bands above the glycosylated band of AQP2 (>37 kDa) were excised and subjected to in-gel trypsinization. The extracted peptides were analyzed by LC-MS/MS as described. We detected 139 proteins in native rat IMCD (n = 4) that appear to interact with AQP2 in various subcellular compartments (Fig. 7). The full list of these proteins is available on a publicly accessible webpage (https://hpcwebapps.cit.nih.gov/ESBL/Database/AQP2-interactome. Temporary login: clp; password: Esbl!@#$). Statistical analysis of Gene Ontology Terms and protein domain analysis among these proteins are given in Fig. 8.
Fig. 6.
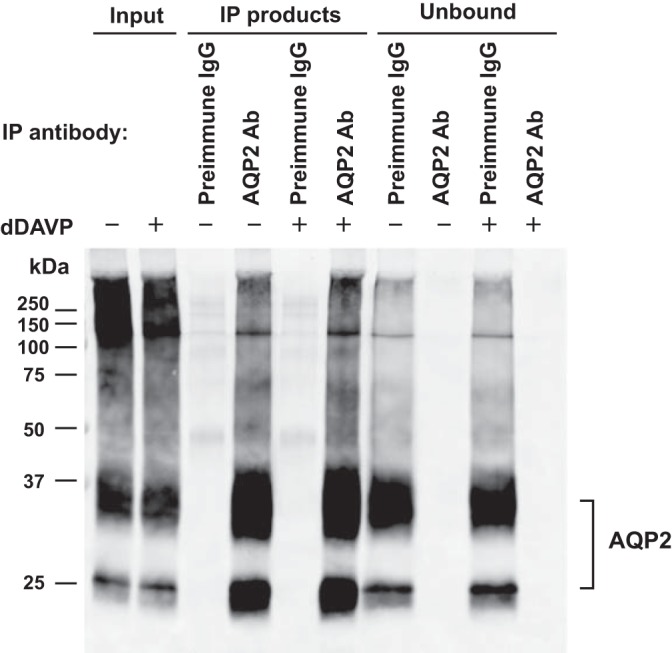
AQP2 immunoprecipitation. A representative AQP2 immunoblot of immunoprecipitation experiment is shown. IMCD suspensions were incubated with vehicle or dDAVP (1 nM for 15 min), followed by in-cell cross-linking using BSOCOES, RIPA solubilization, and immunoprecipitation using AQP2 antibody or preimmune IgG-laden Dynabeads as control. The IP input was the RIPA-solubilized fraction. Equal volumes of IP products were loaded for immunoblotting using the AQP2 antibody (lanes 3–6). Unbound, the supernatant collected after overnight incubation of IP input with AQP2 antibody-laden Dynabeads.
Fig. 7.
Intracellular distribution of AQP2-interacting proteins. All identified AQP2-interacting proteins with official gene symbols (yellow circle) were mapped to their principal subcellular compartments (blue hub). Proteins with green circles (Anxa7, Ppl, Map7) were present only in dDAVP-treated samples. Proteins with red circles (Eif3c, Eif3g) were present only in vehicle-treated samples.
Fig. 8.
Bioinformatics analysis of AQP2 interactome. A and B: depicted are the enriched Gene Ontology (GO) terms Biological Process (A) and Molecular Function (B) in AQP2 interactome relative to rat IMCD transcriptome as determined by DAVID analysis. C: AQP2-interacting protein domain analysis. Interacting proteins (yellow circle) are linked to their interacting or structural domains (blue hub). Protein domains were extracted using ABE and AbDesigner (see methods). Domain names: CaM, calmodulin; EF-h, EF-hand; PIR, protein PIR; PLEC, plectin repeat; PSI, plexin repeat; RRM, RNA recognition motif; SPEC, spectrin repeats; b, binding.
Comparisons of the two interactomes.
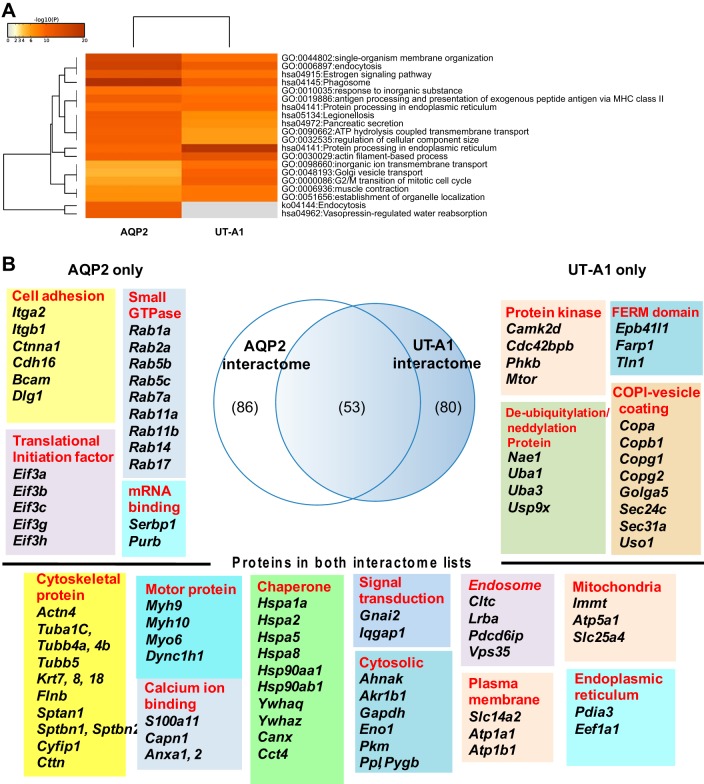
To compare the AQP2 and UT-A1 interactomes, both protein lists were uploaded to Metascape for “Pathway and Process” enrichment analysis. Figure 9A shows that the clusters of pathways with terms “Vasopressin-regulated water reabsorption” and “Endocytosis” are enriched only in the AQP2 interactome list, thus validating the methodology used in the present study.
Fig. 9.
Comparisons between UT-A1 and AQP2 interactomes. A: pathway and process enrichment analysis was done in Metascape using “GO Biological Processes” and “KEGG Pathway” annotation terms with P value cutoff at 0.01. B: a Venn diagram depicts numbers of interacting proteins that selectively interact with AQP2 only, or UT-A1 only, or both. All 53 proteins that were found in both interactome lists and serve as housekeeping interactions are listed (bottom). Top left: representative groups of proteins selectively interacted with AQP2. Top right: representative groups of proteins selectively interacted with UT-A1. A complete list of these proteins is given in Table 1.
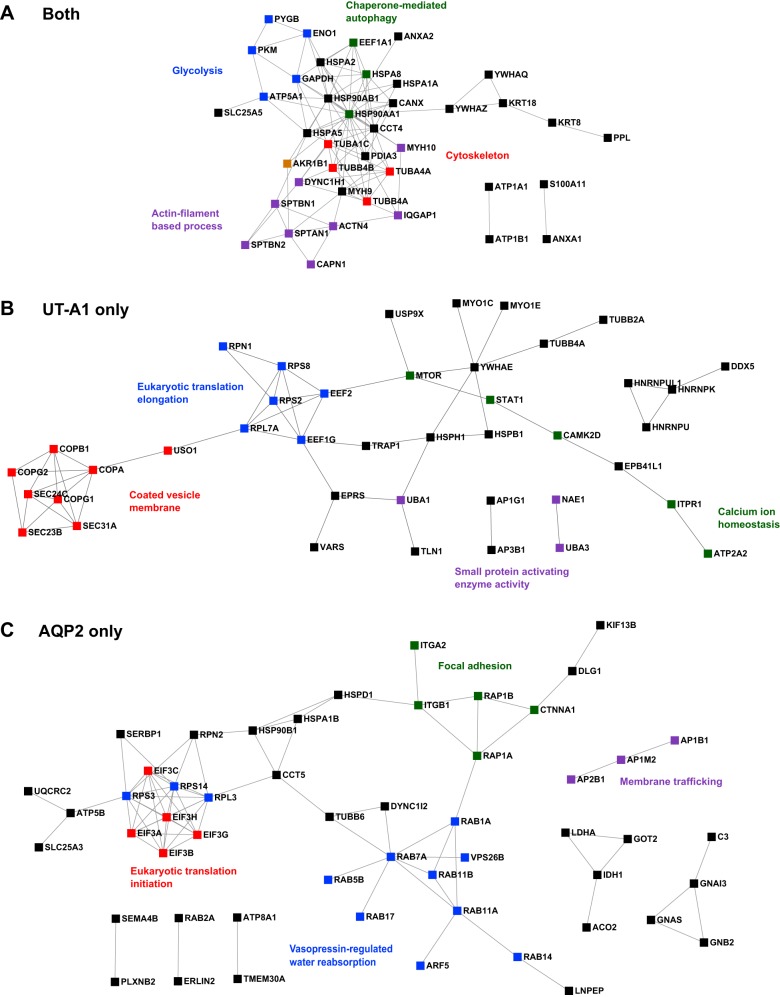
When the two interactomes were compared in a Venn diagram, there were 53 interacting proteins present in both lists (Fig. 9B, bottom) which may be considered as putative “housekeeping interactions” that would likely be found for any plasma membrane protein. There were 86 proteins that selectively interact with AQP2 and 80 proteins that selectively interact with UT-A1. A complete list of all three groups of proteins is given in Table 1. Figure 10 shows the predicted protein-protein interaction networks.
Table 1.
Proteins that selectively interact with UT-A1, or AQP2, or both
| Group | Gene Symbol |
|---|---|
| Both | Actn4, Ahnak, Akr1b1, Anxa1, Anxa2, Atp1a1, Atp1b1, Atp5a1, Canx, Capn1, Cct4, Cltc, Cttn, Cyfip1, Dync1h1, Eef1a1, Eno1, Flnb, Gapdh, Gnai2, Hsp90aa1, Hsp90ab1, Hspa1a, Hspa2, Hspa5, Hspa8, Immt, Iqgap1, Krt18, Krt7, Krt8, Lrba, Myh10, Myh9, Myo6, Pdcd6ip, Pdia3, Pkm, Ppl, Pygb, S100a11, Slc14a2, Slc25a5, Sptan1, Sptbn1, Sptbn2, Tuba1c, Tuba4a, Tubb4b, Tubb5, Vps35, Ywhaq, Ywhaz |
| UT-A1 only | Abcb7, Ap1g1, Ap3b1, Atg9a, Atp2a2, Atp2b1, Atp6v1h, Camk2d, Cdc42bpb, Clic1, Cnot1, Copa, Copb1, Copg1, Copg2, Cryab, Ctps2, Ddx3x, Ddx5, Dock8, Dpysl2, Dstn, Eef1g, Eef2, Eml4, Epb41l1, Eprs, Esyt1, Farp1, Flna, Golga5, Gstp1, Hdac6, Hdlbp, Hnrnpk, Hnrnpu, Hnrnpul1, Hspb1, Hsph1, Itpr1, Kif5b, Krt1, Ktn1, Map4, Mtor, Myo1c, Myo1d, Myo1e, Nae1, Pdia6, Phkb, Plekha6, Pnpla6, Prdx1, Ptplad1, Rpl7a, Rpn1, Rps2, Rps8, Sec23b, Sec24c, Sec31a, Sept9, Stat1, Tgm2, Tln1, Tor4a, Tpi1, Trap1, Trpv4, Tubb2a, Tubb4a, Uba1, Uba3, Uggt1, Uso1, Usp9x, Vapa, Vars, Ywhae |
| AQP2 only | Aco2, Aldh1a3, Anxa4, Anxa5, Anxa7, Ap1b1, Ap1m2, Ap2b1, Aqp2, Arf5, Arg2, Atp5b, Atp6v0a1, Atp8a1, Atp9a, Bcam, Bspry, C3, Capg, Cct5, Cdh16, Cds2, Ctnna1, Dlg1, Dync1i2, Eif3a, Eif3b, Eif3c, Eif3g, Eif3h, Erlin2, Fam129b, Fxyd2, Gnai3, Gnas, Gnb2, Got2, Hsp90b1, Hspa1b, Hspd1, Idh1, Isyna1, Itga2, Itgb1, Kif13b, Krt19, Ldha, Lnpep, Map7, Myl6, Myof, Ndrg1, Phb2, Plxnb2, Prdx3, Purb, Pygl, Rab11a, Rab11b, Rab14, Rab17, Rab1a, Rab2a, Rab5b, Rab5c, Rab7a, Rap1a, Rap1b, Rpl3, Rpn2, Rps14, Rps3, Rras2, Rtn4, S100a16, S100a4, Sema4b, Sept7, Serbp1, Slc25a24, Slc25a3, Tmem30a, Tubb6, Uqcrc2, Vat1, Vps26b |
Proteins that identified from the list of UT-A1 and aquaporin 2 (AQP2) interactome were divided into three groups: proteins selectively interact with UT-A1 (“UT-A1 only”), or proteins selectively interact with AQP2 (“AQP2 only”), or proteins interact with both UT-1 and AQP2 (both).
Fig. 10.
Protein-protein interaction networks. Displays are protein-protein interactions predicted by STRING analysis set at high confidence level (0.700). A: proteins present in both UT-A1 and AQP2 interactomes form a single tight protein interaction network. In contrast, UT-A1-selective interacting proteins (B) or AQP2-selective interacting proteins (C) each forms a relatively diffuse network.
Effects of vasopressin on the UT-A1 interactome.
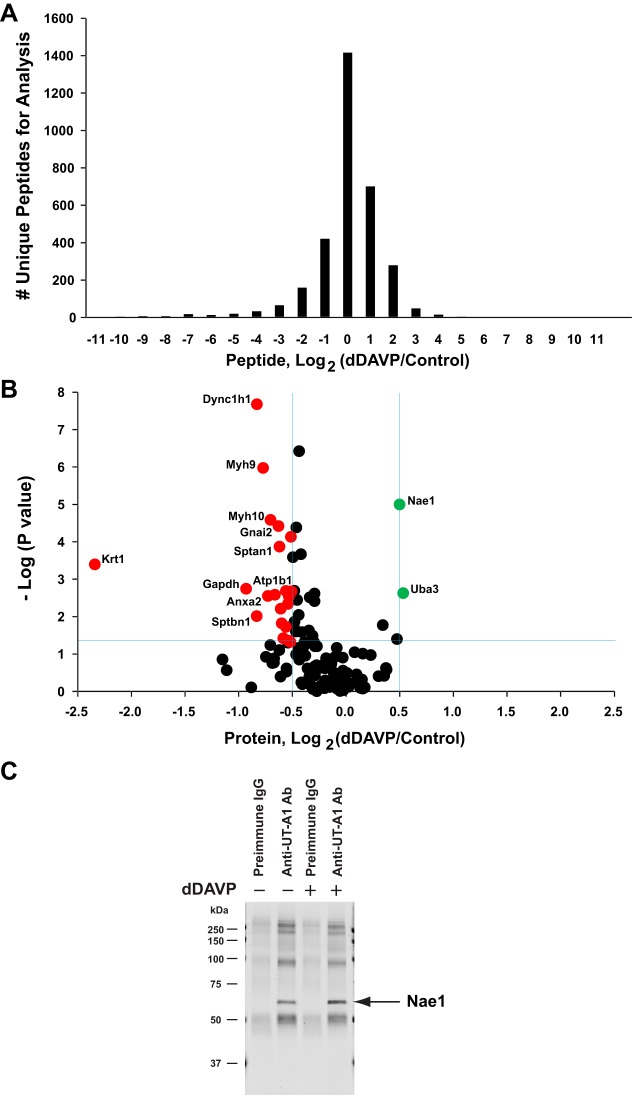
Focusing again on the UT-A1 interactome, some proteins appeared to bind only in the presence or absence of dDAVP (Fig. 4). Label-free quantification can also be used to compare relative amounts of individual proteins in the dDAVP- and vehicle-treated samples (Fig. 11). In this analysis, all identified peptides were compared using QUOIL software and the intensity ratio was expressed as the base 2 logarithm of the ratio of the value with dDAVP to the value with vehicle. Figure 11A is a histogram showing the distribution of all dDAVP:vehicle peptide ratios. Most peptides showed little or no change in abundance with dDAVP. However, there are 25 proteins that showed significant changes in binding with UT-A1 in response to dDAVP (Fig. 11B). Table 2 shows a complete list of these proteins. The two interacting proteins with increased binding to UT-A1 with dDAVP were Nae1 and Uba3. These two proteins are the regulatory and catalytic subunits, respectively, of the NEDD8-activating enzyme E1, a neddylation enzyme that binds and activates Nedd8, a ubiquitin-like protein (47). Among the 23 interacting proteins that decreased in binding to UT-A1 in response to dDAVP were several actin cytoskeleton-related proteins: spectrin α and β chains (Sptan1, Sptbn1, and Sptbn2), conventional myosins (Myh9 and Myh10), the keratin intermediate filament protein Krt1, and dynein (Dnc1h1). Interestingly, both major subunits of the kidney isoform of the Na-K-ATPase (Atp1a1 and Atp1b1), which reside chiefly in the basolateral plasma membrane, showed decreased interaction with UT-A1 in the presence of dDAVP. In addition, phosphorylase b kinase regulatory subunit-β (Phkb) showed a decrease in binding in response to dDAVP. Figure 11C shows immunoblotting results of coimmunoprecipitation experiments confirming the interaction of Nae1 with UT-A1 (n = 2).
Fig. 11.
Proteins with significant changes in binding to UT-A1 following dDAVP treatment. A: a histogram of the distribution of all peptide ratios, log2(dDAVP/control), for protein analysis. B: a volcano plot analysis for detecting significantly changed proteins. The horizontal blue line demarcates points with P < 0.05. The vertical blue lines indicate values for which the absolute median value of log2(dDAVP/control) was >0.49, determined as 2 times of standard error of log2(control/control). The points that meet both criteria are indicated in green (increased binding) or red (decreased binding). A complete list of these proteins is given in Table 2. C: a representative Nae1 immunoblot from co-IP experiments demonstrates protein-protein interaction between Nae1 and UT-A1. IMCD suspensions treated with dDAVP or vehicle were in situ cross-linked with BSOCOES, solubilized by RIPA, and immunoprecipitated with UT-A1 antibody or preimmune IgG. Nae1 antibody (no. 14321, Cell Signaling) was used at 1:500 dilution. Nae1 at expected molecular mass of 60 kDa was seen in UT-A1 IP samples only (both control and dDAVP-treated) (n = 2). The remaining bands are due to residual IgG.
Table 2.
Proteins with increased or decreased binding to UT-A1 following dDAVP treatment
| RefSeq no. | Gene Symbol | Protein Name | dDAVP/Control (Log2R) | P Value (−LogP) |
|---|---|---|---|---|
| Significantly increased binding | ||||
| NP_476553 | Uba3 | NEDD8-activating enzyme E1 catalytic subunit | 0.53 | 2.62 |
| NP_114461 | Nae1 | NEDD8-activating enzyme E1 regulatory subunit | 0.50 | 4.99 |
| Significantly decreased binding | ||||
| NP_899162 | Krt5 | Keratin, type II cytoskeletal 5 | −2.46 | 4.16 |
| NP_001008802 | Krt1 | Keratin, type II cytoskeletal 1 | −2.34 | 3.39 |
| NP_058704 | Gapdh | Glyceraldehyde-3-phosphate dehydrogenase | −0.93 | 2.74 |
| NP_001013148 | Sptbn1 | Spectrin β chain, brain 1 | −0.83 | 2.01 |
| NP_062099 | Dync1h1 | Cytoplasmic dynein 1 heavy chain 1 | −0.83 | 7.67 |
| NP_037326 | Myh9 | Myosin-9 | −0.77 | 5.97 |
| NP_063970 | Anxa2 | Annexin A2 | −0.73 | 2.55 |
| NP_113708 | Myh10 | Myosin-10 | −0.70 | 4.58 |
| NP_037245 | Atp1b1 | Sodium/potassium-transporting ATPase subunit-β-1 | −0.66 | 2.58 |
| NP_112297 | Gnai2 | Guanine nucleotide-binding protein Gi subunit α-2 | −0.63 | 4.42 |
| NP_741984 | Sptan1 | Spectrin α chain, nonerythrocytic 1 | −0.62 | 3.87 |
| NP_001011995 | Tuba1c | Tubulin α-1C chain | −0.61 | 2.21 |
| NP_001014174 | Phkb | Phosphorylase b kinase regulatory subunit β | −0.60 | 1.82 |
| NP_542959 | Copb1 | Coatomer subunit β | −0.58 | 1.42 |
| NP_036636 | Atp1a1 | Sodium/potassium-transporting ATPase subunit α-1 precursor | −0.56 | 2.68 |
| NP_037067 | Cryab | α-Crystallin B chain | −0.56 | 1.72 |
| NP_062252 | Uso1 | General vesicular transport factor p115 | −0.55 | 2.67 |
| NP_001178880 | Ahnak | Neuroblast differentiation-associated protein AHNAK | −0.54 | 2.34 |
| NP_077327 | Hspa8 | Heat shock cognate 71-kDa protein | −0.54 | 1.35 |
| NP_062259 | Tgm2 | Protein-glutamine γ-glutamyltransferase 2 | −0.53 | 2.53 |
| NP_058945 | Esyt1 | Extended synaptotagmin-1 | −0.52 | 1.32 |
| NP_742005 | Canx | Calnexin precursor | −0.51 | 4.13 |
| NP_062040 | Sptbn2 | Spectrin β chain, nonerythrocytic 2 | −0.51 | 2.67 |
Label-free quantification was used to compare relative amounts of individual proteins in the dDAVP- and vehicle-treated samples. Log2R, averaged log2 value of peptide intensity ratio (dDAVP/vehicle); (−LogP), minus log10 of P value.
In vitro phosphorylation experiments testing possible roles of protein kinases in UT-A1 interactome.
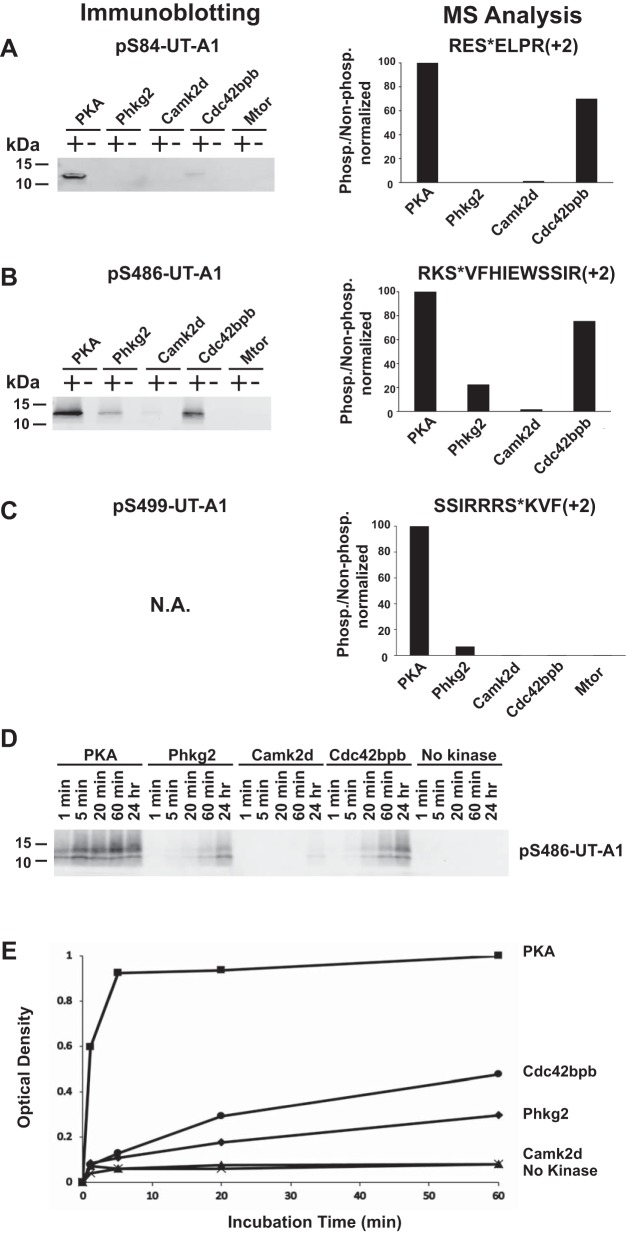
The identified UT-A1 interactome includes four protein kinases: Phkb (phosphorylase b kinase regulatory subunit-β), Camk2d (calcium/calmodulin-dependent protein kinase type II subunit-δ), Mtor (serine/threonine-protein kinase mTOR), Cdc42bpb (serine/threonine-protein kinase MRCKβ). To test the possibility that these kinases are capable of phosphorylating UT-A1, we carried out in vitro phosphorylation experiments by incubating recombinant versions of these enzymes or protein kinase A (PKA) with synthetic peptides encompassing three known phosphorylation sites, Ser84, Ser486, and Ser499 (1, 4, 25, 27). For Phkb, the catalytic subunit Phkg2 was used. As shown in Fig. 12, phosphorylation of Ser84 occurred in response to PKA > Cdc42bpb, but not by Phkg2, Camk2d, or Mtor (Fig. 12A). Phosphorylation of Ser486 occurred in response to PKA > Cdc42bpb > Phkg2 > Camk2d but not Mtor (Fig. 12B). Phosphorylation of Ser499 occurred in response to PKA > Phkg2, but not to Camk2d, Cdc42bpb, or Mtor (n = 2) (Fig. 12C). Figure 12, D and E, shows the time courses of phosphorylation of Ser486 by four kinases. Phosphorylation by PKA was very rapid, reaching 60% of the maximum at 1 min. These experiments confirmed that three kinases (Phkg2, Camk2d, Cdc42bpb) can phosphorylate Ser486 of UT-A1, albeit at a lower rate than PKA.
Fig. 12.
In vitro phosphorylation of UT-A1 peptides. UT-A1-interacting protein kinases Phkb (catalytic subunit Phkg2), Camk2d, cdc42bpb, and Mtor were tested for their abilities to phosphorylate UT-A1 peptides encompassing three known phosphorylation sites (Ser84, Ser486, Ser499) in comparison to PKA. Data are from 1 h incubation of recombinant active kinase and peptide substrate. A–C, left, phosphorylation of Ser84 and Ser486 was tested by immunoblotting using phospho-specific antibody. N.A., antibody specific to pS499-UT-A1 was not available. A–C, right, phosphorylation of Ser84, Ser486, and Ser499-UT-A1 peptides was tested by mass spectrometry. Bar graphs show label-free mass spectrometry quantification normalized to PKA. Asterisk denotes phosphorylated serine residue. D: time courses of phosphorylation of Ser486 by different kinases as tested by immunoblotting. Kinases and peptide substrates were incubated at 30°C for various time periods (1 min, 5 min, 20 min, 60 min, 24 h). E: a line graph summarizes changes in band densities for phospho-Ser486 over time by different kinases.
DISCUSSION
The goal of the present study was to use chemical cross-linking followed by immunoprecipitation and quantitative LC-MS/MS analysis for large-scale identification of UT-A1-interacting proteins in native renal inner medullary collecting duct cells. For comparison, we also carried out analogous studies of another vasopressin-regulated channel in these cells, viz. the aquaporin-2 water channel.
We identified a total of 133 interacting proteins bound to UT-A1 in native rat IMCD cells. These proteins were identified in all three experiments, indicating a high degree of reproducibility and with high signal-to-noise ratio based on comparison to proteins identified when pre-immune IgG was substituted for the UT-A1-specific antibody. Because a single protein could be cross-linked to two or more additional proteins, it is possible that some of the interactions found in this study could be indirect. In comparison to the ~8,000 proteins expressed in IMCD cells (48), the present study identified a relatively small number of proteins bound to UT-A1. This adds to the existing list of proteins identified as UT-A1-interacting proteins in previous studies using GST-pull downs and/or coimmunoprecipitation. Specifically, these are actin (66), caveolin-1 (13), the small GTPase Rab14 (56), a SNARE-associated protein Snapin (40), dynamin-2 (26), and MDM2 E3 ubiquitin ligase (8), 14-3-3-γ (14). Among these, the only one found in our study was actin but we did not include “actin” because the actin peptides identified could not discriminate between β-actin and γ-actin. Several methodological differences may have contributed to the largely nonoverlapping results. Chief among these is the fact that the prior studies were done almost exclusively in cultured cell models (either HEK293 cells or MDCK cells) stably transfected to express UT-A1, whereas the present studies were done in IMCDs freshly isolated from rat kidneys, which natively express UT-A1. The proteomes of HEK293 cells and MDCK cells likely differ from that of native IMCD cells, leading to different protein-protein interactions. Exceptions in the prior studies were Caveilin-1 and Snapin, whose interactions with UT-A1 were directly demonstrated in isolated rat IMCDs (13, 40). Supporting this view were our findings from AQP2 interactome analysis that showed that many of these proteins overlap with binding partners previously found in rat kidney inner medulla using pull-down assays with a phospho-Ser256 AQP2 peptide (69) or immunoprecipitation with an AQP2 antibody (46). These include heat shock 70 proteins (Hspa1b, Hspa2, Hspa8), Hspa5 (Bip/grp78), Anxa2 (69), Anxa2, Actn4, Sptan1, Myh9 (46).
Both UT-A1 and AQP2 channels are regulated by signaling pathways that involve increases in intracellular cAMP and calcium following occupancy of the heterotrimeric G protein-coupled vasopressin V2 receptor (9, 20, 51). Fifty-three interacting proteins were common to the AQP2 and UT-A1 lists, presumably reflecting “housekeeping” processes that may be common to all integral membrane proteins processed in the rough-ER/Golgi/endosomal pathway. Thus, we have concluded that the UT-A1 and AQP2 interactomes consist of many components that serve housekeeping functions (Fig. 9B, bottom), as well as components that may have more specific roles in the regulation of the two channels (Fig. 9B, top). Among the putative housekeeping genes were two 14-3-3 proteins (Ywhaq and Ywhaz), which can bind selectively to phosphorylated serines and threonines (67). Moeller et al. (41) have recently demonstrated phosphorylation-dependent interactions of aquaporin-2 with these two proteins (reported as 14-3-3-θ and -ζ).
The findings in this study point to the likelihood that UT-A1 and AQP2 do not exist solely within single monolithic complexes at the plasma membrane, but instead are bound to multiple interacting proteins likely to reside in different subcellular compartments (Fig. 4). The presence of numerous UT-A1-associated complexes was confirmed through the use of a gel-free electrophoresis system that allowed us to immunoblot fractions that contain different sized UT-1 complexes (Fig. 3B). The presence of interacting proteins from multiple compartments also gives us a snapshot of a very dynamic process in which UT-A1, like other integral membrane proteins expressed at the plasma membrane, is produced in the rough endoplasmic reticulum, processed through the endoplasmic reticulum and Golgi apparatus, delivered to endosomes that move into and out of the plasma membrane, with eventual degradation by lysosomes.
Previous studies on subcellular localization of UT-A1 using high-resolution electron microscopy have demonstrated a predominant presence of UT-A1 in the cytoplasm of IMCD cells (29, 37, 45), although its presence has been observed on the apical (27, 45) or the basolateral plasma membrane (27, 37). Studies of Ser84 and Ser486 phosphorylated UT-A showed virtually exclusive presence in intracellular compartment associated with the Golgi apparatus and subapical intracellular vesicles (27). This distribution pattern of UT-A1 is compatible with the view that only a small fraction of the UT-A1 in IMCD cells is involved in transcellular urea transport. Furthermore, immunocytochemistry has shown little or no general redistribution of UT-A1 in the cell in response to vasopressin (27, 28), suggesting that the pool of UT-A1 molecules regulated by vasopressin may be small compared with the total amount of UT-A1 in the cell. Consequently, from an experimental perspective, it has been necessary to employ surface labeling to measure vasopressin-associated UT-A1 trafficking (3, 4, 7, 28, 32, 33). Similarly, in rat IMCD, AQP2 is distributed throughout cytoplasm and the basolateral membrane, and upon stimulation by vasopressin, a striking redistribution of AQP2 occurs mainly to the apical plasma membrane but also to the basolateral membrane (10, 60, 61). Thus, most of the UT-A1 and much of the AQP2 in the unstimulated IMCD cells at any particular time are present intracellularly and in the basolateral plasma membrane in addition to their presence in the apical plasma membrane. Our result identifying both subunits of Na-K-ATPase bound to UT-A1 and our result showing that vasopressin reduces the interaction (Fig. 11 volcano analysis) are consistent with the idea that the basolateral interaction is physiologically regulated and reduced when UT-A1 or AQP2 traffics to the apical plasma membrane.
Beyond the numerous housekeeping genes identified, several regulatory proteins were identified that may have more specific roles with regard to urea transport. Of greatest interest was the presence of four different protein kinase proteins in the UT-A1 interactome (Cdc42bpb, Phkb, Camk2d, and Mtor). Phosphorylation has been shown to be involved in vasopressin-mediated regulation of UT-A1, by influencing the amount of UT-A1 that is present in the plasma membrane (4, 32, 33) or possibly by altering the gating properties of the UT-A1 channel (28). Vasopressin increases the phosphorylation at least three sites in rat UT-A1, viz. Ser84, Ser486, and Ser499 (1, 4, 25, 27). Accordingly, we carried out in vitro phosphorylation assays to confirm their roles. With the exception of Mtor, all of the kinases tested proved capable of phosphorylating one or more of the three vasopressin-regulated sites, with variable potency. Two of these protein kinases (Cdc42bpb, Phkb) are also known to be differentially phosphorylated in response to vasopressin. Whereas phosphorylation of Phkb at Ser27 was increased to 140% of control by dDAVP, phosphorylation of Cdc42bpb at Ser970 was decreased to 80% of control in rat IMCD (23). Interestingly, Phbg2, the catalytic subunit of phkb, is capable of phosphorylating UT-A1 at two sites, Ser488 and Ser499, sites known to be physiologically relevant (4, 33). By contrast, none of the aquaporin-2-interacting proteins identified in the present study were protein kinases.
Other regulatory proteins were identified in the UT-A1 interactome. This includes several proteins involved in ubiquitylation and neddylation, namely Usp9x, Nae1, and Uba3. Usp9x is a deubiquitylating enzyme that can prevent degradation and increase recycling of proteins through the removal of conjugated ubiquitin (65). In the collecting duct, Usp9x mRNA abundance has been shown to be increased by vasopressin (6). Ubiquitylation has been known as an important regulatory process for UT-A1 (8, 52, 54, 55), AQP2 (30, 35), and the epithelial Na channel ENaC (39). Nae1 and Uba3, whose binding to UT-A1 in response to vasopressin was increased for both, are the regulatory and catalytic subunit of NEDD-8 activating E1 ligase, the heterodimeric enzyme that binds and activates Nedd8 as an initial step in protein neddylation (47). Neddylation is required for ubiquitinating activity of cullin-RING ubiquitin E3 ligases (64).
Regulatory proteins identified in the AQP2 interactome included a large number of the Rab family small GTP-binding proteins (Fig. 7): Rab 1 and Rab2 (associated with endoplasmic reticulum-Gogli transport), Rab5 (early endosome), Rab7 (late endosome), Rab11 and Rab17 (recycling endosome), and Rab 14 (apical targeting) (38, 68). None of these were found in the UT-A1 interactome. Rab proteins are primarily involved in regulation of membrane trafficking in cells, and their appearance as AQP2-interacting proteins is compatible with membrane trafficking as the preeminent means of short-term regulation of AQP2.
In conclusion, we have generated lists of proteins that interact with vasopressin-regulated UT-A1 and AQP2 in rat IMCD. These interactome lists were used to create online resources to aid in mathematical modeling and experimental design in future studies.
GRANTS
This study was supported by the Intramural Budget of the NHLBI (Project Z01-HL-001285).
DISCLOSURES
No conflicts of interest, financial or otherwise, are declared by the authors.
AUTHOR CONTRIBUTIONS
C.-L.C., G.H., D.J.H., L.H., and P.A. performed experiments; C.-L.C., G.H., D.J.H., L.H., P.A., and M.A.K. analyzed data; C.-L.C., G.H., D.J.H., L.H., P.A., T.P., and M.A.K. interpreted results of experiments; C.-L.C., G.H., D.J.H., L.H., P.A., and M.A.K. prepared figures; C.-L.C. and M.A.K. drafted manuscript; C.-L.C., G.H., D.J.H., L.H., P.A., T.P., and M.A.K. edited and revised manuscript; C.-L.C., G.H., D.J.H., L.H., P.A., T.P., and M.A.K. approved final version of manuscript; M.A.K. conceived and designed research.
ACKNOWLEDGMENTS
Mass spectrometry was done in the NIH National Heart, Lung, and Blood Institute (NHLBI) Proteomics Core Facility (Drs. Marjan Gucek, Guanghui Wang, Angel Aponte, and Yong Chen). Gloria Hwang (Dickinson College) was a special volunteer summer student. Daniel Hageman (Case Western Reserve University, Cleveland, OH) and Lichy Han (Johns Hopkins University, Baltimore, MD) were NIH Biomedical Engineering Summer Internship Program (BESIP) summer students. Prashasti Agrawal (Dartmouth College, Hanover, NH) was a summer student sponsored by American Physiological Society Summer Intern Program. Trairak Pisitkun is supported by the Chulalongkorn Academic Advancement into Its 2nd Century (CUAASC) Project.
APPENDIX
UT-A1/UT-A3 stoichiometry in high-molecular-weight complex.
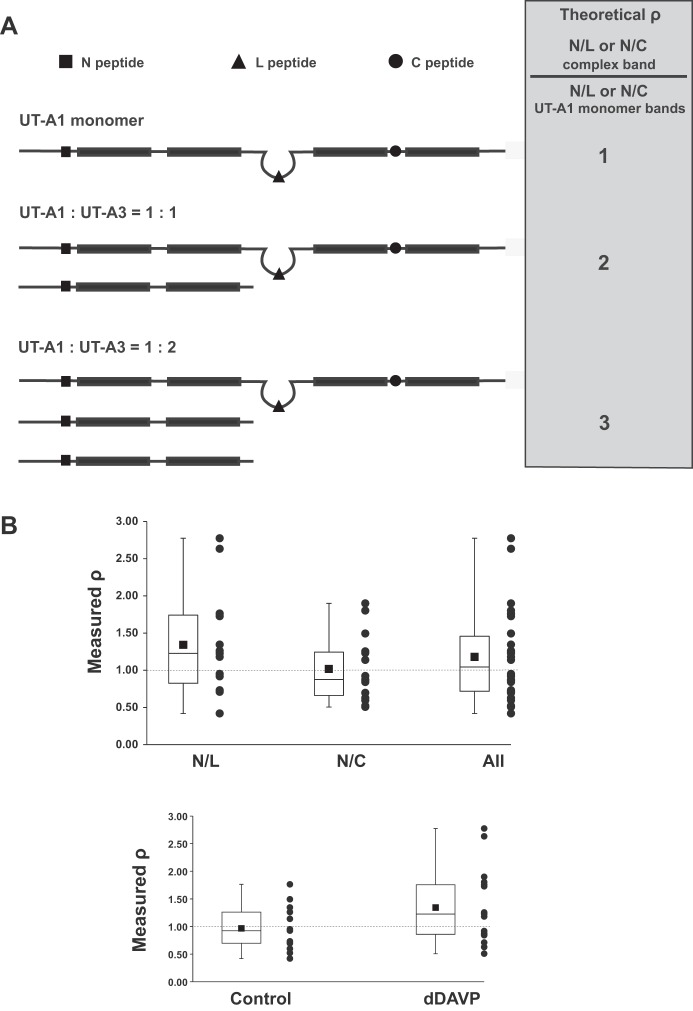
As discussed above, two alternatively spliced isoforms of the Slc14a2 gene product are expressed in IMCD cells, namely, UT-A1 and UT-A3 (Fig. 3, A and B). Figure 1 shows that UT-A3 can be detected in complexes of 150–250 kDa. Figure 2 shows that when UT-A1 is immunoprecipitated, UT-A3 can be detected in the immunoprecipitated material. Here, we asked the question: What is the molar ratio of UT-A3 to UT-A1 in the high-molecular-mass complexes at >250 kDa? In preliminary studies, we found peptides in all three regions of UT-A1 (highlighted in red, Fig. 3A). By quantification of these peptides, we can in principle determine the ratio of UT-A1 to UT-A3 in the high-molecular-weight IP product (Fig. 13A). The procedure is to quantify UT-A peptides corresponding to monomeric UT-A1 (gel pieces at 110–150 kDa) and the corresponding UT-A complex (gel pieces at >250 kDa). In theory, if UT-A3 is present in the immunoprecipitated high-molecular-weight protein complex, then peptides shared by UT-A3 and UT-A1 should be overrepresented in the high-molecular-weight sample compared with the monomeric UT-A1 sample. We can form a ratio of the intensity of a NH2-terminal hydrophobic region peptide to the intensity of either a Loop region peptide (N/L) or a COOH-terminal hydrophobic region peptide (N/C). As indicated on the right side of Fig. 13A, a ratio of ratios (ρ) can be calculated as: ρ = (N/L)complex/(N/L)monomer or ρ = (N/C)complex/(N/C)monomer. If the complex band consists of a 1-to-1 ratio of UT-A1 to UT-A3, the value of ρ should be ~2. If the complex band consists of a 1-to-2 ratio of UT-A1 to UT-A3, the value of ρ should be ~3. If the complex consists of UT-A1 only, ρ should be ~1. Figure 13B shows box-and-whiskers plots of the measured ρ when N/L and N/C values were separately taken or combined. All three have a median value (line in the box) or a mean value (square symbol) near 1 (the dashed line). A similar result was obtained when the data were separated into control and dDAVP-treatment.
Fig. 13.
Stoichiometry determination of high-molecular-weight UT-A complex. A: the principle of UT-A1/UT-A3 stoichiometry determination was based on a ratio method (complex/UT-A1 monomer band), which can be calculated from either N/L or N/C, where N is peptide identified from shared region of UT-A1 and UT-A3, L and C are peptides present only in UT-A1 (see Fig. 3). Predicted ratios from mass spectrometry determination are shown in gray background region. The quantification used the label-free method either with or without stable isotope labeled standards. B, top: a box-and-whiskers plot of measured ρ based on individual values of N/L only, or N/C only, or N/L and N/C peptide combine. Bottom: a box-and-whiskers plot of measured ρ when N/L and N/C are pooled for control- or dDAVP-treated group. Both the median (the line in the box) and the average (square symbol) values are close to 1.
We have also performed absolute quantification using AQUA peptides. Four heavy isotope-labeled AQUA peptides (13C, 15N on arginine or lysine) were synthesized (Thermo Scientific). These peptides were targeted to different regions of UT-A1 and UT-A3: 1) the NH2 terminus of UT-A1 and UT-A3 (GGFSLFQAVSYLTGDMK); 2) the loop region that is unique to UT-A1 (AEEGSETVFPR); 3) the COOH terminus of UT-A1, not present in UT-A3 (TTWIQSSMIAGGK); and 4) the one tryptic peptide that is unique to UT-A3 (SDEQKPPnGD). These AQUA peptides were used as internal standards for detection and quantification of specific peptides by targeted selection of precursor ion m/z ratio, or so called “targeted-ion selection” (TIS) LC-MS/MS as described (1). The result of AQUA experiments also showed a peptide ratio of near 1 in either control samples (1.01 ± 0.11) or dDAVP-treated samples (1.13 ± 0.07). Thus, we conclude that the immunoprecipitated high-molecular-weight UT-A1 complex does not contain significant amounts of UT-A3. This notion is further supported by the fact that the UT-A3 unique peptide (SDEQKPPnGD, cyan color in Fig. 3B) was not detected in samples above molecular mass 250 kDa (control or dDAVP-treated).
REFERENCES
- 1.Bansal AD, Hoffert JD, Pisitkun T, Hwang S, Chou CL, Boja ES, Wang G, Knepper MA. Phosphoproteomic profiling reveals vasopressin-regulated phosphorylation sites in collecting duct. J Am Soc Nephrol 21: 303–315, 2010. doi: 10.1681/ASN.2009070728. [DOI] [PMC free article] [PubMed] [Google Scholar]
- 2.Berliner RW, Levinsky NG, Davidson DG, Eden M. Dilution and concentration of the urine and the action of antidiuretic hormone. Am J Med 24: 730–744, 1958. doi: 10.1016/0002-9343(58)90377-2. [DOI] [PubMed] [Google Scholar]
- 3.Blessing NW, Blount MA, Sands JM, Martin CF, Klein JD. Urea transporters UT-A1 and UT-A3 accumulate in the plasma membrane in response to increased hypertonicity. Am J Physiol Renal Physiol 295: F1336–F1341, 2008. doi: 10.1152/ajprenal.90228.2008. [DOI] [PMC free article] [PubMed] [Google Scholar]
- 4.Blount MA, Mistry AC, Fröhlich O, Price SR, Chen G, Sands JM, Klein JD. Phosphorylation of UT-A1 urea transporter at serines 486 and 499 is important for vasopressin-regulated activity and membrane accumulation. Am J Physiol Renal Physiol 295: F295–F299, 2008. doi: 10.1152/ajprenal.00102.2008. [DOI] [PMC free article] [PubMed] [Google Scholar]
- 5.Bradford AD, Terris JM, Ecelbarger CA, Klein JD, Sands JM, Chou CL, Knepper MA. 97- and 117-kDa forms of collecting duct urea transporter UT-A1 are due to different states of glycosylation. Am J Physiol Renal Physiol 281: F133–F143, 2001. [DOI] [PubMed] [Google Scholar]
- 6.Cai Q, McReynolds MR, Keck M, Greer KA, Hoying JB, Brooks HL. Vasopressin receptor subtype 2 activation increases cell proliferation in the renal medulla of AQP1 null mice. Am J Physiol Renal Physiol 293: F1858–F1864, 2007. doi: 10.1152/ajprenal.00068.2007. [DOI] [PubMed] [Google Scholar]
- 7.Chen G, Fröhlich O, Yang Y, Klein JD, Sands JM. Loss of N-linked glycosylation reduces urea transporter UT-A1 response to vasopressin. J Biol Chem 281: 27436–27442, 2006. doi: 10.1074/jbc.M605525200. [DOI] [PubMed] [Google Scholar]
- 8.Chen G, Huang H, Fröhlich O, Yang Y, Klein JD, Price SR, Sands JM. MDM2 E3 ubiquitin ligase mediates UT-A1 urea transporter ubiquitination and degradation. Am J Physiol Renal Physiol 295: F1528–F1534, 2008. doi: 10.1152/ajprenal.90482.2008. [DOI] [PMC free article] [PubMed] [Google Scholar]
- 9.Chou CL, Yip KP, Michea L, Kador K, Ferraris JD, Wade JB, Knepper MA. Regulation of aquaporin-2 trafficking by vasopressin in the renal collecting duct. Roles of ryanodine-sensitive Ca2+ stores and calmodulin. J Biol Chem 275: 36839–36846, 2000. doi: 10.1074/jbc.M005552200. [DOI] [PubMed] [Google Scholar]
- 10.Christensen BM, Wang W, Frøkiaer J, Nielsen S. Axial heterogeneity in basolateral AQP2 localization in rat kidney: effect of vasopressin. Am J Physiol Renal Physiol 284: F701–F717, 2003. doi: 10.1152/ajprenal.00234.2002. [DOI] [PubMed] [Google Scholar]
- 11.DiGiovanni SR, Nielsen S, Christensen EI, Knepper MA. Regulation of collecting duct water channel expression by vasopressin in Brattleboro rat. Proc Natl Acad Sci USA 91: 8984–8988, 1994. doi: 10.1073/pnas.91.19.8984. [DOI] [PMC free article] [PubMed] [Google Scholar]
- 12.Eng JK, McCormack AL, Yates JR III. An approach to correlate tandem mass spectral data of peptides with amino acid sequences in a protein database. J Am Soc Mass Spectrom 5: 976–989, 1994. doi: 10.1016/1044-0305(94)80016-2. [DOI] [PubMed] [Google Scholar]
- 13.Feng X, Huang H, Yang Y, Fröhlich O, Klein JD, Sands JM, Chen G. Caveolin-1 directly interacts with UT-A1 urea transporter: the role of caveolae/lipid rafts in UT-A1 regulation at the cell membrane. Am J Physiol Renal Physiol 296: F1514–F1520, 2009. doi: 10.1152/ajprenal.00068.2009. [DOI] [PMC free article] [PubMed] [Google Scholar]
- 14.Feng X, Li Z, Du Y, Fu H, Klein JD, Cai H, Sands JM, Chen G. Downregulation of urea transporter UT-A1 activity by 14-3-3 protein. Am J Physiol Renal Physiol 309: F71–F78, 2015. doi: 10.1152/ajprenal.00546.2014. [DOI] [PMC free article] [PubMed] [Google Scholar]
- 16.Fenton RA, Chou CL, Stewart GS, Smith CP, Knepper MA. Urinary concentrating defect in mice with selective deletion of phloretin-sensitive urea transporters in the renal collecting duct. Proc Natl Acad Sci USA 101: 7469–7474, 2004. doi: 10.1073/pnas.0401704101. [DOI] [PMC free article] [PubMed] [Google Scholar]
- 17.Fenton RA, Cooper GJ, Morris ID, Smith CP. Coordinated expression of UT-A and UT-B urea transporters in rat testis. Am J Physiol Cell Physiol 282: C1492–C1501, 2002. doi: 10.1152/ajpcell.00567.2001. [DOI] [PubMed] [Google Scholar]
- 18.Fenton RA, Cottingham CA, Stewart GS, Howorth A, Hewitt JA, Smith CP. Structure and characterization of the mouse UT-A gene (Slc14a2). Am J Physiol Renal Physiol 282: F630–F638, 2002. doi: 10.1152/ajprenal.00264.2001. [DOI] [PubMed] [Google Scholar]
- 19.Hoban CA, Black LN, Ordas RJ, Gumina DL, Pulous FE, Sim JH, Sands JM, Blount MA. Vasopressin regulation of multisite phosphorylation of UT-A1 in the inner medullary collecting duct. Am J Physiol Renal Physiol 308: F49–F55, 2015. doi: 10.1152/ajprenal.00642.2013. [DOI] [PMC free article] [PubMed] [Google Scholar]
- 20.Hoffert JD, Chou CL, Fenton RA, Knepper MA. Calmodulin is required for vasopressin-stimulated increase in cyclic AMP production in inner medullary collecting duct. J Biol Chem 280: 13624–13630, 2005. doi: 10.1074/jbc.M500040200. [DOI] [PMC free article] [PubMed] [Google Scholar]
- 21.Hoffert JD, Fenton RA, Moeller HB, Simons B, Tchapyjnikov D, McDill BW, Yu MJ, Pisitkun T, Chen F, Knepper MA. Vasopressin-stimulated increase in phosphorylation at Ser269 potentiates plasma membrane retention of aquaporin-2. J Biol Chem 283: 24617–24627, 2008. doi: 10.1074/jbc.M803074200. [DOI] [PMC free article] [PubMed] [Google Scholar]
- 22.Hoffert JD, Nielsen J, Yu MJ, Pisitkun T, Schleicher SM, Nielsen S, Knepper MA. Dynamics of aquaporin-2 serine-261 phosphorylation in response to short-term vasopressin treatment in collecting duct. Am J Physiol Renal Physiol 292: F691–F700, 2007. doi: 10.1152/ajprenal.00284.2006. [DOI] [PubMed] [Google Scholar]
- 23.Hoffert JD, Pisitkun T, Saeed F, Song JH, Chou CL, Knepper MA. Dynamics of the G protein-coupled vasopressin V2 receptor signaling network revealed by quantitative phosphoproteomics. Mol Cell Proteomics 11: M11.014613, 2012. doi: 10.1074/mcp.M111.014613. [DOI] [PMC free article] [PubMed] [Google Scholar]
- 24.Hoffert JD, Pisitkun T, Wang G, Shen RF, Knepper MA. Quantitative phosphoproteomics of vasopressin-sensitive renal cells: regulation of aquaporin-2 phosphorylation at two sites. Proc Natl Acad Sci USA 103: 7159–7164, 2006. doi: 10.1073/pnas.0600895103. [DOI] [PMC free article] [PubMed] [Google Scholar]
- 25.Hoffert JD, Pisitkun T, Wang G, Shen RF, Knepper MA. Quantitative phosphoproteomics of vasopressin-sensitive renal cells: regulation of aquaporin-2 phosphorylation at two sites.Proc Natl Acad Sci USA 103: 7159–7164, 2006. doi: 10.1073/pnas.0600895103. [DOI] [PMC free article] [PubMed] [Google Scholar]
- 26.Huang H, Feng X, Zhuang J, Fröhlich O, Klein JD, Cai H, Sands JM, Chen G. Internalization of UT-A1 urea transporter is dynamin dependent and mediated by both caveolae- and clathrin-coated pit pathways. Am J Physiol Renal Physiol 299: F1389–F1395, 2010. doi: 10.1152/ajprenal.00718.2009. [DOI] [PMC free article] [PubMed] [Google Scholar]
- 27.Hwang S, Gunaratne R, Rinschen MM, Yu MJ, Pisitkun T, Hoffert JD, Fenton RA, Knepper MA, Chou CL. Vasopressin increases phosphorylation of Ser84 and Ser486 in Slc14a2 collecting duct urea transporters. Am J Physiol Renal Physiol 299: F559–F567, 2010. doi: 10.1152/ajprenal.00617.2009. [DOI] [PMC free article] [PubMed] [Google Scholar]
- 28.Inoue T, Terris J, Ecelbarger CA, Chou CL, Nielsen S, Knepper MA. Vasopressin regulates apical targeting of aquaporin-2 but not of UT1 urea transporter in renal collecting duct. Am J Physiol Renal Physiol 276: F559–F566, 1999. [DOI] [PubMed] [Google Scholar]
- 29.Jung JY, Madsen KM, Han KH, Yang CW, Knepper MA, Sands JM, Kim J. Expression of urea transporters in potassium-depleted mouse kidney. Am J Physiol Renal Physiol 285: F1210–F1224, 2003. doi: 10.1152/ajprenal.00111.2003. [DOI] [PubMed] [Google Scholar]
- 30.Kamsteeg EJ, Hendriks G, Boone M, Konings IB, Oorschot V, van der Sluijs P, Klumperman J, Deen PM. Short-chain ubiquitination mediates the regulated endocytosis of the aquaporin-2 water channel. Proc Natl Acad Sci USA 103: 18344–18349, 2006. doi: 10.1073/pnas.0604073103. [DOI] [PMC free article] [PubMed] [Google Scholar]
- 31.Karakashian A, Timmer RT, Klein JD, Gunn RB, Sands JM, Bagnasco SM. Cloning and characterization of two new isoforms of the rat kidney urea transporter: UT-A3 and UT-A4. J Am Soc Nephrol 10: 230–237, 1999. [DOI] [PubMed] [Google Scholar]
- 32.Klein JD, Blount MA, Fröhlich O, Denson CE, Tan X, Sim JH, Martin CF, Sands JM. Phosphorylation of UT-A1 on serine 486 correlates with membrane accumulation and urea transport activity in both rat IMCDs and cultured cells. Am J Physiol Renal Physiol 298: F935–F940, 2010. doi: 10.1152/ajprenal.00682.2009. [DOI] [PMC free article] [PubMed] [Google Scholar]
- 33.Klein JD, Fröhlich O, Blount MA, Martin CF, Smith TD, Sands JM. Vasopressin increases plasma membrane accumulation of urea transporter UT-A1 in rat inner medullary collecting ducts. J Am Soc Nephrol 17: 2680–2686, 2006. doi: 10.1681/ASN.2006030246. [DOI] [PubMed] [Google Scholar]
- 34.Knepper MA, Roch-Ramel F. Pathways of urea transport in the mammalian kidney. Kidney Int 31: 629–633, 1987. doi: 10.1038/ki.1987.44. [DOI] [PubMed] [Google Scholar]
- 35.Lee YJ, Kwon TH. Ubiquitination of aquaporin-2 in the kidney. Electrolyte Blood Press 7: 1–4, 2009. doi: 10.5049/EBP.2009.7.1.1. [DOI] [PMC free article] [PubMed] [Google Scholar]
- 36.Levin EJ, Quick M, Zhou M. Crystal structure of a bacterial homologue of the kidney urea transporter. Nature 462: 757–761, 2009. doi: 10.1038/nature08558. [DOI] [PMC free article] [PubMed] [Google Scholar]
- 37.Lim SW, Han KH, Jung JY, Kim WY, Yang CW, Sands JM, Knepper MA, Madsen KM, Kim J. Ultrastructural localization of UT-A and UT-B in rat kidneys with different hydration status. Am J Physiol Regul Integr Comp Physiol 290: R479–R492, 2006. doi: 10.1152/ajpregu.00512.2005. [DOI] [PubMed] [Google Scholar]
- 38.Lu R, Wilson JM. Rab14 specifies the apical membrane through Arf6-mediated regulation of lipid domains and Cdc42. Sci Rep 6: 38249, 2016. doi: 10.1038/srep38249. [DOI] [PMC free article] [PubMed] [Google Scholar]
- 39.Medvar B, Raghuram V, Pisitkun T, Sarkar A, Knepper MA. Comprehensive database of human E3 ubiquitin ligases: application to aquaporin-2 regulation. Physiol Genomics 48: 502–512, 2016. doi: 10.1152/physiolgenomics.00031.2016. [DOI] [PMC free article] [PubMed] [Google Scholar]
- 40.Mistry AC, Mallick R, Fröhlich O, Klein JD, Rehm A, Chen G, Sands JM. The UT-A1 urea transporter interacts with snapin, a SNARE-associated protein. J Biol Chem 282: 30097–30106, 2007. doi: 10.1074/jbc.M705866200. [DOI] [PubMed] [Google Scholar]
- 41.Moeller HB, Slengerik-Hansen J, Aroankins T, Assentoft M, MacAulay N, Moestrup SK, Bhalla V, Fenton RA. Regulation of the water channel aquaporin-2 via 14-3-3θ and -ζ. J Biol Chem 291: 2469–2484, 2016. doi: 10.1074/jbc.M115.691121. [DOI] [PMC free article] [PubMed] [Google Scholar]
- 42.Nedvetsky PI, Tabor V, Tamma G, Beulshausen S, Skroblin P, Kirschner A, Mutig K, Boltzen M, Petrucci O, Vossenkämper A, Wiesner B, Bachmann S, Rosenthal W, Klussmann E. Reciprocal regulation of aquaporin-2 abundance and degradation by protein kinase A and p38-MAP kinase. J Am Soc Nephrol 21: 1645–1656, 2010. doi: 10.1681/ASN.2009111190. [DOI] [PMC free article] [PubMed] [Google Scholar]
- 43.Nielsen S, Chou CL, Marples D, Christensen EI, Kishore BK, Knepper MA. Vasopressin increases water permeability of kidney collecting duct by inducing translocation of aquaporin-CD water channels to plasma membrane. Proc Natl Acad Sci USA 92: 1013–1017, 1995. doi: 10.1073/pnas.92.4.1013. [DOI] [PMC free article] [PubMed] [Google Scholar]
- 44.Nielsen S, DiGiovanni SR, Christensen EI, Knepper MA, Harris HW. Cellular and subcellular immunolocalization of vasopressin-regulated water channel in rat kidney. Proc Natl Acad Sci USA 90: 11663–11667, 1993. doi: 10.1073/pnas.90.24.11663. [DOI] [PMC free article] [PubMed] [Google Scholar]
- 45.Nielsen S, Terris J, Smith CP, Hediger MA, Ecelbarger CA, Knepper MA. Cellular and subcellular localization of the vasopressin- regulated urea transporter in rat kidney. Proc Natl Acad Sci USA 93: 5495–5500, 1996. doi: 10.1073/pnas.93.11.5495. [DOI] [PMC free article] [PubMed] [Google Scholar]
- 46.Noda Y, Horikawa S, Katayama Y, Sasaki S. Identification of a multiprotein “motor” complex binding to water channel aquaporin-2. Biochem Biophys Res Commun 330: 1041–1047, 2005. doi: 10.1016/j.bbrc.2005.03.079. [DOI] [PubMed] [Google Scholar]
- 47.Osaka F, Kawasaki H, Aida N, Saeki M, Chiba T, Kawashima S, Tanaka K, Kato S. A new NEDD8-ligating system for cullin-4A. Genes Dev 12: 2263–2268, 1998. doi: 10.1101/gad.12.15.2263. [DOI] [PMC free article] [PubMed] [Google Scholar]
- 48.Pickering CM, Grady C, Medvar B, Emamian M, Sandoval PC, Zhao Y, Yang CR, Jung HJ, Chou CL, Knepper MA. Proteomic profiling of nuclear fractions from native renal inner medullary collecting duct cells. Physiol Genomics 48: 154–166, 2016. doi: 10.1152/physiolgenomics.00090.2015. [DOI] [PMC free article] [PubMed] [Google Scholar]
- 49.Sandoval P, Slentz D, Pisitkun T, Yu MJ, Miller RL, Hoffert J, Knepper MA. LC-MS/MS-based large-scale profiling of protein half lives in renal collecting duct cells reveals that vasopressin increases half-life of aquaporin-2 protein (Abstract) FASEB J 25, Suppl 1: 1039.37, 2011. [Google Scholar]
- 50.Sands JM, Nonoguchi H, Knepper MA. Vasopressin effects on urea and H2O transport in inner medullary collecting duct subsegments. Am J Physiol Renal Physiol 253: F823–F832, 1987. [DOI] [PubMed] [Google Scholar]
- 51.Star RA, Nonoguchi H, Balaban R, Knepper MA. Calcium and cyclic adenosine monophosphate as second messengers for vasopressin in the rat inner medullary collecting duct. J Clin Invest 81: 1879–1888, 1988. doi: 10.1172/JCI113534. [DOI] [PMC free article] [PubMed] [Google Scholar]
- 52.Stewart GS, O’Brien JH, Smith CP. Ubiquitination regulates the plasma membrane expression of renal UT-A urea transporters. Am J Physiol Cell Physiol 295: C121–C129, 2008. doi: 10.1152/ajpcell.00444.2007. [DOI] [PubMed] [Google Scholar]
- 53.Stokes JB, Grupp C, Kinne RKH. Purification of rat papillary collecting duct cells: functional and metabolic assessment. Am J Physiol Renal Physiol 253: F251–F262, 1987. [DOI] [PubMed] [Google Scholar]
- 54.Su H, Carter CB, Laur O, Sands JM, Chen G. Forskolin stimulation promotes urea transporter UT-A1 ubiquitination, endocytosis, and degradation in MDCK cells. Am J Physiol Renal Physiol 303: F1325–F1332, 2012. doi: 10.1152/ajprenal.00248.2012. [DOI] [PMC free article] [PubMed] [Google Scholar]
- 55.Su H, Chen M, Sands JM, Chen G. Activation of the cAMP/PKA pathway induces UT-A1 urea transporter monoubiquitination and targets it for lysosomal degradation. Am J Physiol Renal Physiol 305: F1775–F1782, 2013. doi: 10.1152/ajprenal.00393.2013. [DOI] [PMC free article] [PubMed] [Google Scholar]
- 56.Su H, Liu B, Fröhlich O, Ma H, Sands JM, Chen G. Small GTPase Rab14 down-regulates UT-A1 urea transport activity through enhanced clathrin-dependent endocytosis. FASEB J 27: 4100–4107, 2013. doi: 10.1096/fj.13-229294. [DOI] [PMC free article] [PubMed] [Google Scholar]
- 57.Tanner S, Shu H, Frank A, Wang LC, Zandi E, Mumby M, Pevzner PA, Bafna V. InsPecT: identification of posttranslationally modified peptides from tandem mass spectra. Anal Chem 77: 4626–4639, 2005. doi: 10.1021/ac050102d. [DOI] [PubMed] [Google Scholar]
- 58.Terris JM, Knepper MA, Wade JB. UT-A3: localization and characterization of an additional urea transporter isoform in the IMCD. Am J Physiol Renal Physiol 280: F325–F332, 2001. [DOI] [PubMed] [Google Scholar]
- 59.Uawithya P, Pisitkun T, Ruttenberg BE, Knepper MA. Transcriptional profiling of native inner medullary collecting duct cells from rat kidney. Physiol Genomics 32: 229–253, 2008. doi: 10.1152/physiolgenomics.00201.2007. [DOI] [PMC free article] [PubMed] [Google Scholar]
- 60.Umejiego EN, Wang Y, Knepper MA, Chou CL. Roflumilast and aquaporin-2 regulation in rat renal inner medullary collecting duct. Physiol Rep 5: e13121, 2017. doi: 10.14814/phy2.13121. [DOI] [PMC free article] [PubMed] [Google Scholar]
- 61.van Balkom BW, van Raak M, Breton S, Pastor-Soler N, Bouley R, van der Sluijs P, Brown D, Deen PM. Hypertonicity is involved in redirecting the aquaporin-2 water channel into the basolateral, instead of the apical, plasma membrane of renal epithelial cells. J Biol Chem 278: 1101–1107, 2003. doi: 10.1074/jbc.M207339200. [DOI] [PubMed] [Google Scholar]
- 62.Wall SM, Han JS, Chou CL, Knepper MA. Kinetics of urea and water permeability activation by vasopressin in rat terminal IMCD. Am J Physiol Renal Physiol 262: F989–F998, 1992. [DOI] [PubMed] [Google Scholar]
- 63.Wang G, Wu WW, Zeng W, Chou CL, Shen RF. Label-free protein quantification using LC-coupled ion trap or FT mass spectrometry: reproducibility, linearity, and application with complex proteomes. J Proteome Res 5: 1214–1223, 2006. doi: 10.1021/pr050406g. [DOI] [PubMed] [Google Scholar]
- 64.Wu JT, Chan YR, Chien CT. Protection of cullin-RING E3 ligases by CSN-UBP12. Trends Cell Biol 16: 362–369, 2006. doi: 10.1016/j.tcb.2006.05.001. [DOI] [PubMed] [Google Scholar]
- 65.Xie Y, Avello M, Schirle M, McWhinnie E, Feng Y, Bric-Furlong E, Wilson C, Nathans R, Zhang J, Kirschner MW, Huang SM, Cong F. Deubiquitinase FAM/USP9X interacts with the E3 ubiquitin ligase SMURF1 protein and protects it from ligase activity-dependent self-degradation. J Biol Chem 288: 2976–2985, 2013. doi: 10.1074/jbc.M112.430066. [DOI] [PMC free article] [PubMed] [Google Scholar]
- 66.Xu G, Su H, Carter CB, Fröhlich O, Chen G. Depolymerization of cortical actin inhibits UT-A1 urea transporter endocytosis but promotes forskolin-stimulated membrane trafficking. Am J Physiol Cell Physiol 302: C1012–C1018, 2012. doi: 10.1152/ajpcell.00440.2011. [DOI] [PMC free article] [PubMed] [Google Scholar]
- 67.Yaffe MB, Cantley LC. Signal transduction. Grabbing phosphoproteins. Nature 402: 30–31, 1999. doi: 10.1038/46925. [DOI] [PubMed] [Google Scholar]
- 68.Zhen Y, Stenmark H. Cellular functions of Rab GTPases at a glance. J Cell Sci 128: 3171–3176, 2015. doi: 10.1242/jcs.166074. [DOI] [PubMed] [Google Scholar]
- 69.Zwang NA, Hoffert JD, Pisitkun T, Moeller HB, Fenton RA, Knepper MA. Identification of phosphorylation-dependent binding partners of aquaporin-2 using protein mass spectrometry. J Proteome Res 8: 1540–1554, 2009. doi: 10.1021/pr800894p. [DOI] [PMC free article] [PubMed] [Google Scholar]


