

Abstract
The mitochondrial network in muscle is controlled by the opposing processes of mitochondrial biogenesis and mitophagy. The coactivator peroxisome proliferator-activated receptor-γ coactivator-1α (PGC-1α) regulates biogenesis, while the transcription of mitophagy-related genes is controlled by transcription factor EB (TFEB). PGC-1α activation is induced by exercise; however, the effect of exercise on TFEB is not fully known. We investigated the interplay between PGC-1α and TFEB on mitochondria in response to acute contractile activity in C2C12 myotubes and following exercise in wild-type and PGC-1α knockout mice. TFEB nuclear localization was increased by 1.6-fold following 2 h of acute myotube contractile activity in culture, while TFEB transcription was also simultaneously increased by twofold to threefold. Viral overexpression of TFEB in myotubes increased PGC-1α and cytochrome-c oxidase-IV gene expression. In wild-type mice, TFEB translocation to the nucleus increased 2.4-fold in response to acute exercise, while TFEB transcription, assessed through the electroporation of a TFEB promoter construct, was elevated by fourfold. These exercise effects were dependent on the presence of PGC-1α. Our data indicate that acute exercise provokes TFEB expression and activation in a PGC-1α-dependent manner and suggest that TFEB, along with PGC-1α, is an important regulator of mitochondrial biogenesis in muscle as a result of exercise.
Keywords: mitochondrial biogenesis; autophagy; mitophagy; contractile activity, transcription; transcription factor EB; peroxisome proliferator-activated receptor-γ coactivator-1α
INTRODUCTION
Mitochondrial content and function are essential for the maintenance of skeletal muscle health throughout the life span. Skeletal muscle comprises ~40% of body mass and is largely responsible for determining total metabolic rate (34). Muscle relies on mitochondria to play a central role in regulating muscle metabolism, as well as the control of energy-sensitive signaling pathways, reactive oxygen species production, and calcium homeostasis (13, 34, 49). In response to the increased energy demands of exercise, muscle adapts remarkably well by remodeling and expanding the mitochondrial network. In contrast, a reduction in the quality and quantity of the mitochondrial pool has been implicated in a number of conditions affecting muscle metabolic health. To maintain an optimal pool of mitochondria, two competing, yet equally important quality control mechanisms are involved, termed “mitochondrial biogenesis” and “mitochondrial specific autophagy,” or mitophagy (40).
Mitochondrial biogenesis involves the proliferation of the mitochondrial network through the expansion of the existing organelle reticulum. Biogenesis is largely controlled by peroxisome proliferator-activated receptor-γ coactivator-1α (PGC-1α), a transcriptional coactivator that acts in the nucleus (1, 33). Increases in energy demand, such as that imposed by exercise, activate PGC-1α, thereby promoting the coordinated transcription of nuclear and mitochondrial DNA-encoded genes to induce the synthesis of new mitochondria. As muscle adapts to exercise and the associated metabolic demands, there is an increase in PGC-1α expression, leading to augmented mitochondrial content and function.
Under steady-state conditions, this expansion of the mitochondrial network is balanced by mitophagy, which mediates the degradation of dysfunctional mitochondria (8a, 31, 40, 52). Hallmark indicators of dysfunctional mitochondria include reductions in membrane potential and an increase in reactive oxygen species production. This triggers mitochondrial detachment from the healthy reticulum via organelle fission and the subsequent tagging of mitochondria for degradation (22, 29, 49, 52). Tagged mitochondria are then engulfed by double-membrane autophagosomes, which travel on microtubule tracks to fuse with lysosomes for degradation (8a, 18, 38, 51).
Mitophagy is thought to be regulated in part by transcription factor EB (TFEB; 29, 43), a protein that controls the expression of genes associated with lysosomes, autophagosome formation, cargo recognition, and autophagosome-lysosome fusion (29, 41, 43), such as microtubule-associated proteins-1A/1B light chain 3A (LC3), sequestosome-1 (SQSTM1), and lysosomal associated membrane protein-1 (LAMP1). The nuclear localization and function of TFEB are regulated by its phosphorylation. Phosphorylation of TFEB on Ser142 and Ser211 by mammalian/mechanistic target of rapamycin (mTOR) and ERK2 serves to retain TFEB inactive within cytosol. Under conditions of cellular stress, TFEB is dephosphorylated by calcineurin, which itself is activated by elevations in cytosolic [Ca2+] (29, 43, 50). Once dephosphorylated, TFEB translocates to the nucleus and promotes the transcription of lysosome and autophagy genes. Recent evidence suggests that mitophagy is activated following exercise (15, 24, 50). Since exercise is known to increase cystolic Ca2+, it is reasonable to speculate that TFEB may be activated by exercise.
Mitochondrial biogenesis and mitophagy work hand in hand to conserve mitochondrial health in skeletal muscle. Since the two processes complement one another, we hypothesize that a coordination between TFEB and PGC-1α, the two master regulators of these pathways, could exist (40, 45). Recent evidence has found a role for PGC-1α in mediating exercise-induced mitophagy (51), yet less is known about the effect of exercise on TFEB in muscle (26, 29) and the mechanisms underlying the effect of exercise on TFEB expression. Thus the purposes of this study were to further elucidate the relationship between PGC-1α and TFEB and to document the effect of acute exercise on the regulation of TFEB. To do this, we employed a cell culture model of muscle contractile activity, as well as exercise in mice, in the presence and absence of PGC-1α.
MATERIALS AND METHODS
Cell culture.
C2C12 murine skeletal muscle cells were proliferated on six-well culture dishes (Sarstedt, Montreal, QC, Canada, or Bio Basic Canada, Markham, ON, Canada) coated with 0.1% gelatin in growth media, Dulbecco's modified Eagle's medium (DMEM) supplemented with 10% fetal bovine serum (FBS) and 1% penicillin-streptomycin (P/S). At 80–95% confluency, differentiation into myotubes was induced by switching the medium to differentiation media (DM), DMEM supplemented with 5% heat-inactivated horse serum (HS) and 1% P/S.
Stimulation of muscle cells.
Lids from plastic six-well dishes (3.5-mm wells) were fitted with two platinum wire electrodes such that 2-cm lengths ran parallel to each other at opposite ends of the dish 2 cm apart. This protocol has previously been described in detail (8). Myotubes were subjected to electrical stimulation-induced contractile activity in a parallel circuit at a frequency of 5 Hz and an intensity of 11 V acutely for one bout of 2 or 5 h of stimulation, with or without 2 h of recovery. Differentiation medium (2 ml) was replenished 1 h before stimulation. Following this time, custom-made lids with implanted electrodes replaced typical lids, and dishes were attached to the electrical stimulator unit. Each well was carefully inspected to ensure that the electrodes were submerged in the medium before the stimulation. Cells were collected for enzyme, protein, or RNA extractions immediately after the stimulation or recovery period.
Infection of target cells.
C2C12 myotubes were differentiated in six-well plates and were infected on day 4 of differentiation with premade pAdEasy-TFEB virus and pAdEasy-green fluorescent protein (GFP) control viruses. In a 50-ml tube, 1 ml of media was combined with 10 multiplicity of infection of viral stock. For each six-well plate, three wells were used as TFEB-infected cells, and three wells were used as GFP control cells. Media were removed from the target cells and replaced with 1 ml of viral mixture. Cells were incubated with virus at 37°C for 24 h. Immediately following, the medium containing virus was removed from the target cells, myotubes were washed twice with DM, and the medium was replenished each day for desired days of infection.
Fluorescence microscopy.
C2C12 cells were plated on glass coverslips on six-well dishes (3.5-mm wells) coated with 0.1% gelatin. Cells were differentiated on the coverslips and electrically stimulated for 5 h. Following treatment, cells were fixed with 4% paraformaldehyde in PBS and permeabilized with 0.3% Triton. Nonspecific binding was blocked with 5% normal goat serum in PBS. Slides were probed for 1 h at room temperature with primary antibodies specific for voltage-dependent anion channel (VDAC)/porin (1:500) or nucleoporin p62 (p62)/SQSTM1 (1:500). Subsequently, slides were treated with the appropriate Alexa Fluor secondary antibody (Life Technologies) for 1 h at room temperature. Finally, slides were washed with 4′,6-diamidino-2-phenylindole (DAPI) nuclei staining (1:500) for 15 min. Mounted slides were visualized with an inverted Nikon Eclipse TE2000-U fluorescence microscope equipped with ×20 objective lens. All representative images were taken at the same exposure per condition.
PGC wild-type and knockout animals.
PGC-1α knockout (KO) and wild-type (WT) mice were produced by crossing heterozygote mice. Ear clippings were obtained, and DNA was extracted using the phenol-chloroform-isoamyl alcohol method. Genotype was determined by the presence of either a KO- or WT-specific DNA fragment using traditional PCR analyses. Mice were housed in a 12:12-h light-to-dark cycle and fed normal rodent chow. Both male and female PGC-1α KO and WT mice were used at 4–5 mo of age (n = 7–9). All experiments were approved by the York University Animal Care Committee in accordance with Canadian Council on Animal Care standards.
Exercise protocol.
PGC-1α WT and KO mice were acclimatized to the treadmill for 2 days before the exercise day. On the day of exercise, the mice ran on the treadmill with a fixed slope of 10%. Mice ran at 5 m/min for 5 min followed by 10 m/min for 10 min, 15 m/min for 15 min, and 20 m/min for 20 min. The speed was then increased by 2 m/min every 2 min until exhaustion was achieved. Exhaustion was defined as the inability of the animal to run on the treadmill for 10 s despite prodding. Immediately following exercise, animals were cervically dislocated before the removal of tissues. Following extraction, the quadriceps and gastrocnemius muscles were weighed and immediately frozen at −80°C for further biochemical analysis. The tibialis anterior muscles were taken and used for nuclear and cytosolic fractionation.
Plasmid DNA growth and isolation.
The TFEB promoter containing 1,200 or 1,600 bp of sequence was subcloned into a pGL3 vector containing a firefly luciferase reporter. Ampicillin-resistant bacteria were transformed, and bacterial colonies were then amplified to isolate plasmid DNA using a Qiagen plasmid isolation kit.
Transfection experiments.
Where indicated, the TFEB promoter containing either 1,200 or 1,600 bp upstream of the transcription start site, or the 2,190-bp PGC-1α promoter (47) and pRL-cytomegalovirus (CMV) vector as a normalization control, were transfected into C2C12 cells cultured in six-well plates. For transfection of the promoter sequence, C2C12 cells were grown as described previously, and the medium was switched to pretransfection medium (DMEM and 10% FBS) when the cells were at 30% confluence. The following day, myotubes were incubated with 2 μg/well of TFEB or PGC-1α promoter DNA and 10 μl of Lipofectamine 2000 for 6 h in 2 ml of DMEM. The medium was then changed back to DMEM supplemented with 5% HS and 1% P/S, and the cells were then differentiated, as described above. The differentiated cells were then subjected to electrical stimulation or kept as a control.
In vivo muscle transfection.
In vivo experiments were performed on 4-mo-old PGC-1α WT and KO mice. Mice were anesthetized using gaseous isoflurane. The lower hindlimbs were shaved and sterilized before injection of a TFEB promoter-reporter construct. The gastrocnemius muscles from the distal portion of the leg were injected with 25 µg of rTfeb-pGL3 and 1 µg of pRL-CMV using a short 29-gauge insulin syringe. Immediately after the injection, transcutaneous electrical pulses were applied using an electroporation system. The muscles were held on either side of the injection site by Tweezertrodes at the level of the skin, and a total of 10 pulses were delivered, with anode and cathode electrode orientation reversed with each pulse. The gastrocnemius of the left hindlimb was electrotransfected with an empty pGL3 vector, and that of the right hindlimb was electrotransfected with rTfeb-pGL3 vector. Following 7 days, animals were subjected to an exercise protocol.
Luciferase reporter assays.
Following treatments, cell extracts containing expressed luciferase enzyme were prepared using 1X passive lysis buffer supplemented with protease (cOmplete, no. 1169749801; Roche Diagnostics, Basel, Switzerland) and phosphatase inhibitors (cocktails 2 and 3, P5726 and P0044, respectively; Sigma). Luciferase activity was measured as an indicator of transcription using an EG&G Berthold (Lumat LB9507) luminometer, according to the manufacturer’s instructions. Renilla luciferase internal control was used to normalize for transfection efficiency. The ratio of firefly luciferase reporter to Renilla luciferase values was taken from both the TFEB-injected leg and the empty vector leg. The TFEB reporter value was then divided by the empty vector. This value was then quantified and graphed.
Nuclear and cytosolic fractionation.
NE-PER extraction reagents (no. 38835; Pierce, Thermo Scientific) were used to obtain cytoplasmic and nuclear fractions using modifications of the manufacturer's recommendations and differential centrifugation. In brief, to optimize the purity of the nuclear fraction, immediately after transferring the cytosolic fraction to a prelabeled tube, the remaining nuclear pellet was washed three times using PBS, with pelleting at 16,000 g. The nuclear extraction reagent NER was then added to the pellet, and three sonication steps (3 s each, on ice) were added to ensure nuclear disruption before the vortex steps of the manufacturer-recommended protocol.
Protein extraction.
Frozen tissues were pulverized into a powder and diluted 5X with extraction buffer containing phosphate and phosphatase inhibitors. Diluted samples were then rotated end over end at 4°C for 1 h, followed by sonication for 3 × 3 s at 30% of maximum power. Following sonication, the samples were centrifuged at 4°C for 10 min at 16,000 g.
Protein concentration.
The Bradford protein assay was used to determine the protein concentrations of samples. To standardize for concentrations, bovine serum albumin (2 mg/ml) was combined with double-distilled water and Sakamoto extraction buffer in tubes (35). Protein extracts were mixed with double-distilled water and analyzed compared with the standard curve using a Bio-Tek Synergy HT microplate reader.
Immunoblotting.
Extracted protein samples (50–100 µg) from quadriceps or gastrocnemius muscles, or from fractionated nucleus and cytosol samples, were separated using 10–15% sodium dodecyl sulfate-polyacrylamide gel electrophoresis at 120 V for 90 min. Once the gel had run the desired duration, proteins were electroblotted onto a nitrocellulose membrane. After transfer, the membrane was stained with Ponceau Red, cut at the required molecular weights, and subsequently blocked in 5% milk for 1 h to prevent any nonspecific binding. Primary antibodies (Table 1) were incubated at 4°C overnight. The next day the blots were washed in wash buffer 3 × 5 min each and subsequently incubated for 1 h at room temperature with their specific secondary antibody before being washed again 3 × 5 min each. Detection of the bands was revealed using enhanced chemiluminescence. Films were scanned and analyzed using ImageJ software.
Table 1.
List of antibodies used
| Antibody | Manufacturer | Reference No. | Lot No. |
|---|---|---|---|
| α-Tubulin | Calbiochem (Millipore) | CP06 | D00175772 |
| Aciculin | In house | ||
| AMPK (T) | Cell Signaling Technology | 2532S | 4 |
| AMPK (p) | Cell Signaling Technology | 2535S | 16 |
| CaMK-II (p) | Cell Signaling Technology | 3361S | 5 |
| GAPDH | Abcam | AB8245 | GR232049-10 |
| H2B | Cell Signaling Technology | 2934S | 4 |
| mTOR (T) | Cell Signaling Technology | 2972S | 9 |
| mTOR (p) | Cell Signaling Technology | 2971S | 18 |
| p44 (T) (ERK) | Cell Signaling Technology | 9102S | 11 |
| p44 (p) (ERK) | Cell Signaling Technology | 9106S | 27 |
| PGC-1α | Millipore | AB3243 | 2757199 |
| TFEB | MyBioSource | MBS120432 | 319C2A-3 |
| YY1 | Santa Cruz Biotechnology | SC7341 | L0208 |
T, total; p, phosphorylated; H2B, histone H2B; mTOR, mammalian/mechanistic target of rapamycin; PGC-1α, peroxisome proliferator-activated receptor-γ coactivator-1α; TFEB, transcription factor EB; YY1, yin yang 1.
RNA isolation and reverse transcription.
Total RNA was isolated from frozen, whole muscle quadriceps powders as described previously (32). Briefly, tissue powder (~70 mg) was added to TRIzol reagent, homogenized, and then mixed with chloroform. Samples were centrifuged at 4°C at 16,000 g for 15 min, and the upper aqueous phase of the sample was transferred into a new tube along with isopropanol and left overnight at −20°C to precipitate. Samples were once again centrifuged at 4°C at 16,000 g for 10 min. The resultant supernatant was discarded, and the pellet was resuspended in 30 μl of molecular-grade sterile H2O (Wisent Bio Products, Saint-Jean-Baptiste, QC, Canada). The concentration and purity of the RNA were measured using a NanoDrop 2000 spectrophotometer. SuperScript III reverse transcriptase (Invitrogen, Carlsbad, CA) was used to reverse transcribe 1.5 μg of total RNA into cDNA.
Real-time PCR.
Using sequences from GenBank, primers were designed with Primer3 v.0.4.0 software (Massachusetts Institute of Technology, Cambridge, MA) for genes of interest (Table 2). Primer specificity was confirmed by OligoAnalyzer 3.1 (Integrated DNA Technologies, Toronto, ON, Canada). Expression of mRNA was measured with SYBR Green chemistry (PerfeCTa SYBR Green SuperMix; ROX, Quanta BioSciences, Gaithersburg, MD). Each well contained SYBR Green SuperMix, forward and reverse primers (20 μM), sterile water, and 10 ng of cDNA. The detection of all real-time PCR amplification took place in a 96-well plate using a StepOnePlus real-time PCR system (Applied Biosystems, Foster City, CA). The final reaction volume of each well was 25 μl. Samples were run in duplicates to ensure accuracy. The PCR program consisted of an initial holding stage (95°C for 10 min), followed by 40 amplification cycles (60°C for 1 min and 95°C for 15 s), and was completed with a final melting stage (95°C for 15 s, 60°C for 1 min, and 95°C for 15 s). Nonspecific amplification and primer dimers were controlled for by the analysis of melt curves generated by the instrument for SYBR Green analyses. Negative control wells contained water in place of cDNA.
Table 2.
List of primers used
| Gene | Forward Primer | Reverse Primer |
|---|---|---|
| Actb | 5′-TGTGACGTTGACATCCGTAA-3′ | 5′-GCTAGGAGCCAGAGCAGTAA-3′ |
| Becn1 | 5′-AGGCTGAGGCGGAGAGATT-3′ | 5′-TCCACACTCTTGAGTTCGTCAT-3′ |
| Catsd | 5′-TTTGCCAATGCTGTCGTACT-3′ | 5′-AGCGAGTGTGACTATGTGTGAG-3′ |
| Coxi | 5′-CTAGCCGCAGGCATTACTAT-3′ | 5′-TGCCCAAAGAATCAGAACA-3′ |
| Coxiv | 5′-CTCCAACGAATGGAAGACAG-3′ | 5′-TGACAACCTTCTTAGGGAAC-3′ |
| Egr1 | 5′-GCCCTTCCAGTGTCGAATCT-3′ | 5′-GGCAAACTTCCTCCCACAAAT-3′ |
| Gapdh | 5′-AACACTGAGCATCTCCCTCA-3′ | 5′-GTGGGTGCAGCGAACTTTAT-3′ |
| Hspa (Hsp70) | 5′-TGGCTATTACTGCGGGTTCT-3′ | 5′-CATCTGCTCCACCTCCTCT-3′ |
| Lamp1 | 5′-CTAGTGGGAGTTGCGGTATCA-3′ | 5′-AGGGCATCAGGAAGAGTCATAT-3′ |
| Lamp2 | 5′-GCTGAACAACAGCCAAATTA-3′ | 5′-CTGAGCCATTAGCCAAATACAT-3′ |
| Ppargc1a (PGC-1α) | 5′-TTCCACCAAGAGCAAGTAT-3′ | 5′-CGCTGTCCCATGAGGTATT-3′ |
| Sqstm1 (p62) | 5′-TGTGGTGGGAACTCGCTATAA-3′ | 5′-CAGCGGCTATGAGAGAAGCTAT-3′ |
| Tfam | 5′-GAAGGGAATGGGAAAGGTAGA-3′ | 5′-AACAGGACATGGAAAGCAGAT-3′ |
| Tfeb | 5′-AGCTCCAACCCGAGAAAGAGTTTG-3′ | 5′-CGTTCAGGTGGCTGCTAGAC-3′ |
Hsp70, 70-kDa heat shock protein; PGC-1α, peroxisome proliferator-activated receptor-γ coactivator-1α; p62, nucleoporin p62.
Real-time quantitative PCR quantification.
First, the threshold cycle (CT) number of the endogenous reference gene was subtracted from the CT number of the target gene [ΔCT = CT(target) − CT(reference)]. Next, the ΔCT value of the control tissue was subtracted from the ΔCT value of the experimental tissue [ΔΔCT = ΔCT(experimental) − ΔCT(control)]. Results were reported as fold changes using the ΔΔCT method, calculated as 2−ΔΔCT. Primers detecting β-actin along with glyceraldehyde-3-phosphate dehydrogenase (GAPDH) were chosen as endogenous reference genes.
Statistical analyses.
The data obtained were graphed using GraphPad 4.0 software and expressed as means ± SE. The data were analyzed using Student’s t-test for two-group comparisons (e.g., WT vs. KO), one-way ANOVA for three-group comparisons (e.g., control, acute, and acute+recovery), or two-way ANOVA for >3 groups (e.g., WT control, WT exercise vs. KO control, KO exercise), as appropriate. Tukey’s post hoc procedures were used. All values are represented as means ± SE.
RESULTS
Exercise-responsive kinases are activated by acute contractile activity in C2C12 myotubes.
We first verified the effect of our cell culture stimulation protocols to induce typical exercise-activated signaling pathways in contracting myotubes. Our results indicate that acute contractile activity of myotubes was sufficient to activate kinases known to significantly increase following exercise. Phosphorylation of p44 (ERK1), CaMK, and AMPK increased 3-, 1.8-, and 1.9-fold, respectively (P < 0.05), compared with control cells, immediately after 2 h of stimulation. Phosphorylation levels returned to control levels following 2 h of recovery (Fig. 1, A–C).
Fig. 1.

Acute contractile activity induces the phosphorylation of kinases, transcription factor EB (TFEB) promoter activity, and autophagy markers. C2C12 myotubes were subjected to 2 h of acute stimulation followed by a 2-h recovery. The 2-h treatment was successful in inducing the phosphorylation (p) of kinases p44 (A), AMPK (B), and CaMK (C) (n = 3–7). Data are expressed in arbitrary units (A.U; *P < 0.05 control vs. acute, 1-way ANOVA). Cells transfected with TFEB 1,600-bp promoter were subjected to 4 h of starvation with HBSS (D) or 2 h of acute stimulation and 2 h of recovery (E). F: cells transfected with the peroxisome proliferator-activated receptor-γ coactivator-1α (PGC-1α) promoter were subjected to 2 h of acute stimulation and 2 h of recovery. Graphs represent luciferase activity, fold over pGL3-Basic empty vector (n = 3–6; #P < 0.01 control vs. starved, Student’s t-test; *P < 0.05 control vs. acute, 1-way ANOVA). Con, control; A, acute; A+R, acute+recovery; R.L.U, relative light units. G: real-time PCR analysis of mRNA in control cells, following 5 h of acute stimulation, and with acute stimulation and recovery. Transcript levels were normalized to both β-actin and GAPDH (n = 3–6; *P < 0.05 control vs. acute, **P < 0.01 control vs. acute+recovery; 1-way ANOVA on 3 conditions per transcript). LC3, microtubule-associated proteins-1A/1B light chain 3A.
TFEB transcription is increased by contractile activity.
As a positive control, we used serum starvation to compare with the effect of contractile activity on TFEB transcription. Similar to the documented literature, serum starvation for 4 or 6 h increased the luciferase activity of the 1,600-bp TFEB promoter by 3.1-fold compared with control myotubes (Fig. 1D). In response to acute contractile activity, the activity of the 1,600-bp TFEB promoter increased by threefold following 2 h of contractile activity (Fig. 1E). This effect was not observed with the 1,200-bp TFEB promoter (data not shown), indicating that contractile activity activates a specific response element(s) within a 400-bp promoter between 1,200 and 1,600 bp upstream of the transcription start site. This increase in promoter activity was greater than the 1.8-fold increase demonstrated in the PGC-1α promoter, which we have shown to increase previously in response to contractile activity (47; Fig. 1F; P < 0.05). Acute contractile activity and recovery also resulted in a trend to increase TFEB mRNA. Levels of p62 mRNA increased significantly following acute contractile activity and increased further following recovery, while LC3 mRNA levels were not affected (Fig. 1G).
TFEB is localized to the nucleus in myotubes during acute contractile activity.
To examine TFEB localization, we also compared the effect of contractile activity to serum starvation. TFEB translocation to the nucleus was increased by >2 fold by starvation (Fig. 2A), and more moderately by contractile activity (Fig. 2B). This translocation was reversible during the recovery phase and inhibited by cyclosporin A, suggesting a role for calcineurin phosphatase activity in determining TFEB localization (Fig. 2B).
Fig. 2.
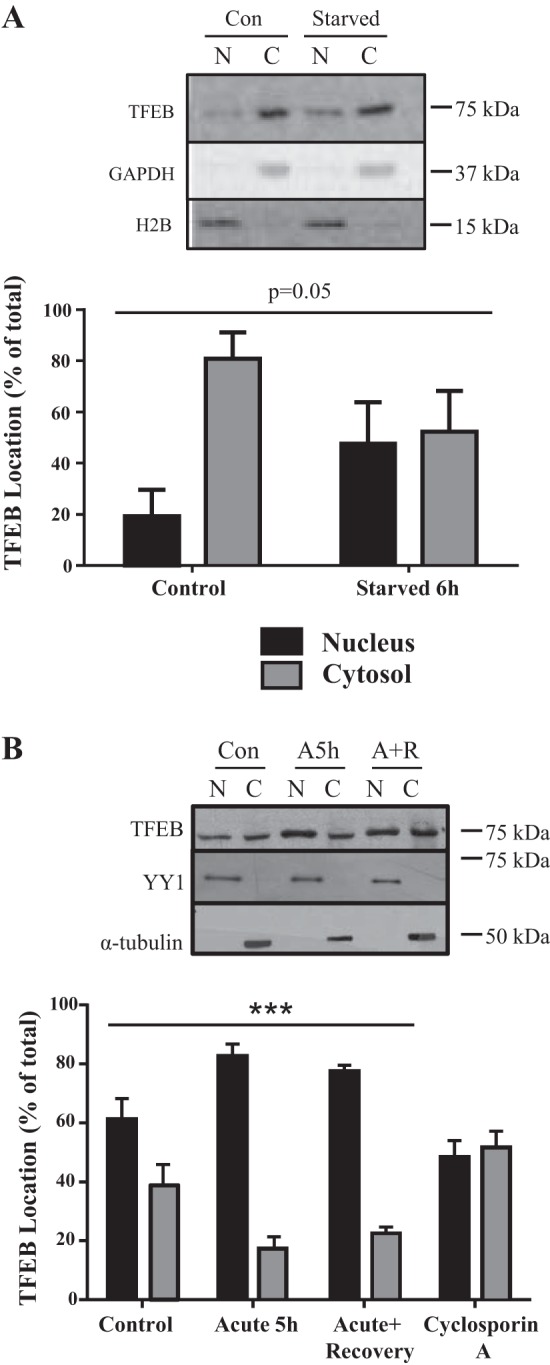
Transcription factor EB (TFEB) localization. The localization of TFEB protein following 6 h of serum starvation (A) or 5 h of stimulation and recovery (B). Black bars represent nuclear TFEB content, and gray bars represent cytosolic TFEB content. Above the graphs are representative Western blots. Yin yang 1 (YY1) or histone H2B and α-tubulin or GAPDH were used as nuclear and cytosolic loading controls, respectively (n = 4–5; P = 0.05, significant interaction effect on TFEB localization; ***P < 0.001, effect of stimulation on TFEB localization; 2-way ANOVA). Con, control; A5h, acute 5 h; A+R, acute+recovery; N, nuclear; C, cytosolic.
TFEB overexpression drives the expression of autophagy genes and PGC-1α.
To further examine the role of TFEB in muscle cells, adenoviral infection was utilized to overexpress the protein. Seven days of viral infection revealed a marked escalation of TFEB protein content, as expected, compared with GFP-infected cells (Fig. 3A). TFEB overexpression also produced significant increases in TFEB mRNA, as well as in the autophagy markers LC3, LAMP2, and p62 (P < 0.05; Fig. 3B), confirming that these gene products are downstream targets of TFEB in muscle cells. In TFEB-overexpressing cells, the mRNA levels of mitochondrial biogenesis marker PGC-1α were also significantly increased by fivefold to sixfold (P < 0.05; Fig. 3C). Cytochrome-c oxidase-IV (COXIV) also showed a trend for increase, suggesting that TFEB can potentially drive mitochondrial biogenesis in muscle, as documented recently (26).
Fig. 3.
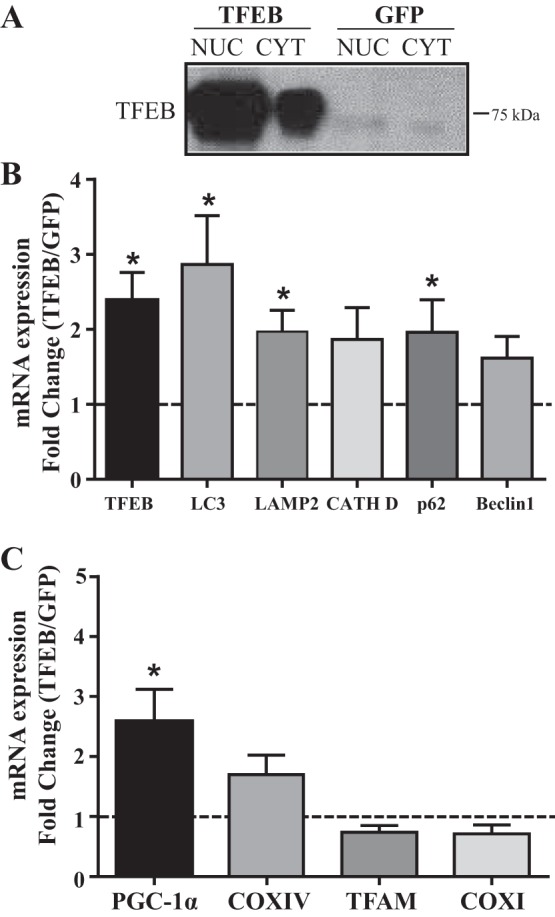
Effect of transcription factor EB (TFEB) overexpression in myotubes. Real-time PCR analysis of mRNA from cells overexpressing adenoviral TFEB. A: Western blot indicating successful overexpression of TFEB. Effect of TFEB overexpression on autophagy mRNA markers (B) and mitochondrial biogenesis mRNA level (C). Transcript levels are normalized to both β-actin and GAPDH (n = 3–6; *P < 0.05 mock green fluorescent protein (GFP) vs. TFEB overexpression; Student’s t-test on GFP vs. TFEB overexpression on raw data). NUC, nuclear; CYT, cytosolic; LC3, microtubule-associated proteins-1A/1B light chain 3A; LAMP2, lysosomal associated membrane protein-2; CATH D, cathepsin D; PGC-1α, peroxisome proliferator-activated receptor-γ coactivator-1α; COX, cytochrome-c oxidase; TFAM, mitochondrial transcription factor A.
Mitophagy signaling is activated by acute contractile activity in C2C12 cells.
Using fluorescence microscopy, we observed a distinct increase in the colocalization of the mitochondrial outer membrane protein VDAC with autophagy adapter protein p62, revealed as yellow costaining, following 5 h of stimulation compared with control cells (Fig. 4). These data suggest that acute contractile activity induces an increase in mitophagy signaling, similar to observations in vivo (51).
Fig. 4.

Mitophagy signaling following acute contractile activity and recovery. Fixed-cell immunofluorescence microscopy of C2C12 myotubes costained for 4′,6-diamidino-2-phenylindole (DAPI), voltage-dependent anion channel (VDAC), and nucleoporin p62 (p62) (×20 magnification). Fully differentiated myotubes were acutely stimulated for 5 h or not simulated (control) cells. Following 5 h of stimulation, there was an increase in yellow colocalization of p62 and VDAC (merge).
PGC-1α is a determinant of TFEB protein levels and the gene expression response to exercise.
To confirm the effect of contractile activity observed in cell culture using an in vivo approach, we examined the effect of exercise on TFEB expression and localization. In addition, because of the apparent close relationship between TFEB and PGC-1α expression (26, 51), we examined the effect of exercise in PGC-1α knockout (KO) and WT mice. Under basal conditions, TFEB protein content was reduced by 30% in KO mice compared with their WT counterparts. Similarly, the TFEB family member transcription factor E3 (TFE3) was also reduced by 50% in KO animals (Fig. 5, A and B).
Fig. 5.

Effect of peroxisome proliferator-activated receptor-γ coactivator-1α (PGC-1α) and in vivo exercise on gene expression and transcription factor EB (TFEB) protein. A: Western blots of TFEB and its family member transcription factor E3 (TFE3) in wild-type (WT) and PGC-1α knockout (KO) mice. Aciculin was used as a loading control. B: corresponding graph of quantified blots (n = 7–9; *P < 0.05 WT vs. KO; Student’s t-test on raw data). C: WT and PGC-1α KO animals were subjected to an exhaustive bout of exercise. Lactate levels were measured before (Pre-Ex) and after exercise (Post-Ex) (n = 9; ***P < 0.001 preexercise vs. postexercise; #P < 0.05 WT vs. KO postexercise; 2-way ANOVA). mRNA levels of early response genes and mitochondrial markers. D: PGC-1α (exercise vs. nonexercise in WT mice only). mRNA levels in WT and PGC-1α KO mice before and after an acute bout of exercise. E: early growth response protein-1 (Egr1; *P < 0.001, exercise vs. control in both genotypes; 2-way ANOVA). F: cytochrome-c oxidase-I (COXI; n = 6–7; *P < 0.05, 2-way ANOVA produced a main effect of exercise; #P < 0.05, 2-way ANOVA produced a main effect of genotype). Gapdh and Actb were used as housekeeping genes. A.U, arbitrary units.
In response to acute, incremental, treadmill running, PGC-1α KO mice produced 50% higher levels of lactate compared with WT littermates (Fig. 5C). This was accompanied by a marked 60% reduction in endurance capacity of the PGC-1α KO mice compared with WT animals that ran >1,100 m during the exercise test. To examine the effectiveness of our exercise protocol in altering gene expression, we measured the mRNA levels of PGC-1α and the early response gene early growth response protein-1 (Egr1), as well as that of mitochondrial marker COXI. As expected from the results from previous work (51), PGC-1α mRNA levels tended to increase in WT mice immediately following the acute exercise (Fig. 5D). Exercise markedly increased Egr1 expression in WT and KO mice by 18- and 12-fold, respectively (P < 0.05; Fig. 5E), consistent with a role for Egr1 as an early response gene. Under basal, nonexercise conditions, levels of COXI mRNA, the mitochondrially encoded subunit of complex IV, were reduced by 47% in KO mice compared with WT counterparts, as anticipated. In both the WT and KO mice, COX mRNA levels were elevated by 33–38% (P < 0.05) following exercise; however, levels in KO mice were significantly lower than in the WT animals (Fig. 5F).
TFEB localization to the nucleus following exercise is dependent on PGC-1α.
To evaluate the localization of TFEB, the muscles of PGC-1α KO and WT mice were separated into nuclear and cytosolic fractions. TFEB nuclear localization did not differ significantly between WT and KO animals in resting muscle. However, exercise induced a fourfold increase (P < 0.05) in the translocation of TFEB to the nucleus following an acute bout of exercise in WT animals. This response was not observed in the KO mice (Fig. 6, A and B). TFEB phosphorylation by mTOR is known to sequester the protein in the cytosol and render it inactive (29). Basal mTOR phosphorylation on Ser2448 did not differ between WT and KO animals. While exercise did not increase mTORs2448 phosphorylation in the WT mice, a 1.6-fold increase (P < 0.05) was evident following exercise in KO animals (Fig. 6C).
Fig. 6.
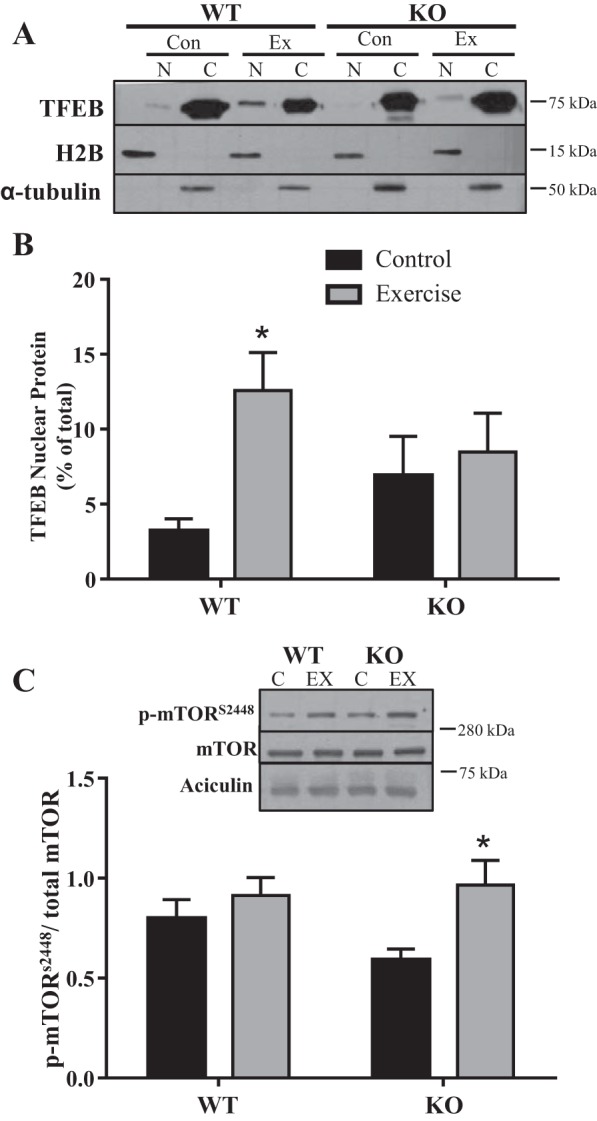
Transcription factor EB (TFEB) localization and activation. TFEB translocation into the nucleus was measured in wild-type (WT) and peroxisome proliferator-activated receptor-γ coactivator-1α (PGC-1α) knockout (KO) mice following acute exercise. Typical blot (A) and quantification of TFEB expressed as a percentage of total [cytosolic (C) and nuclear (N)] signals (B). Histone H2B and α-tubulin were used as nuclear and cytosolic purity controls (n = 7–9; *P < 0.05 WT control vs. WT exercise, 2-way ANOVA). C: mammalian/mechanistic target of rapamycin (mTOR) activation was measured by Ser2448 phosphorylation (p). Aciculin was used as a loading control (n = 7–9; *P < 0.05 KO control vs. KO exercise; 2-way ANOVA). C, control; EX, exercise.
TFEB transcription is increased by exercise in vivo.
To determine whether TFEB transcription was increased following an acute bout of exercise and whether this was dependent on PGC-1α, we used a TFEB promoter-reporter assay. TFEB promoter activity did not differ between WT and PGC-1α KO animals basally. In the WT mice, promoter activity was increased 2.4-fold (P < 0.05) following exercise. This response was completely attenuated in KO animals (Fig. 7A). TFEB mRNA levels were not altered following exercise in both WT and KO animals (Fig. 7B). This is consistent with our previous finding (51) that TFEB mRNA requires a more prolonged recovery period to exhibit an increase following exercise. We then used immunoblotting of nuclear and cytosolic samples to investigate the levels of PGC-1α translocation to the nucleus following exercise. Nuclear PGC-1α content increased from 35% of total before exercise to 47% (P < 0.05) following exercise in WT mice (Fig. 7C).
Fig. 7.
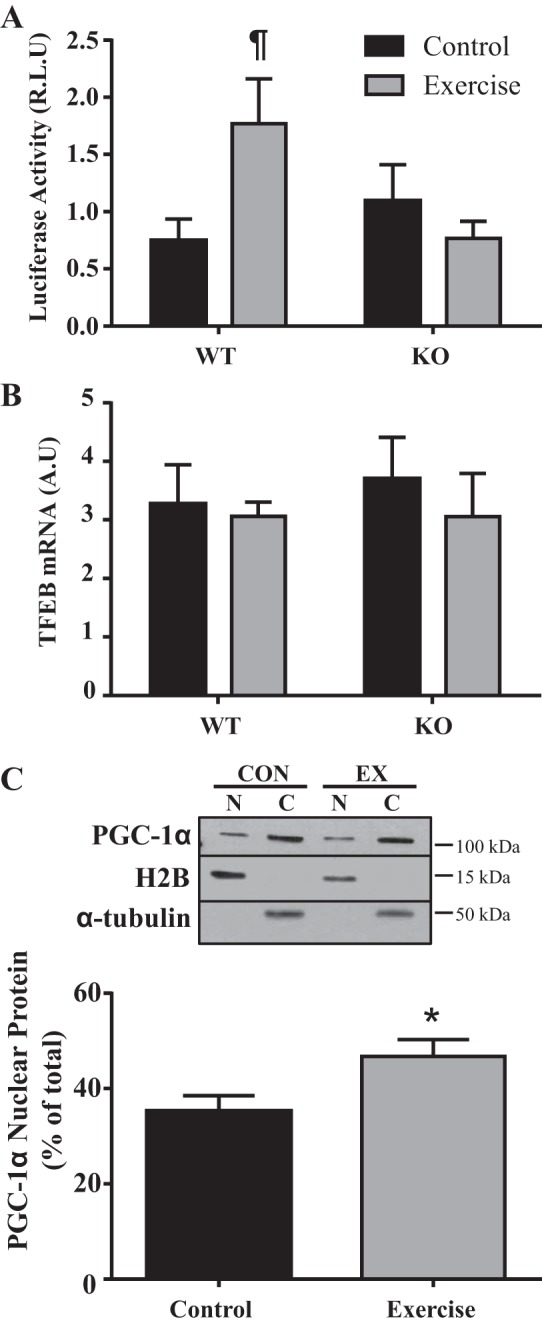
Transcription factor EB (TFEB) transcription with exercise in vivo. TFEB transcription was analyzed in wild-type (WT) and peroxisome proliferator-activated receptor-γ coactivator-1α (PGC-1α) knockout (KO) mice following an acute bout of exercise. A: TFEB transcription measured as luciferase activity (n = 7–9; ¶P < 0.05, interaction effect indicating increase with exercise only in WT animals; 2-way ANOVA). R.L.U, relative light units. B: mRNA levels of TFEB in WT and PGC-1α KO mice before and after an acute bout of exercise. Gapdh and Actb were used as housekeeping genes (n = 6–7). A.U, arbitrary units. C: PGC-1α translocation to the nucleus following exercise was measured in WT mice. PGC-1α nuclear content as a percentage of total [cytosolic (C) and nuclear (N)] signals. Histone H2B and α-tubulin were used as nuclear and cytosolic purity controls (n = 7–9, *P < 0.05 WT control vs. WT exercise; Student’s t-test). CON, control; EX, exercise.
DISCUSSION
A healthy mitochondrial pool is essential for cellular homeostasis. This requires the coordination of mitochondrial biogenesis, along with mitochondrial-specific autophagy, or mitophagy (15, 21, 34). Mitochondrial biogenesis occurs in response to environmental stressors such as exercise and involves the expansion of the mitochondrial network to augment mitochondrial content and quality (7, 9, 16, 48). This process is controlled largely by PGC-1α, a transcriptional coactivator coordinating the expression of nuclear genes encoding mitochondrial proteins (NuGEMPS; 1, 14, 39). Under steady-state conditions, the synthesis of new mitochondria is accompanied by the degradation of dysfunctional organelles through the process of mitophagy. Mitophagy is coordinated by TFEB (43, 44, 46), which transcribes lysosomal genes, along with other autophagy-related genes involved in autophagosome formation and cargo recognition (29, 43). However, little is known about the effect of exercise on TFEB transcription, expression, and localization. One study found that exercise promoted TFEB nuclear translocation, a process that was inhibited by cyclosporin A, suggesting the involvement of calcineurin-mediated TFEB dephosphorylation for its nuclear translocation (29). Mansueto et al. (26) confirmed this nuclear localization in vivo using acute exhaustive exercise. In addition, they found that mice lacking TFEB were exercise intolerant, while muscle specific-activation of TFEB enhanced physical performance. Interestingly, their data demonstrated that this may be mediated by a previously unforeseen function of TFEB, the stimulation of mitochondrial biogenesis.
We have successfully employed our cell culture model of contractile activity to study both acute signaling and mRNA responses (17, 30), as well as the chronic adaptive changes in mitochondrial content and respiration (30, 47) to exercise. In this study, acute contractile activity of myotubes was sufficient to activate kinases such as AMPK and CaMK, which are known to significantly increase following exercise. In addition, we demonstrated that TFEB mRNA was significantly increased with 2 h of acute contractile activity and recovery. Our in vivo acute exercise protocol was also successful in inducing changes in gene expression, as it elevated the mRNA levels of early response genes and mitochondrial markers, as previously demonstrated (36, 51). Exercise and/or contractile activity have also been shown to be effective activators of PGC-1α promoter activity, demonstrated following electrical stimulation in cell culture models, as well as after an acute bout of exercise in mice (2, 36, 37, 55). These data support the idea that mitochondrial biogenesis signaling toward the expression of NuGEMPS is initiated by a single bout of exercise.
Our results, acquired both in contracting myotubes and in in vivo muscle, suggest that the increase in TFEB expression is a key component that drives mitochondrial biogenesis initiated by exercise. First, TFEB transcription is increased by exercise. A trend to increase TFEB mRNA was also observed, and this is most likely fully manifest during a more prolonged recovery period, as expected, and as shown previously by experiments in vivo (51). This increase in transcription was evident in the 1,600-bp construct, but not the 1,200-bp proximal TFEB promoter. This reveals a 400-bp DNA region that needs to be investigated in future studies to examine the “exercise-responsive” promoter region. Interestingly, this 1,600-bp region was also responsive to serum starvation, a stimulus that has previously been shown to increase TFEB transcription (29, 42, 46). This suggests that TFEB transcription is responsive to stimuli in which energy balance is disturbed, when a deficit is produced by increased energy demand (i.e., exercise) or decreased energy supply (i.e., starvation). Both contractile activity and exercise promoted TFEB translocation to the nucleus, as reported by others (26, 42). In myotubes, this translocation was inhibited by cyclosporin A. This drug has at least two known inhibitory effects, on mitochondrial permeability transition pore opening, as well as calcineurin phosphatase activity. However, since 1) calcineurin has been implicated in TFEB translocation previously (29), 2) Ca2+ is released from the sarcoplasmic reticulum during each contraction cycle, and 3) calcineurin is activated during exercise (4, 27, 53), our interpretation is that TFEB translocation into the nucleus is mediated, in part, via calcineurin as a result of contractile activity. This translocation is also likely to have a direct effect on exercise-induced expression of NuGEMPS, as we have shown that TFEB can increase the expression of PGC-1α, a known driver of mitochondrial biogenesis (Fig. 3). This is supported by the recent data of Mansueto et al. (26). As predicted, TFEB overexpression also resulted in the upregulation of mRNAs encoding the autophagy markers LC3, LAMP2, and p62 (43). Thus, in addition to PGC-1α, TFEB has emerged as an important exercise-induced regulator of mitochondrial biogenesis, alongside its already established function in the expression of genes involved in autophagy and lysosomal systems of protein quality control (29).
As noted above, PGC-1α is a known regulator of mitochondrial content in a variety of tissues, including muscle (1, 11, 23). The absence of PGC-1α leads to reduced endurance performance (3), while its overexpression enhances maximal oxygen consumption, endurance, and the metabolism of lipids (5, 6). Our data suggest that these deficits are accompanied by elevated lactate levels following exercise and reduced endurance capacity, represented by decreases in distance run to exhaustion in KO animals. Recent work has also discovered an emerging role for PGC-1α in mitophagy and lysosomal biogenesis following exercise, strengthening the significance of the coactivator in the regulation of mitochondrial turnover (40, 49). These recent results have led us to investigate the interplay between PGC-1α and TFEB. We have shown that PGC-1α expression parallels directly the level of TFEB, using both loss- and gain-of-function mouse models (49, 51). In addition, both TFEB and PGC-1α are coordinately induced by chronic contractile activity (20). These data suggest that PGC-1α could mediate the response of TFEB to exercise. Thus, in this study we sought to more fully develop an understanding of the regulation of TFEB expression and the role of PGC-1α in this process.
Our data provide insight into the basis for the close relationship between TFEB and PGC-1α. First, the exercise-induced twofold to threefold increases in TFEB transcription were abolished in PGC-1α KO animals. Exercise normally increases PGC-1α translocation as an early event (54; Fig. 7), and the absence of the coactivator is the likely reason for the impaired TFEB transcription in the KO mice. Second, TFEB translocation from the cytosol to the nucleus was impaired in the absence of PGC-1α. This impaired translocation may have been facilitated, in part, by the exercise-induced increase in the Ser2448 phosphorylation of mTOR in KO animals. As a downstream target of mTOR, TFEB is retained in the cytosol and inactivated by mTOR-mediated TFEB phosphorylation (19, 28, 44).
Corresponding with the expression and translocation of TFEB as a result of exercise, our data also provide further support for the mounting evidence that supports the activation of mitophagy signaling following a bout of exercise (12, 51). These data suggest that the multiple signals (e.g., Fig. 1) generated during contractile activity 1) promote mitophagy signaling of a fraction of the existing mitochondrial pool and 2) activate TFEB to initiate the transcription of the lysosomal and autophagy machinery necessary to maintain autophagy flux during subsequent exercise stress. The induction of TFEB and its activation are dependent on a PGC-1α, documenting the importance of these transcriptional regulators for the maintenance of mitochondrial turnover in exercising skeletal muscle.
GRANTS
This research was supported by a Natural Sciences and Engineering Research Council of Canada Discovery grant to D. A. Hood. D. A. Hood is the holder of a Canada Research Chair in Cell Physiology.
DISCLOSURES
No conflicts of interest, financial or otherwise, are declared by the authors.
AUTHOR CONTRIBUTIONS
A.T.E. and D.A.H. conceived and designed research; A.T.E., D.M.B., and K.B. performed experiments; A.T.E., D.M.B., and D.A.H. analyzed data; A.T.E., D.M.B., and D.A.H. interpreted results of experiments; A.T.E. and D.M.B. prepared figures; A.T.E. and D.M.B. drafted manuscript; A.T.E. and D.A.H. edited and revised manuscript; A.T.E. and D.A.H. approved final version of manuscript.
REFERENCES
- 1.Adhihetty PJ, Uguccioni G, Leick L, Hidalgo J, Pilegaard H, Hood DA. The role of PGC-1α on mitochondrial function and apoptotic susceptibility in muscle. Am J Physiol Cell Physiol 297: C217–C225, 2009. doi: 10.1152/ajpcell.00070.2009. [DOI] [PubMed] [Google Scholar]
- 2.Akimoto T, Pohnert SC, Li P, Zhang M, Gumbs C, Rosenberg PB, Williams RS, Yan Z. Exercise stimulates Pgc-1α transcription in skeletal muscle through activation of the p38 MAPK pathway. J Biol Chem 280: 19587–19593, 2005. doi: 10.1074/jbc.M408862200. [DOI] [PubMed] [Google Scholar]
- 3.Baar K, Wende AR, Jones TE, Marison M, Nolte LA, Chen M, Kelly DP, Holloszy JO. Adaptations of skeletal muscle to exercise: rapid increase in the transcriptional coactivator PGC-1. FASEB J 16: 1879–1886, 2002. doi: 10.1096/fj.02-0367com. [DOI] [PubMed] [Google Scholar]
- 4.Brookes PS, Yoon Y, Robotham JL, Anders MW, Sheu SS. Calcium, ATP, and ROS: a mitochondrial love-hate triangle. Am J Physiol Cell Physiol 287: C817–C833, 2004. doi: 10.1152/ajpcell.00139.2004. [DOI] [PubMed] [Google Scholar]
- 5.Calvo JA, Daniels TG, Wang X, Paul A, Lin J, Spiegelman BM, Stevenson SC, Rangwala SM. Muscle-specific expression of PPARγ coactivator-1α improves exercise performance and increases peak oxygen uptake. J Appl Physiol (1985) 104: 1304–1312, 2008. doi: 10.1152/japplphysiol.01231.2007. [DOI] [PubMed] [Google Scholar]
- 6.Choi CS, Befroy DE, Codella R, Kim S, Reznick RM, Hwang YJ, Liu ZX, Lee HY, Distefano A, Samuel VT, Zhang D, Cline GW, Handschin C, Lin J, Petersen KF, Spiegelman BM, Shulman GI. Paradoxical effects of increased expression of PGC-1α on muscle mitochondrial function and insulin-stimulated muscle glucose metabolism. Proc Natl Acad Sci USA 105: 19926–19931, 2008. doi: 10.1073/pnas.0810339105. [DOI] [PMC free article] [PubMed] [Google Scholar]
- 7.Collu-Marchese M, Shuen M, Pauly M, Saleem A, Hood DA. The regulation of mitochondrial transcription factor A (Tfam) expression during skeletal muscle cell differentiation. Biosci Rep 35: e00221, 2015. doi: 10.1042/BSR20150073. [DOI] [PMC free article] [PubMed] [Google Scholar]
- 8.Connor MK, Irrcher I, Hood DA. Contractile activity-induced transcriptional activation of cytochrome C involves Sp1 and is proportional to mitochondrial ATP synthesis in C2C12 muscle cells. J Biol Chem 276: 15898–15904, 2001. doi: 10.1074/jbc.M100272200. [DOI] [PubMed] [Google Scholar]
- 8a.Ding WX, Yin XM. Mitophagy: mechanisms, pathophysiological roles, and analysis. Biol Chem 393: 547–564, 2012. doi: 10.1515/hsz-2012-0119. [DOI] [PMC free article] [PubMed] [Google Scholar]
- 9.Fernandez-Marcos PJ, Auwerx J. Regulation of PGC-1α, a nodal regulator of mitochondrial biogenesis. Am J Clin Nutr 93: 884S–890S, 2011. doi: 10.3945/ajcn.110.001917. [DOI] [PMC free article] [PubMed] [Google Scholar]
- 11.Handschin C. Regulation of skeletal muscle cell plasticity by the peroxisome proliferator-activated receptor γ coactivator 1α. J Recept Signal Transduct Res 30: 376–384, 2010. doi: 10.3109/10799891003641074. [DOI] [PubMed] [Google Scholar]
- 12.He C, Bassik MC, Moresi V, Sun K, Wei Y, Zou Z, An Z, Loh J, Fisher J, Sun Q, Korsmeyer S, Packer M, May HI, Hill JA, Virgin HW, Gilpin C, Xiao G, Bassel-Duby R, Scherer PE, Levine B. Exercise-induced BCL2-regulated autophagy is required for muscle glucose homeostasis. Nature 481: 511–515, 2012. doi: 10.1038/nature10758. [DOI] [PMC free article] [PubMed] [Google Scholar]
- 13.Hepple RT. Mitochondrial involvement and impact in aging skeletal muscle. Front Aging Neurosci 6: 211, 2014. doi: 10.3389/fnagi.2014.00211. [DOI] [PMC free article] [PubMed] [Google Scholar]
- 14.Hood DA, Irrcher I, Ljubicic V, Joseph AM. Coordination of metabolic plasticity in skeletal muscle. J Exp Biol 209: 2265–2275, 2006. doi: 10.1242/jeb.02182. [DOI] [PubMed] [Google Scholar]
- 15.Hood DA, Tryon LD, Vainshtein A, Memme J, Chen C, Pauly M, Crilly MJ, Carter H. Exercise and the regulation of mitochondrial turnover. Prog Mol Biol Transl Sci 135: 99–127, 2015. doi: 10.1016/bs.pmbts.2015.07.007. [DOI] [PubMed] [Google Scholar]
- 16.Hood DA, Uguccioni G, Vainshtein A, D’souza D. Mechanisms of exercise-induced mitochondrial biogenesis in skeletal muscle: implications for health and disease. Compr Physiol 1: 1119–1134, 2011. doi: 10.1002/cphy.c100074. [DOI] [PubMed] [Google Scholar]
- 17.Irrcher I, Hood DA. Regulation of Egr-1, SRF, and Sp1 mRNA expression in contracting skeletal muscle cells. J Appl Physiol (1985) 97: 2207–2213, 2004. doi: 10.1152/japplphysiol.00388.2004. [DOI] [PubMed] [Google Scholar]
- 18.Ivankovic D, Chau KY, Schapira AH, Gegg ME. Mitochondrial and lysosomal biogenesis are activated following PINK1/parkin-mediated mitophagy. J Neurochem 136: 388–402, 2016. doi: 10.1111/jnc.13412. [DOI] [PMC free article] [PubMed] [Google Scholar]
- 19.Jung CH, Ro SH, Cao J, Otto NM, Kim DH. mTOR regulation of autophagy. FEBS Lett 584: 1287–1295, 2010. doi: 10.1016/j.febslet.2010.01.017. [DOI] [PMC free article] [PubMed] [Google Scholar]
- 20.Kim Y, Hood DA. Regulation of the autophagy system during chronic contractile activity-induced muscle adaptations. Physiol Rep 5: e13307, 2017. doi: 10.14814/phy2.13307. [DOI] [PMC free article] [PubMed] [Google Scholar]
- 21.Kotiadis VN, Duchen MR, Osellame LD. Mitochondrial quality control and communications with the nucleus are important in maintaining mitochondrial function and cell health. Biochim Biophys Acta 1840: 1254–1265, 2014. doi: 10.1016/j.bbagen.2013.10.041. [DOI] [PMC free article] [PubMed] [Google Scholar]
- 22.Lee J, Giordano S, Zhang J. Autophagy, mitochondria and oxidative stress: cross-talk and redox signalling. Biochem J 441: 523–540, 2012. doi: 10.1042/BJ20111451. [DOI] [PMC free article] [PubMed] [Google Scholar]
- 23.Lin J, Handschin C, Spiegelman BM. Metabolic control through the PGC-1 family of transcription coactivators. Cell Metab 1: 361–370, 2005. doi: 10.1016/j.cmet.2005.05.004. . [DOI] [PubMed] [Google Scholar]
- 24.Lira VA, Okutsu M, Zhang M, Greene NP, Laker RC, Breen DS, Hoehn KL, Yan Z. Autophagy is required for exercise training-induced skeletal muscle adaptation and improvement of physical performance. FASEB J 27: 4184–4193, 2013. doi: 10.1096/fj.13-228486. [DOI] [PMC free article] [PubMed] [Google Scholar]
- 26.Mansueto G, Armani A, Viscomi C, D’Orsi L, De Cegli R, Polishchuk EV, Lamperti C, Di Meo I, Romanello V, Marchet S, Saha PK, Zong H, Blaauw B, Solagna F, Tezze C, Grumati P, Bonaldo P, Pessin JE, Zeviani M, Sandri M, Ballabio A. Transcription factor EB controls metabolic flexibility during exercise. Cell Metab 25: 182–196, 2017. doi: 10.1016/j.cmet.2016.11.003. [DOI] [PMC free article] [PubMed] [Google Scholar]
- 27.Marcil M, Bourduas K, Ascah A, Burelle Y. Exercise training induces respiratory substrate-specific decrease in Ca2+-induced permeability transition pore opening in heart mitochondria. Am J Physiol Heart Circ Physiol 290: H1549–H1557, 2006. doi: 10.1152/ajpheart.00913.2005. [DOI] [PubMed] [Google Scholar]
- 28.Martina JA, Chen Y, Gucek M, Puertollano R. MTORC1 functions as a transcriptional regulator of autophagy by preventing nuclear transport of TFEB. Autophagy 8: 903–914, 2012. doi: 10.4161/auto.19653. [DOI] [PMC free article] [PubMed] [Google Scholar]
- 29.Medina DL, Di Paola S, Peluso I, Armani A, De Stefani D, Venditti R, Montefusco S, Scotto-Rosato A, Prezioso C, Forrester A, Settembre C, Wang W, Gao Q, Xu H, Sandri M, Rizzuto R, De Matteis MA, Ballabio A. Lysosomal calcium signalling regulates autophagy through calcineurin and TFEB. Nat Cell Biol 17: 288–299, 2015. doi: 10.1038/ncb3114. [DOI] [PMC free article] [PubMed] [Google Scholar]
- 30.Menzies KJ, Singh K, Saleem A, Hood DA. Sirtuin 1-mediated effects of exercise and resveratrol on mitochondrial biogenesis. J Biol Chem 288: 6968–6979, 2013. doi: 10.1074/jbc.M112.431155. [DOI] [PMC free article] [PubMed] [Google Scholar]
- 31.Narendra DP, Jin SM, Tanaka A, Suen DF, Gautier CA, Shen J, Cookson MR, Youle RJ. PINK1 is selectively stabilized on impaired mitochondria to activate Parkin. PLoS Biol 8: e1000298, 2010. doi: 10.1371/journal.pbio.1000298. [DOI] [PMC free article] [PubMed] [Google Scholar]
- 32.Ostojic O, O’Leary MF, Singh K, Menzies KJ, Vainshtein A, Hood DA. The effects of chronic muscle use and disuse on cardiolipin metabolism. J Appl Physiol (1985) 114: 444–452, 2013. doi: 10.1152/japplphysiol.01312.2012. [DOI] [PubMed] [Google Scholar]
- 33.Pilegaard H, Saltin B, Neufer PD. Exercise induces transient transcriptional activation of the PGC-1α gene in human skeletal muscle. J Physiol 546: 851–858, 2003. doi: 10.1113/jphysiol.2002.034850. [DOI] [PMC free article] [PubMed] [Google Scholar]
- 34.Russell AP, Foletta VC, Snow RJ, Wadley GD. Skeletal muscle mitochondria: a major player in exercise, health and disease. Biochim Biophys Acta 1840: 1276–1284, 2014. doi: 10.1016/j.bbagen.2013.11.016. [DOI] [PubMed] [Google Scholar]
- 35.Sakamoto K, Hirshman MF, Aschenbach WG, Goodyear LJ. Contraction regulation of Akt in rat skeletal muscle. J Biol Chem 277: 11910–11917, 2002. doi: 10.1074/jbc.M112410200. [DOI] [PubMed] [Google Scholar]
- 36.Saleem A, Carter HN, Hood DA. p53 is necessary for the adaptive changes in cellular milieu subsequent to an acute bout of endurance exercise. Am J Physiol Cell Physiol 306: C241–C249, 2014. doi: 10.1152/ajpcell.00270.2013. [DOI] [PMC free article] [PubMed] [Google Scholar]
- 37.Saleem A, Hood DA. Acute exercise induces tumour suppressor protein p53 translocation to the mitochondria and promotes a p53-Tfam-mitochondrial DNA complex in skeletal muscle. J Physiol 591: 3625–3636, 2013. doi: 10.1113/jphysiol.2013.252791. [DOI] [PMC free article] [PubMed] [Google Scholar]
- 38.Sandri M. Autophagy in skeletal muscle. FEBS Lett 584: 1411–1416, 2010. doi: 10.1016/j.febslet.2010.01.056. [DOI] [PubMed] [Google Scholar]
- 39.Scarpulla RC. Nuclear control of respiratory chain expression by nuclear respiratory factors and PGC-1-related coactivator. Ann N Y Acad Sci 1147: 321–334, 2008. doi: 10.1196/annals.1427.006. [DOI] [PMC free article] [PubMed] [Google Scholar]
- 40.Scott I, Webster BR, Chan CK, Okonkwo JU, Han K, Sack MN. GCN5-like protein 1 (GCN5L1) controls mitochondrial content through coordinated regulation of mitochondrial biogenesis and mitophagy. J Biol Chem 289: 2864–2872, 2014. doi: 10.1074/jbc.M113.521641. [DOI] [PMC free article] [PubMed] [Google Scholar]
- 41.Settembre C, Ballabio A. TFEB regulates autophagy: an integrated coordination of cellular degradation and recycling processes. Autophagy 7: 1379–1381, 2011. doi: 10.4161/auto.7.11.17166. [DOI] [PubMed] [Google Scholar]
- 42.Settembre C, De Cegli R, Mansueto G, Saha PK, Vetrini F, Visvikis O, Huynh T, Carissimo A, Palmer D, Klisch TJ, Wollenberg AC, Di Bernardo D, Chan L, Irazoqui JE, Ballabio A. TFEB controls cellular lipid metabolism through a starvation-induced autoregulatory loop. Nat Cell Biol 15: 647–658, 2013. doi: 10.1038/ncb2718. [DOI] [PMC free article] [PubMed] [Google Scholar]
- 43.Settembre C, Di Malta C, Polito VA, Garcia Arencibia M, Vetrini F, Erdin S, Erdin SU, Huynh T, Medina D, Colella P, Sardiello M, Rubinsztein DC, Ballabio A. TFEB links autophagy to lysosomal biogenesis. Science 332: 1429–1433, 2010. doi: 10.1126/science.1204592. [DOI] [PMC free article] [PubMed] [Google Scholar]
- 44.Settembre C, Zoncu R, Medina DL, Vetrini F, Erdin S, Erdin S, Huynh T, Ferron M, Karsenty G, Vellard MC, Facchinetti V, Sabatini DM, Ballabio A. A lysosome-to-nucleus signalling mechanism senses and regulates the lysosome via mTOR and TFEB. EMBO J 31: 1095–1108, 2012. doi: 10.1038/emboj.2012.32. [DOI] [PMC free article] [PubMed] [Google Scholar]
- 45.Siddiqui A, Bhaumik D, Chinta SJ, Rane A, Rajagopalan S, Lieu CA, Lithgow GJ, Andersen JK. Mitochondrial quality control via the PGC1α-TFEB signaling pathway is compromised by Parkin Q311X mutation but independently restored by rapamycin. J Neurosci 35: 12833–12844, 2015. doi: 10.1523/JNEUROSCI.0109-15.2015. [DOI] [PMC free article] [PubMed] [Google Scholar]
- 46.Spampanato C, Feeney E, Li L, Cardone M, Lim JA, Annunziata F, Zare H, Polishchuk R, Puertollano R, Parenti G, Ballabio A, Raben N. Transcription factor EB (TFEB) is a new therapeutic target for Pompe disease. EMBO Mol Med 5: 691–706, 2013. doi: 10.1002/emmm.201202176. [DOI] [PMC free article] [PubMed] [Google Scholar]
- 47.Uguccioni G, D’souza D, Hood DA. Regulation of PPARγ coactivator-1α function and expression in muscle: effect of exercise. PPAR Res 2010: 937123, 2010. doi: 10.1155/2010/937123. [DOI] [PMC free article] [PubMed] [Google Scholar]
- 48.Uguccioni G, Hood DA. The importance of PGC-1α in contractile activity-induced mitochondrial adaptations. Am J Physiol Endocrinol Metab 300: E361–E371, 2011. doi: 10.1152/ajpendo.00292.2010. [DOI] [PubMed] [Google Scholar]
- 49.Vainshtein A, Desjardins EMA, Armani A, Sandri M, Hood DA. PGC-1α modulates denervation-induced mitophagy in skeletal muscle. Skelet Muscle 5: 9, 2015. doi: 10.1186/s13395-015-0033-y. [DOI] [PMC free article] [PubMed] [Google Scholar]
- 50.Vainshtein A, Hood DA. The regulation of autophagy during exercise in skeletal muscle. J Appl Physiol (1985) 120: 664–673, 2016. doi: 10.1152/japplphysiol.00550.2015. [DOI] [PMC free article] [PubMed] [Google Scholar]
- 51.Vainshtein A, Tryon LD, Pauly M, Hood DA. Role of PGC-1α during acute exercise-induced autophagy and mitophagy in skeletal muscle. Am J Physiol Cell Physiol 308: C710–C719, 2015. doi: 10.1152/ajpcell.00380.2014. [DOI] [PMC free article] [PubMed] [Google Scholar]
- 52.Vincow ES, Merrihew G, Thomas RE, Shulman NJ, Beyer RP, MacCoss MJ, Pallanck LJ. The PINK1-Parkin pathway promotes both mitophagy and selective respiratory chain turnover in vivo. Proc Natl Acad Sci USA 110: 6400–6405, 2013. doi: 10.1073/pnas.1221132110. [DOI] [PMC free article] [PubMed] [Google Scholar]
- 53.Wright DC, Geiger PC, Han DH, Jones TE, Holloszy JO. Calcium induces increases in peroxisome proliferator-activated receptor gamma coactivator-1α and mitochondrial biogenesis by a pathway leading to p38 mitogen-activated protein kinase activation. J Biol Chem 282: 18793–18799, 2007. doi: 10.1074/jbc.M611252200. [DOI] [PubMed] [Google Scholar]
- 54.Wright DC, Han DH, Garcia-Roves PM, Geiger PC, Jones TE, Holloszy JO. Exercise-induced mitochondrial biogenesis begins before the increase in muscle PGC-1α expression. J Biol Chem 282: 194–199, 2007. doi: 10.1074/jbc.M606116200. [DOI] [PubMed] [Google Scholar]
- 55.Zhang Y, Uguccioni G, Ljubicic V, Irrcher I, Iqbal S, Singh K, Ding S, Hood DA. Multiple signaling pathways regulate contractile activity-mediated PGC-1α gene expression and activity in skeletal muscle cells. Physiol Rep 2: e12008, 2014. doi: 10.14814/phy2.12008. [DOI] [PMC free article] [PubMed] [Google Scholar]