Abstract
Exercise training has robust effects on subcutaneous inguinal white adipose tissue (iWAT), characterized by a shift to a brown adipose tissue (BAT)-like phenotype. Consistent with this, transplantation of exercise-trained iWAT into sedentary rodents activates thermogenesis and improves glucose homeostasis, suggesting that iWAT metabolism may contribute to the beneficial effects of exercise. However, it is yet to be determined if adaptations in iWAT are necessary for the beneficial systemic effects of exercise. To test this, male C57BL/6 mice were provided access to voluntary wheel running (VWR) or remained as a cage control (SED) for 11 nights after iWAT removal via lipectomy (LIPX) or SHAM surgery. We found that SHAM and LIPX mice with access to VWR ran similar distances and had comparable reductions in body mass, increased food intake, and increased respiratory exchange ratio (RER). Further, VWR improved indexes of glucose homeostasis and insulin tolerance in both SHAM and LIPX mice. The lack of effect of LIPX in the response to VWR was not explained by compensatory increases in markers of mitochondrial biogenesis and thermogenesis in skeletal muscle, epididymal white adipose tissue, or interscapular brown adipose tissue. Together, these data demonstrate that mice with and without iWAT have comparable adaptations to VWR, suggesting that iWAT may be dispensable for the metabolic health benefits of exercise.
Keywords: adipose tissue, exercise, glucose, metabolism, physical activity
INTRODUCTION
Adipose tissue can be categorized into three main types, brown adipose tissue (BAT), beige adipose tissue, and white adipose tissue (WAT), with each having unique biological functions. BAT is able to dissipate excess energy as heat, via uncoupling protein 1 (UCP-1), whereas WAT is traditionally characterized as a storage depot for excess lipid (49). Within WAT there are distinct depots based on anatomical location, and it has been shown that visceral WAT is associated with greater cardiovascular disease risk than subcutaneous WAT (12). In rodent models, surgical removal of subcutaneous inguinal WAT (iWAT) can eventually lead to metabolic dysfunction and ectopic lipid accumulation (6, 11). Conversely, transplantation of iWAT into the visceral cavity of mice leads to improved glucose homeostasis and body composition, which occurs alongside beneficial alterations in circulating adipokines (46). Together, these data suggest that iWAT has an important role in metabolic homeostasis; therefore, strategies to harness the potential of iWAT may have beneficial effects on overall metabolic health.
Exercise is well known to lead to numerous beneficial metabolic effects, including reductions in body mass and improvements in glucose homeostasis (48). It has been known for decades that regularly performed exercise can increase indexes of mitochondrial biogenesis in skeletal muscle (16), and more recently this has also been found in both subcutaneous and visceral WAT (28, 41–43). Specifically, exercise uniquely impacts iWAT to undergo a phenotypic switch to a BAT-like phenotype (i.e., browning/beiging), which is marked by multilocular lipid droplets and an increase in the mRNA expression and protein content of UCP-1 and peroxisome proliferator-activated receptor gamma coactivator 1-alpha (PGC-1α) (3, 33, 42). It was recently demonstrated that transplantation of exercise-trained iWAT into a sedentary host activates thermogenesis and improves glucose homeostasis (42). Similarly, exercise-induced increases in the browning of iWAT in rats have been shown to be associated with increases in energy expenditure (50). Collectively these findings provide evidence that adaptations in iWAT could be contributing to the beneficial effects of exercise. However, caveats to these studies exist as they were either associative in nature (50), or did not directly elucidate the necessity of iWAT in mediating the effects of exercise (42).
Therefore, the purpose of this study was to examine the contribution of iWAT to the beneficial metabolic effects of exercise. To do this, we performed bilateral iWAT removal (i.e., lipectomy, LIPX) or SHAM surgery and after 16–18 days of recovery gave half of the mice access to voluntary wheel running (VWR) for 11 days, a mode of exercise training known to robustly activate iWAT (42). We hypothesized that the removal of iWAT would attenuate the metabolic health benefits of exercise. However, with VWR we found that both SHAM and LIPX mice had similar reductions in body mass, improvements in glucose homeostasis and insulin tolerance, and increased whole body carbohydrate utilization. Moreover, LIPX did not alter the response of epididymal white adipose tissue (eWAT), BAT, or skeletal muscle to VWR. Together, these data suggest that although iWAT is responsive to exercise, it is not required for the metabolic health benefits of exercise assessed within this study.
METHODS
Ethics.
The procedures in this study were approved by the Animal Care Committee at the University of Guelph and are in concordance with the guidelines of the Canadian Council on Animal Care.
Animal experiments.
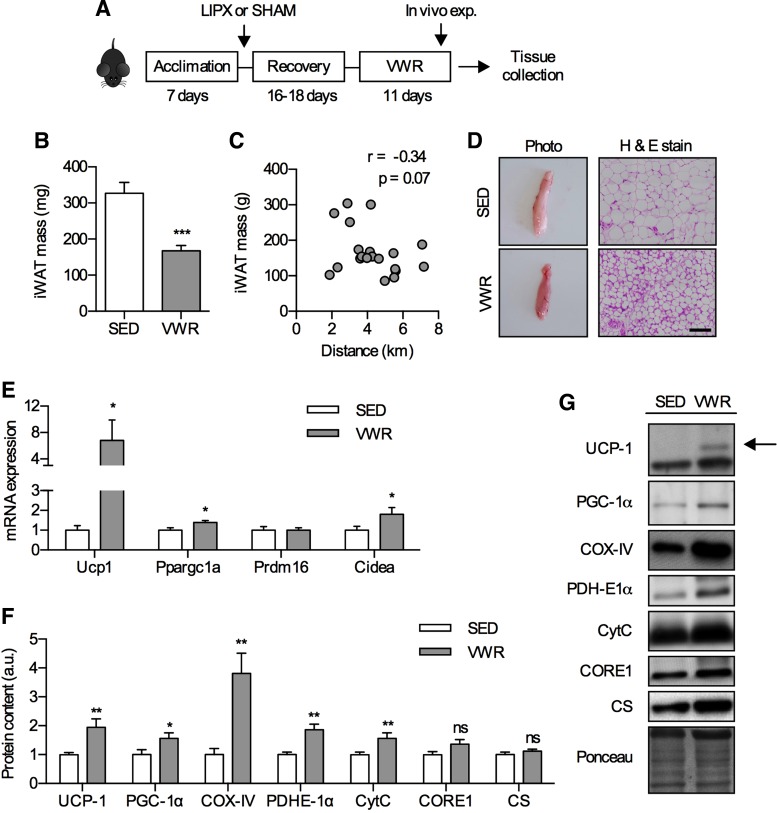
Male C57BL/6 mice were purchased from Charles River (Saint-Constant, QC) at 7 wk of age. After acclimation to our facility, SHAM or lipectomy (LIPX) surgeries were completed at 8 wk of age and mice were allowed to recover between 16 and 18 days before start of VWR (total of n = 20–21 for each of the 4 groups). VWR mice had free access to a running wheel for 11 nights and distance was recorded daily using an odometer (cat. no. 5037–275; Mountain Equipment Co-Op, Vancouver, BC), whereas sedentary mice remained in standard cages, as we have previously described (28). Throughout the experimental procedures mice were housed one per cage and fed a standard rodent diet (cat. no. 7004; Teklad) and tap water ad libitum, and were housed at 22°C. A schematic of the study design is shown in Fig. 1A.
Fig. 1.
Voluntary wheel running (VWR) leads to an alteration of inguinal white adipose tissue (iWAT) phenotype in SHAM mice. A: schematic of study design. iWAT mass (B) and correlation of iWAT mass with distance run (C) (n = 20–21). D: photograph (left) and hematoxylin and eosin (H & E stain) (right) of iWAT with scale bar indicating 100 µm (n = 4). E: mRNA expression of thermogenic genes (n = 8–12/group). F: quantified Western blots of thermogenic and mitochondrial proteins (n = 14–16/group) with representative images and an example loading control via Ponceau S staining (G). Significance is shown between cage control (SED) and VWR: *P < 0.05, **P < 0.01, ***P < 0.001. Values are reported as means ± SE.
Lipectomy surgery.
LIPX surgeries were completed as previously described (6, 11). Mice were anesthetized with isoflurane (5%) and maintained in a surgical plane using 2% isoflurane. For LIPX surgeries, a midline subcutaneous incision was made, skin was separated from underlying musculature, both iWAT depots were removed, and the incision closed with wound clips. SHAM mice underwent the same procedure without removal of iWAT. Prior to the surgery all mice received an intraperitoneal injection of 20 mg/kg carprofen as well as a subcutaneous injection of lidocaine and bupivacaine, with an additional dose (10 mg/kg) of carprofen on the day after surgery.
Metabolic caging.
Comprehensive Laboratory Animal Monitoring System (CLAMS) caging was used to assess whole body substrate oxidation and energy expenditure (Columbus Instruments, Columbus, OH). Mice were removed from home cages and acclimated to CLAMS caging at the start of the light cycle, and data collection began at the start of the dark cycle for a 24-h period (12 h dark, then 12 h light). VWR mice did not have access to their wheel during this experiment. V̇o2 (ml/h), respiratory exchange ratio (RER), total activity (sum of X and Z total), and energy expenditure as heat production (kcal/min) were obtained.
In vivo metabolic assessment.
Blood glucose was measured from a tail snip using a handheld Freestyle Lite glucometer and glucose strips (Abbott Diabetes Care; Mississauga, ON). For the glucose tolerance test (GTT) mice were fasted overnight for 14 h with a wheel lock in VWR mice, as previously described (42). Glucose was intraperitoneally injected at 2 g/kg, and blood glucose was measured immediately preinjection (i.e., 0) and then at 15, 30, 60, 90, and 120 min postinjection with the area under the curve (AUC) calculated as previously described (28). An abbreviated insulin tolerance test (ITT) was conducted in nonfasted mice whereby insulin was intraperitoneally injected at a dose of 1 U/kg, and blood glucose was measured immediately preinjection (i.e., 0) and then at 5 and 15 min postinjection, at which point tissues were collected for assessment of insulin signaling (2, 35). A pyruvate tolerance test (PTT) was conducted after a 15-h fast with a wheel lock in VWR mice, pyruvate (cat. no. 5280; Sigma Aldrich, Oakville, ON) was intraperitoneally injected at 2 g/kg, and blood glucose was measured immediately before injection (i.e., 0), and at 5, 15, 30, and 60 min postinjection. These experiments were completed in independent groups of mice, and were conducted 24 h before tissue collection (GTT and PTT) or immediately before tissue collection (ITT).
Tissue collection.
Before tissue collection, VWR mice had a 5–6 h wheel lock to minimize the influence of prior exercise, which occurred after the 11th night of VWR or SED. Mice were anesthetized with a weight-adjusted bolus of pentobarbital sodium (~60 mg/kg) in a fed state and skeletal muscle (triceps), eWAT, iWAT, liver, and BAT were collected and either fixed in formalin for histological analysis or snap-frozen in liquid nitrogen.
Serum measurements.
Non-insulin-stimulated serum was used to measure nonesterified fatty acids (NEFA) via commercially available kits (Wako Diagnostics, Richmond, VA), as previously described (30). Likewise, a multiplex enzyme-linked immunosorbent assay was used to measure circulating levels of insulin, GLP-1, resistin, GIP, ghrelin, glucagon, PAI-1, and leptin (cat. no. 171F7001M; Bio-Rad, Mississauga, ON).
Western Blotting.
Tissue was homogenized in a 4× (white adipose tissue), 20× (BAT and skeletal muscle), or 30× (liver) cocktail of cell lysis buffer (cat. no. FNN0021, ThermoFisher, Mississauga, ON) supplemented with phenylmethylsulfonyl fluoride and protease inhibitor cocktail as recommended. Protein content was determined using a BCA assay (39). Samples were run on 15-well acrylamide gels, transferred onto nitrocellulose membrane, incubated in primary antibody overnight at 4°C, corresponding secondary antibody for 1 h at room temperature, and signals were detected using chemiluminescence. Primary antibodies were purchased from AbCam (Toronto, ON) for citrate synthase (CS, cat. no. ab129095), anti-ubiquinol-cytochrome c reductase (CORE1, cat. no. 110252), cytochrome c (CytC, cat. no. ab110325), cytochrome c oxidase subunit IV (COXIV, cat. no. ab16056), pyruvate dehydrogenase subunit E1α (PDH-E1α, cat. no. 110330), UCP-1 (cat. no. 10983); Cayman (Ann Arbor, MI) for phosphoenolpyruvate carboxykinase (PEPCK, cat. no. 10004943); Millipore (Billerica, MA) for glucose transporter 4 (GLUT-4, cat. no. 07–1404) and PGC-1α (cat. no. AB3242); Cell Signaling (Danvers, MA) for AKT total (AKT, cat. no. 9272), adipose triglyceride lipase (ATGL, cat. no. 2138), pAKTSer473 (cat. no. 9271), pAKTThr308 (cat. no. 9275), hexokinase II (HKII, cat. no. 2106), hormone-sensitive lipase (HSL, cat. no. 4107), pHSLSer565 (cat. no. 4137), and pHSLSer660 (cat. no. 4126); and Santa Cruz (Mississauga, ON) for glucose 6-phosphatase (G6Pase, cat. no. 25840). Proteins of interest were normalized from the same gel to total protein via Ponceau S staining (cat. no. P7170, Sigma Aldrich) (34). However, phosphorylated AKT was normalized to total AKT and gels were run in parallel using Ponceau S staining of each to verify equivalent loading. In iWAT, Western blots were run with a BAT sample as a positive control.
Real-time quantitative PCR.
RNA was extracted using TRIzol (cat. no. 15596018; ThermoFisher, Mississauga, Canada) and Qiagen RNeasy Mini Kits (cat. no. 74104; Qiagen, Toronto, Canada) with DNase-free treatment (cat. no. AM1906; ThermoFisher). cDNA synthesis was completed using Superscript II (cat. no. 18064014; ThermoFisher) and diluted 1:8 for eWAT and 1:15 for iWAT. PCR plates were prepared using iTaq Universal SYBR Green Supermix (cat. no. 1725121; Bio-Rad). PCR primers are listed in Table 1 and were obtained from prior publications (3, 19), with plates run on a Bio-Rad CFX connect system. Data were expressed relative to Ppib using the 2−ΔΔCT method (23), which did not change between groups, and was normalized to the SHAM SED group.
Table 1.
PCR primers
| Gene | Forward Primer (5′→3′) | Reverse Primer (5′→3′) | Ref. |
|---|---|---|---|
| Ppib | GGAGATGGCACAGGAGGAA | GCCCGTAGTGCTTCAGCTT | 19 |
| Ucp1 | ACTGCCACACCTCCAGTCATT | CTTTGCCTCACTCAGGATTGG | 19 |
| Ppargc1a | CCCTGCCATTGTTAAGACC | TGCTGCTGTTCCTGTTTTC | 3 |
| Prdm16 | CAGCACGGTGAAGCCATTC | GCGTGCATCCGCTTGTG | 3 |
| Cidea | TGCTCTTCTGTATCGCCCAGT | GCCGTGTTAAGGAATCTGCTG | 3 |
Histology.
Adipose tissue histology was completed as previously described (13), with cell size measured using ImageJ Software (36).
Statistical Analysis.
Data were first assessed for normality and if not normally distributed were log10 transformed. Statistical analyses performed included a t-test (iWAT data), Pearson correlation (correlation analysis), two-way ANOVA with LIPX × VWR as factors (tissue and circulation assessments), three-way ANOVA with LIPX × VWR × Insulin as factors (insulin action), or three-way mixed ANOVA with LIPX × VWR × Time as factors (tolerance tests). Post hoc testing was completed using the Fisher’s LSD test. Significance was set at P < 0.05.
RESULTS
Effect of 11 days of VWR on subcutaneous iWAT.
As previous studies have shown that short-term (42) and long-term VWR (28) robustly effect iWAT phenotype, we first wanted to evaluate this in SHAM mice. Eleven days of VWR led to reductions in iWAT mass by ~50% (Fig. 1B) which tended to be negatively correlated with distance run (r = −0.34, P = 0.07) (Fig. 1C) and led to differences in appearance (Fig. 1D). To determine whether exercise induced a thermogenic gene program in iWAT, we measured the mRNA expression of Ucp1, Ppargc1a, Prdm16, and Cidea and found that aside from Prdm16 all of these markers were increased after VWR, albeit to slightly different extents (Fig. 1E). This was paralleled by increases in the protein content of UCP-1, PGC-1α, and other markers of mitochondrial biogenesis such as COX-IV, PDH-E1α, and CytC (Fig. 1F). Together, these data clearly demonstrate that 11 days of VWR is sufficient to have a robust effect on iWAT phenotype, and support findings of previous studies (42).
Removal of iWAT does not influence VWR adaptations in body composition or food intake.
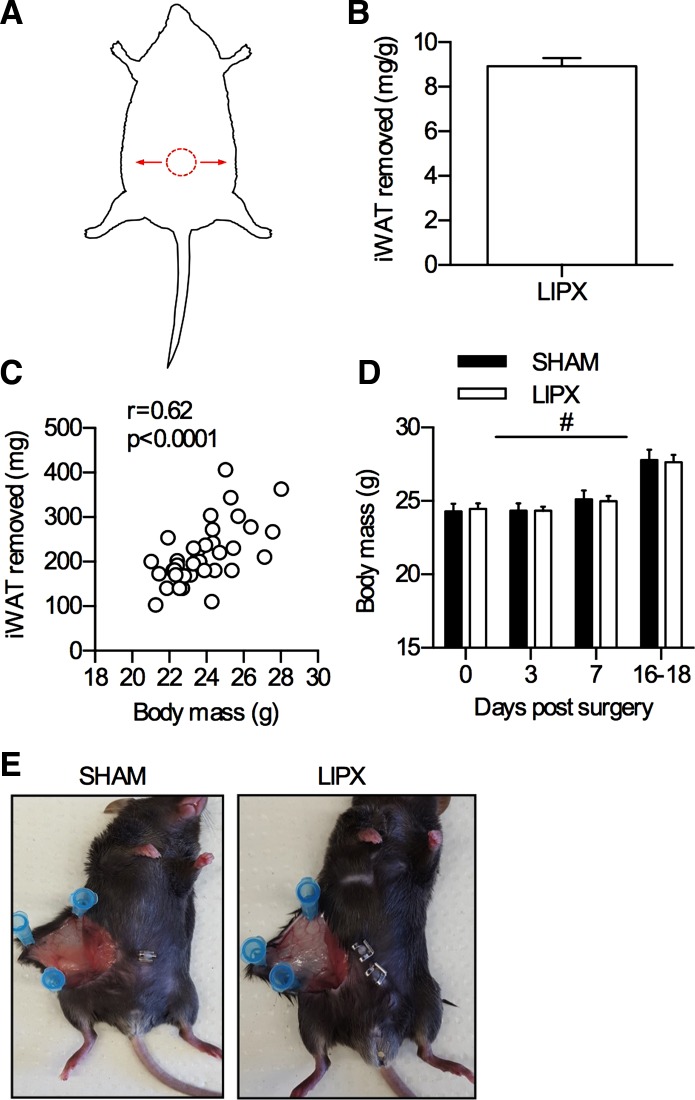
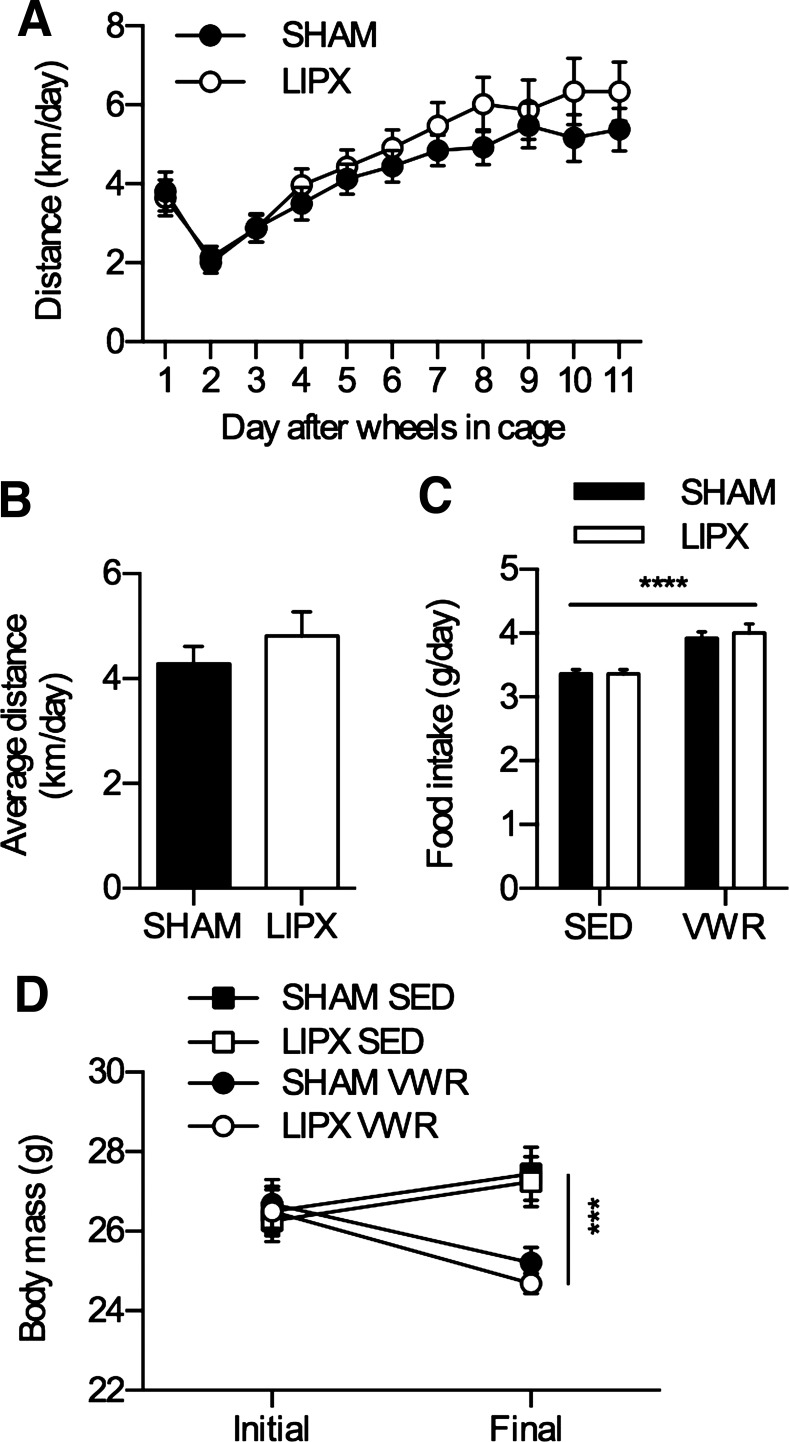
Given the robust effect of VWR on iWAT phenotype, we next aimed to determine if the contributions of this adipose tissue depot are required for the metabolic health benefit of exercise. To do this, we used surgical removal of iWAT, known as lipectomy (LIPX), and completed all experiments within 5 wk of surgery to avoid compensatory changes in other fat depots and metabolic dysfunction that have been reported after removal of iWAT (6, 11). The LIPX procedure allows us to effectively remove iWAT, and is well tolerated by mice (an overview of the technique is shown in Fig. 2). After allowing 16–18 days of recovery, SHAM and LIPX mice were transferred to cages with running wheels or remained in standard cages (SED) for 11 days. We found that SHAM and LIPX mice with access to VWR had a similar pattern of activity whereby running distance was slowly increased over the 11 nights (Fig. 3A) leading to a similar average (Fig. 3B). This occurred alongside increases in food intake (Fig. 3C) and led to reductions in body mass (Fig. 3D). Moreover, both SHAM and LIPX mice with access to VWR had significant reductions in circulating leptin, which occurred alongside significant increases in GLP-1 but independent of changes in other appetite hormones such as ghrelin (Table 2).
Fig. 2.
Lipectomy (LIPX) procedure. A: graphical representation of LIPX procedure, with red circle indicating midline incision and arrows indicating the bilateral direction through which removal of iWAT tissue was completed. Quantification of iWAT removed (B) and correlation with body mass (C) (n = 40). D: body mass change in SHAM and LIPX mice after surgery: #P < 0.0001 main effect of time (n = 20/group). E: image of a single iWAT depot in sedentary SHAM and LIPX mice at 5 wk postsurgery.
Fig. 3.
Removal of iWAT does not impact distance run, food intake, or change in body mass with VWR. A: distance run over the 11 nights. B: average distance calculated over the 11 nights. C: average food intake (g/day) with significance shown as a main effect of VWR. ****P < 0.0001. D: body mass change from initial to final over the 11 nights with significance shown as a 3-way ANOVA simple main effect of VWR at the final time point: ***P < 0.001. Values are reported as means ± SE and represent n = 20–21/group.
Table 2.
Circulating hormone levels
| SED |
VWR |
|||
|---|---|---|---|---|
| SHAM | LIPX | SHAM | LIPX | |
| Insulin, ng/ml | 4.07 ± 0.56 | 3.38 ± 0.28 | 4.64 ± 0.65 | 4.39 ± 0.46 |
| GLP-1, pmol/l | 27.02 ± 4.62 | 22.60 ± 1.49 | 47.79 ± 11.42† | 42.33 ± 4.47† |
| Resistin, ng/ml | 127.85 ± 15.27 | 140.43 ± 17.01 | 133.43 ± 11.99 | 133.84 ± 14.59 |
| GIP, ng/ml | 0.30 ± 0.04 | 0.33 ± 0.04 | 0.44 ± 0.08 | 0.26 ± 0.04 |
| Ghrelin, ng/ml | 3.73 ± 0.29 | 4.01 ± 0.44 | 3.96 ± 0.49 | 3.40 ± 0.42 |
| Glucagon, ng/ml | 0.56 ± 0.17 | 0.42 ± 0.05 | 0.71 ± 0.14 | 0.53 ± 0.04 |
| PAI-1, ng/ml | 1.09 ± 0.06 | 1.01 ± 0.13 | 1.08 ± 0.04 | 1.13 ± 0.06 |
| Leptin, ng/ml | 1.37 ± 0.21 | 1.04 ± 0.20 | 0.38 ± 0.04‡ | 0.46 ± 0.08‡ |
| NEFA, mmol/l | 0.22 ± 0.02 | 0.23 ± 0.24 | 0.17 ± 0.02* | 0.19 ± 0.01* |
Results are displayed as means ± SE (n = 6/group). Serum was analyzed from SHAM and LIPX mice after 11 days of voluntary wheel running (VWR). A 2-way ANOVA main effect of VWR is shown as
P < 0.05, †P < 0.01, ‡P < 0.001.
VWR leads to subtle shifts in substrate oxidation, but this is not influenced by iWAT removal.
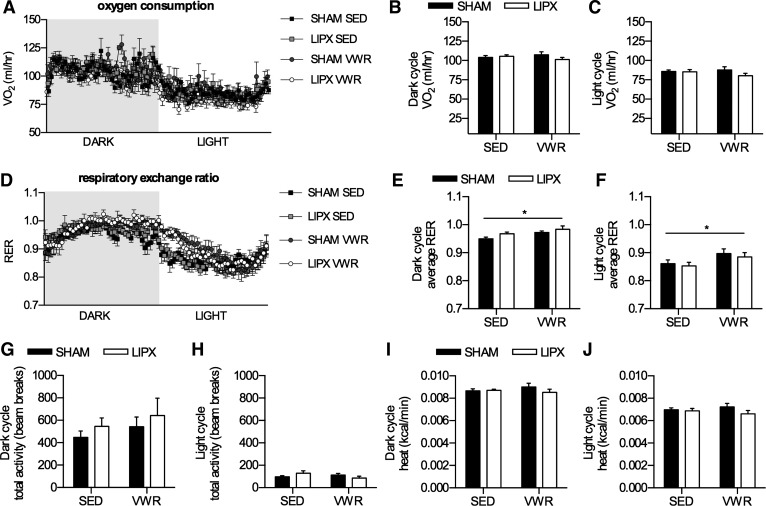
To delineate whether removal of iWAT leads to compensatory changes in oxygen consumption or substrate oxidation, and to determine if VWR impacted whole body energy expenditure, we measured these end points using metabolic caging. Given the lower adipose tissue mass of mice with access to VWR, we chose to express oxygen consumption and energy expenditure data as absolute values (4). We found that there was no difference in oxygen consumption (Fig. 4, A–C), however the respiratory exchange ratio (RER) was slightly elevated in VWR mice during the dark and light phase, indicative of greater use of carbohydrate as a substrate (Fig. 4, D–F). Total activity levels were not different with VWR and/or LIPX (Fig. 4, G and H), nor were there differences in absolute energy expenditure (Fig. 4, I and J).
Fig. 4.
Metabolic phenotype after VWR in SHAM and LIPX mice. A: oxygen consumption expressed as ml/h over the dark and light cycle, with average values for each shown in B and C, respectively. D: respiratory exchange ratio (RER) over the dark and light cycle, with average values for each shown in E and F, respectively. Total activity as the sum of X total and Z total averaged over the dark (G) and light cycle (H). Energy expenditure expressed as kcal/min averaged over the dark (I) and light cycle (J). Significance is shown as a flat bar for a main effect of VWR: *P < 0.05. Values are reported as means ± SE and represent n = 6/group.
VWR leads to improvements in glucose and insulin homeostasis that are not influenced by LIPX.
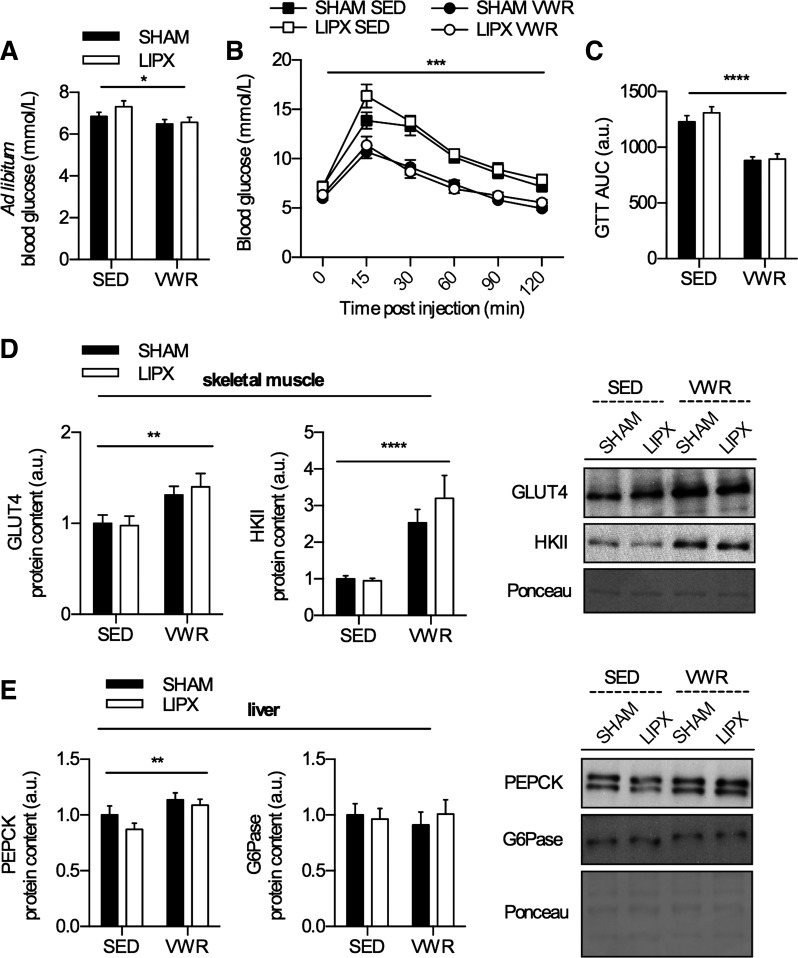
Next, we wanted to determine if LIPX influenced the known ability of VWR to improve indexes of glucose homeostasis (42). We observed that ad libitum (i.e., fed) glucose values were decreased in both SHAM and LIPX mice with access to VWR (Fig. 5A). In addition, VWR improved glucose tolerance in both SHAM and LIPX mice (Fig. 5B), which was also demonstrated with lower area under the curve (Fig. 5C). Aligning with this we observed subtle increases (~1.3 fold) in the total protein content of GLUT4 and large increases (~3 fold) in the protein content of HKII in triceps muscle (Fig. 5D), key proteins mediating the entry and metabolism of glucose into the cell, respectively (32).
Fig. 5.
Glucose homeostasis is improved after VWR in SHAM and LIPX mice. A: ad libitum glucose values measured at ZT0 (n = 20–21/group). B: glucose tolerance test (GTT) curve (n = 10/group), with significance shown as a 3-way ANOVA simple main effect of VWR at all time points: ***P < 0.001. C: GTT area under the curve (AUC). Quantified Western blots for skeletal muscle protein content of GLUT4 and HKII with representative images on right (D) and liver protein content of PEPCK and G6Pase with representative images on right (E) (n = 10–11/group) including an example loading control via Ponceau S staining. Significance is shown as a flat bar for a main effect of VWR: *P < 0.05, **P < 0.01, ****P < 0.0001 unless otherwise noted. Values are reported as means ± SE.
To delineate whether the liver was involved in the improved glucose homeostasis, we completed a pyruvate tolerance test as an index of gluconeogenic capacity and found that VWR led to a slightly lower glucose response in the area under the curve (SHAM SED, 406.4 ± 25.6; LIPX SED, 391.7 ± 16.9; SHAM VWR, 312.3 ± 9.3; LIPX VWR, 343.6 ± 16.3; P < 0.05 main effect of VWR). This occurred in parallel with an increase in the liver protein content of PEPCK, but not G6Pase in both SHAM and LIPX mice (Fig. 5E), and supports previous findings from our group (29) and others (15).
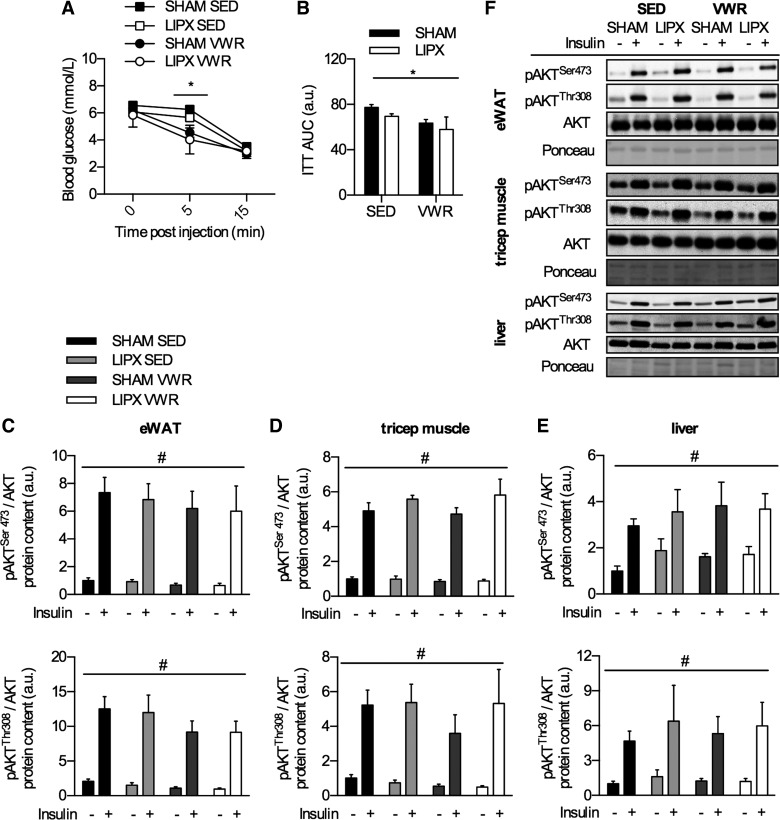
As exercise training is known to improve insulin tolerance and action, we next wanted to determine if LIPX influenced this response. In an independent group of mice, insulin tolerance was measured by an abbreviated ITT using 1 U/kg of insulin, which allows us to assess insulin-induced reductions in blood glucose (35) as well as the activation of the insulin-signaling pathway by measurement of AKT phosphorylation at serine 473 and threonine 308 (1). VWR mice had lower blood glucose 5 min post-insulin injection but similar values at 15 min postinjection (Fig. 6A), which led to an overall lower area under the curve (Fig. 6B). In tissues collected after 15 min of insulin stimulation, insulin led to a robust increase in phosphorylation of AKT at serine 473 and threonine 308 residues in eWAT (Fig. 6C), triceps muscle (Fig. 6D), and liver (Fig. 6E); however this was not different between groups. These effects occurred independent of differences in basal insulin levels in mice not treated with insulin, as there were no differences with VWR and/or LIPX (Table 2).
Fig. 6.
Insulin-induced change in blood glucose and phosphorylation of AKT. A: insulin tolerance test curve (ITT) with significance shown as a 3-way ANOVA simple main effect of VWR at the 5-min time point: *P < 0.05. B: ITT area under the curve (AUC). Quantification of Western blots for assessment of insulin action in epididymal WAT (eWAT) (C), skeletal muscle (triceps) (D), and liver (E) with representative Western blots shown (F). Significance is shown as flat bar for a main effect of insulin (#P < 0.001) or VWR (*P < 0.05), unless otherwise noted. Values are reported as means ± SE and represent n = 4–6/group.
VWR leads to reductions in eWAT mass and cell size in parallel with increases in indexes of mitochondrial biogenesis.
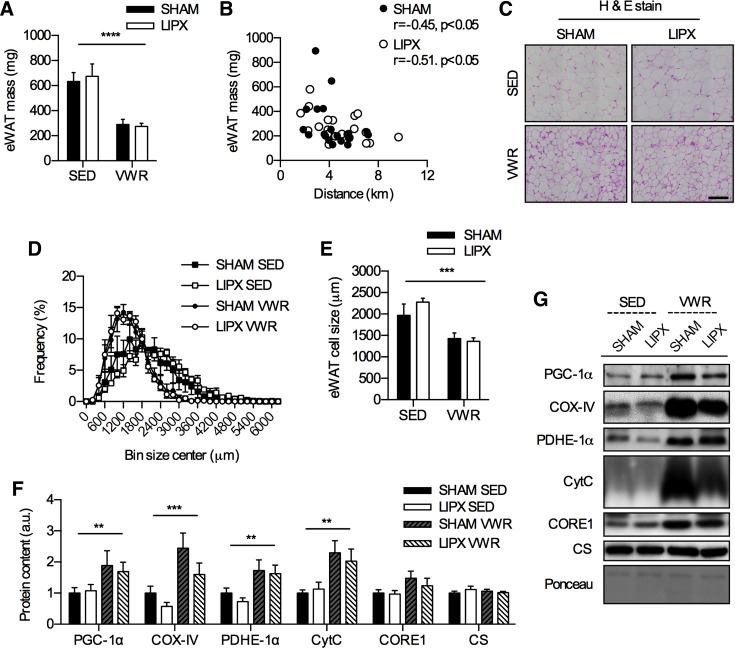
Previous studies have shown that LIPX leads to compensatory changes in other adipose tissue depots (6, 11), and exercise is known to increase indexes of mitochondrial biogenesis in white adipose tissue (28, 43); therefore we assessed these markers. In eWAT, which is an intra-abdominal adipose tissue depot, tissue mass was reduced by VWR in both SHAM and LIPX mice (Fig. 7A) and was negatively correlated with distance run (Fig. 7B). Further, there were significant reductions in adipocyte cell size after VWR in SHAM and LIPX mice (Fig. 7, C–E), which occurred alongside significantly lower circulating levels of NEFA (Table 2). We were unable to detect UCP-1 protein content in eWAT and found no differences in Ucp1 mRNA expression (data not shown). VWR led to increases in indexes of mitochondrial biogenesis including PGC-1α, COX-IV, PDH-E1α, and CytC in both SHAM and LIPX mice (Fig. 7F).
Fig. 7.
VWR induces alterations in eWAT phenotype that are not impacted by LIPX. A: eWAT mass (n = 20–21/group). B: correlation of eWAT mass with distance run (n = 20/group). C: representative H & E stain (scale bar indicates 100 µm) alongside frequency distribution of eWAT cell size (D) and average values (E) (n = 4/group). F: quantification of eWAT protein content for markers of mitochondrial biogenesis, with representative images and an example loading control via Ponceau S staining (G) (n = 10–11/group). Significance is shown as a flat bar for a main effect of VWR: **P < 0.01, ***P < 0.001, ****P < 0.0001. Values are reported as means ± SE.
VWR impacts BAT independent of LIPX.
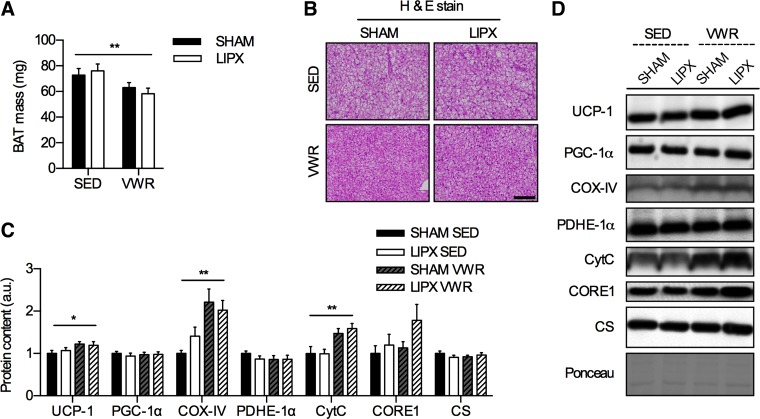
We next wanted to characterize the impact of VWR in SHAM and LIPX mice on BAT phenotype, as others have shown that treadmill exercise alters the protein content of UCP-1 and indexes of mitochondrial biogenesis in this tissue (14, 40, 44, 50). We found that there were slight reductions in absolute mass of interscapular BAT after VWR in both SHAM and LIPX mice (Fig. 8A), which occurred in parallel with marked phenotypic alterations (Fig. 8B). Additionally, VWR altered the thermogenic potential of BAT as shown by increases in the protein content of UCP-1, and increased indexes of mitochondrial biogenesis including COX-IV and CytC in both SHAM and LIPX mice (Fig. 8C).
Fig. 8.
VWR reduces BAT mass and impacts BAT phenotype. A: BAT mass (n = 10/group). B: representative H & E stain; scale bar indicates 100 µm (n = 4/group). C: quantification of BAT protein content for markers of mitochondrial biogenesis, with representative images and an example loading control via Ponceau S staining (D) (n = 10/group). Significance is shown as a flat bar for a main effect of VWR: *P < 0.05, **P < 0.01. Values are reported as means ± SE.
VWR increases indexes of skeletal muscle mitochondrial biogenesis independent of LIPX.
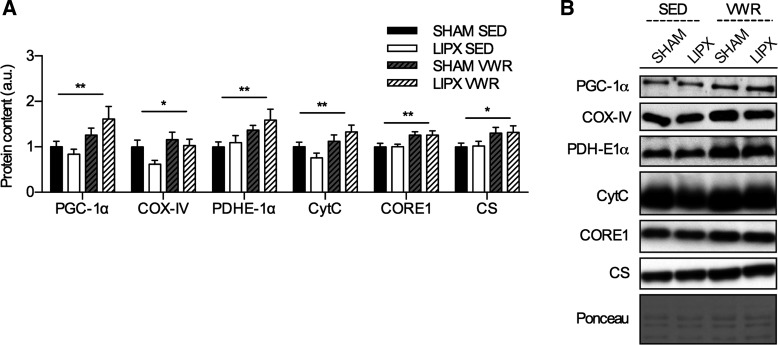
As a final comparison, we wanted to evaluate whether the 11 days of VWR impacted indexes of skeletal muscle mitochondrial biogenesis, which are well-understood adaptations to exercise (16), and whether this was impacted by removal of iWAT. We found that both SHAM and LIPX mice had increases in the protein content of PGC-1α, COX-IV, PDHE-1α, CytC, CORE-1, and CS after VWR (Fig. 9A).
Fig. 9.
Induction of indexes of mitochondrial biogenesis in triceps muscle after VWR is not influenced by LIPX. A: quantification of triceps protein content for markers of mitochondrial biogenesis, with representative images and an example loading control via Ponceau S staining (B) (n = 10–11/group) Significance is shown as a flat bar for a main effect of VWR: *P < 0.05, **P < 0.01. Values are reported as means ± SE.
DISCUSSION
In this report, we are the first to determine that although iWAT is highly responsive to exercise, it is not required for many of the metabolic health benefits. We found that after just 11 days of VWR, iWAT adopts a beige phenotype characterized by increases in the mRNA expression and protein content of UCP-1 and PGC-1α. Despite these robust alterations in iWAT, we found that both SHAM and LIPX mice had reductions in body mass, similar increases in whole body carbohydrate utilization (i.e., increased RER), improvements in glucose homeostasis and insulin tolerance, and an induction of indexes of mitochondrial biogenesis in intra-abdominal white adipose tissue (i.e., eWAT) and triceps muscle. Moreover, both SHAM and LIPX mice had reductions in BAT mass alongside increases in protein content of UCP-1. Together, although we demonstrate that iWAT is highly responsive to VWR, we present several lines of evidence suggesting that these adaptations do not appear to be required for the metabolic health benefits.
Exercise increases the expression of UCP-1 in iWAT (28, 50), and UCP-1 is known to have an important role in energy homeostasis through thermogenesis (17). We hypothesized that the removal of iWAT via LIPX would attenuate the beneficial effects of VWR, yet this was not observed as SHAM and LIPX mice had similar adaptations to VWR. Given this, it was plausible that compensatory changes in other tissues could be masking the null effect of iWAT removal, and we speculated that the intra-abdominal eWAT depot could potentially compensate for the lack of iWAT by increasing UCP-1. However, we were unable to detect UCP-1 protein content in eWAT in either SHAM or LIPX mice. This was not explained by a lack of effect of VWR, as both groups had increases in indexes of mitochondrial biogenesis in eWAT as marked by protein content of PGC-1α, COX-IV, PDH-E1α, and CytC, which is similar to that previously reported (28, 43). This aligns with recent reports showing that even thermogenic challenges such as cold exposure have little effect on UCP-1 protein content in eWAT (18). It is possible that other adipose tissue depots such as anterior subcutaneous adipose tissue or triceps adipose tissue, which are known to be responsive to cold (7), could be compensating for the lack of iWAT in LIPX mice. Unfortunately, these were not collected; therefore we can only speculate that additional adipose tissue depots may have influenced the response to VWR in mice without iWAT.
In contrast to these effects, VWR led to decreases in interscapular BAT mass alongside subtle increases in the protein content of UCP-1 in both SHAM and LIPX mice, despite little changes in other indexes of mitochondrial biogenesis. The increase in UCP-1 aligns with prior work from our group in mice using 4 wk of treadmill training (40), and from others using 7 days (38). However, other reports in rats have found that treadmill training leads to reductions in UCP-1 protein content in BAT (14, 44, 50). The inconsistencies between these studies may be due to mode of exercise, or even species. Unlike treadmill training that is typically performed for only 1–2 h/day during the light phase, wheel running may provide a unique stimulus to mice as for a large proportion of the dark phase they are active (22, 27). The greater time of wheel running may prompt a continuous supply of substrate to fuel BAT such as NEFA (45), which may drive the adaptations we observed. On the other hand, given the large decrease in BAT mass, it is possible that total levels of UCP-1 protein within BAT may be similar (18). As a recent review indicates that the effect of exercise on BAT protein content of UCP-1 is inconclusive (10), future studies should elucidate these effects in greater detail. Overall, despite the lack of iWAT in LIPX mice, there do not appear to be any compensatory changes in BAT either morphologically or at the protein level.
It is not clear why mitochondrial uncoupling occurs in adipose tissue after exercise, but a number of potential explanations exist. As the mice in our facility are housed below thermoneutral temperature (i.e., <30°C), which may present a thermal stress in itself, an increase in UCP-1 may be observed as a mechanism to compensate for reductions in total adipose mass and insulation after exercise (25). Identifying whether exercise-induced increases in UCP-1 occur at thermoneutral conditions would address this hypothesis. Moreover, although it is not well defined, UCP-1 may dampen the effects of lipid-induced reactive oxygen species (ROS) (20, 37). As exercise is suggested to elevate ROS (31), the increase in UCP-1 protein content in adipose tissue may be an adaptive mechanism to reduce the deleterious effects. Future studies are required to specifically evaluate why increases in the protein content of UCP-1 occur in adipose tissue after exercise training.
In addition to the robust effects on adipose tissue, exercise is well known to lead to improvements in glucose homeostasis. As prior studies found that iWAT transplantation into either the subcutaneous or visceral cavity of a host leads to improvements in glucose homeostasis (26, 42, 46), we initially expected that removal of iWAT would ablate the improvements induced by VWR. However, ad libitum glucose levels and glucose tolerance were improved after VWR in both SHAM and LIPX mice. This occurred in parallel with similar increases in GLUT4 and HKII protein content in triceps muscle. These data suggest no compensatory increase in triceps muscle glucose metabolism after iWAT removal; however it is possible that there may also be compensation through increases in lipolytic activity. Others have shown that deletion of ATGL from adipocytes, but not myocytes, influences acute exercise ability (8). We therefore assessed whether markers of skeletal muscle lipolysis were altered after LIPX or VWR by measurement of ATGL and phosphorylation of HSL at serine 565 and 660 residues. However, there were no detectable differences in these markers (data not shown). Thus our data suggest that no compensatory adaptations in triceps muscle glucose metabolism or lipolysis are occurring with VWR in LIPX mice.
The improved glucose homeostasis after VWR in mice without iWAT, and by extension lack of iWAT browning, suggests a potential disconnect between these biological phenomena. Aside from exercise, other studies using therapeutic interventions have observed improvements in glucose homeostasis independent of adipose tissue browning. For example, Mottillo and colleagues (24) recently showed that fibroblast growth factor 21 (FGF21) treatment led to marked improvements in glucose homeostasis, but had no effect on iWAT browning. Likewise, others have used FGF21 treatment in mice deficient in UCP-1 and have still observed improvements in glucose homeostasis (47). Moreover, mice with targeted pharmacological activation of iWAT browning by chronic β3-adrenergic agonist treatment displayed little improvement in adipose tissue glucose uptake in response to acute adrenergic stimulation (21). Thus the data in our study and that from other groups using pharmacological interventions demonstrate that there can be independence of iWAT browning and glucose homeostasis.
The data presented in this manuscript clearly indicate that surgical removal of iWAT does not influence the metabolic adaptations to wheel running; however, some limitations must be addressed. First and foremost, the clinical relevance of this design is limited. Although adipose tissue removal via liposuction is done in humans, our surgical model is likely not directly comparable to that of clinical practice. Additionally, there is limited understanding of the effect of exercise on specific human adipose tissue regions; therefore caution should be taken when extrapolating these data to human health. Second, it is possible that the duration of wheel running and timing of sample collection may influence our data. We chose to use a limited duration of wheel running to avoid adipogenesis and compensatory adaptations after iWAT removal (6, 9, 11), and extending the duration may yield different results. It would also be interesting to determine if the adaptions to wheel running persist for a longer time period than measured in this study (i.e., >6 h for tissue collection and >12 h for metabolic caging), and if this is different in mice with and without iWAT. Finally, a limited number of tissues was assessed in this study. Identifying how removal of iWAT impacts other subcutaneous white adipose tissue depots, rather than just eWAT and BAT, may indicate compensatory adaptations that have been missed. As we used the triceps muscle in this study, which is distant from the iWAT depot removed, analysis of whether LIPX alters VWR-induced adaptations in skeletal muscle of closer proximity to iWAT may also be of importance.
Overall, the results of this study demonstrate that although iWAT is highly responsive to exercise training, the metabolic contributions of this depot are not required for the beneficial effects of wheel running. Given the known important contributions of UCP-1 to thermogenesis and energy homeostasis (17), and the now-numerous papers demonstrating exercise-induced increases in UCP-1 in iWAT (5, 28, 42), future studies are needed to directly delineate how these unique adaptations of iWAT are involved in the effects of exercise at the whole body level.
GRANTS
D. C. Wright is funded by a Natural Sciences and Engineering Research Council of Canada (NSERC) Grant and is a Tier II Canada Research Chair in Lipids, Metabolism, and Health. W. T. Peppler is supported by a Queen Elizabeth II Scholarship in Science and Technology. L. K. Townsend is supported by a Dairy Farmers of Ontario Doctoral Research Assistantship and an Ontario Graduate Scholarship.
DISCLOSURES
No conflicts of interest, financial or otherwise, are declared by the authors.
AUTHOR CONTRIBUTIONS
W.T.P., M.T.F., and D.C.W. conceived and designed research; W.T.P., L.K.T., C.M.K., and D.C.W. performed experiments; W.T.P., L.K.T., C.M.K., and D.C.W. analyzed data; W.T.P., L.K.T., C.M.K., M.T.F., and D.C.W. interpreted results of experiments; W.T.P., L.K.T., C.M.K., and D.C.W. prepared figures; W.T.P. and D.C.W. drafted manuscript; W.T.P., L.K.T., C.M.K., M.T.F., and D.C.W. edited and revised manuscript; W.T.P., L.K.T., C.M.K., M.T.F., and D.C.W. approved final version of manuscript.
ACKNOWLEDGMENTS
We thank Dr. J. Simpson (Univ. of Guelph) for supply of surgical equipment and space, Dr. L. Robinson and D. Liddle (Univ. of Guelph) for use of the multiplex machine, and Dr. R. MacPherson (Brock Univ.) for helpful discussion in the planning of this study.
REFERENCES
- 1.Alessi DR, Andjelkovic M, Caudwell B, Cron P, Morrice N, Cohen P, Hemmings BA. Mechanism of activation of protein kinase B by insulin and IGF-1. EMBO J 15: 6541–6551, 1996. [PMC free article] [PubMed] [Google Scholar]
- 2.Alessi DR, James SR, Downes CP, Holmes AB, Gaffney PR, Reese CB, Cohen P. Characterization of a 3-phosphoinositide-dependent protein kinase which phosphorylates and activates protein kinase Balpha. Curr Biol 7: 261–269, 1997. doi: 10.1016/S0960-9822(06)00122-9. [DOI] [PubMed] [Google Scholar]
- 3.Boström P, Wu J, Jedrychowski MP, Korde A, Ye L, Lo JC, Rasbach KA, Boström EA, Choi JH, Long JZ, Kajimura S, Zingaretti MC, Vind BF, Tu H, Cinti S, Højlund K, Gygi SP, Spiegelman BM. A PGC1-α-dependent myokine that drives brown-fat-like development of white fat and thermogenesis. Nature 481: 463–468, 2012. doi: 10.1038/nature10777. [DOI] [PMC free article] [PubMed] [Google Scholar]
- 4.Cannon B, Nedergaard J. Nonshivering thermogenesis and its adequate measurement in metabolic studies. J Exp Biol 214: 242–253, 2011. doi: 10.1242/jeb.050989. [DOI] [PubMed] [Google Scholar]
- 5.Cao L, Choi EY, Liu X, Martin A, Wang C, Xu X, During MJ. White to brown fat phenotypic switch induced by genetic and environmental activation of a hypothalamic-adipocyte axis. Cell Metab 14: 324–338, 2011. doi: 10.1016/j.cmet.2011.06.020. [DOI] [PMC free article] [PubMed] [Google Scholar]
- 6.Cox-York K, Wei Y, Wang D, Pagliassotti MJ, Foster MT. Lower body adipose tissue removal decreases glucose tolerance and insulin sensitivity in mice with exposure to high fat diet. Adipocyte 4: 32–43, 2014. doi: 10.4161/21623945.2014.957988. [DOI] [PMC free article] [PubMed] [Google Scholar]
- 7.de Jong JM, Larsson O, Cannon B, Nedergaard J. A stringent validation of mouse adipose tissue identity markers. Am J Physiol Endocrinol Metab 308: E1085–E1105, 2015. doi: 10.1152/ajpendo.00023.2015. [DOI] [PubMed] [Google Scholar]
- 8.Dubé JJ, Sitnick MT, Schoiswohl G, Wills RC, Basantani MK, Cai L, Pulinilkunnil T, Kershaw EE. Adipose triglyceride lipase deletion from adipocytes, but not skeletal myocytes, impairs acute exercise performance in mice. Am J Physiol Endocrinol Metab 308: E879–E890, 2015. doi: 10.1152/ajpendo.00530.2014. [DOI] [PMC free article] [PubMed] [Google Scholar]
- 9.Faust IM, Johnson PR, Hirsch J. Adipose tissue regeneration following lipectomy. Science 197: 391–393, 1977. doi: 10.1126/science.877563. [DOI] [PubMed] [Google Scholar]
- 10.Flouris AD, Dinas PC, Valente A, Andrade CMB, Kawashita NH, Sakellariou P. Exercise-induced effects on UCP1 expression in classical brown adipose tissue: a systematic review. Horm Mol Biol Clin Investig 31: 20160048, 2017. doi: 10.1515/hmbci-2016-0048. [DOI] [PubMed] [Google Scholar]
- 11.Foster MT, Softic S, Caldwell J, Kohli R, de Kloet AD, Seeley RJ. Subcutaneous adipose tissue transplantation in diet-induced obese mice attenuates metabolic dysregulation while removal exacerbates it. Physiol Rep 1: e00015, 2013. doi: 10.1002/phy2.15. [DOI] [PMC free article] [PubMed] [Google Scholar]
- 12.Fox CS, Massaro JM, Hoffmann U, Pou KM, Maurovich-Horvat P, Liu CY, Vasan RS, Murabito JM, Meigs JB, Cupples LA, D’Agostino RB Sr, O’Donnell CJ. Abdominal visceral and subcutaneous adipose tissue compartments: association with metabolic risk factors in the Framingham Heart Study. Circulation 116: 39–48, 2007. doi: 10.1161/CIRCULATIONAHA.106.675355. [DOI] [PubMed] [Google Scholar]
- 13.Frendo-Cumbo S, MacPherson RE, Wright DC. Beneficial effects of combined resveratrol and metformin therapy in treating diet-induced insulin resistance. Physiol Rep 4: e12877, 2016. doi: 10.14814/phy2.12877. [DOI] [PMC free article] [PubMed] [Google Scholar]
- 14.Gohil K, Henderson S, Terblanche SE, Brooks GA, Packer L. Effects of training and exhaustive exercise on the mitochondrial oxidative capacity of brown adipose tissue. Biosci Rep 4: 987–993, 1984. doi: 10.1007/BF01116898. [DOI] [PubMed] [Google Scholar]
- 15.Haase TN, Ringholm S, Leick L, Biensø RS, Kiilerich K, Johansen S, Nielsen MM, Wojtaszewski JF, Hidalgo J, Pedersen PA, Pilegaard H. Role of PGC-1α in exercise and fasting-induced adaptations in mouse liver. Am J Physiol Regul Integr Comp Physiol 301: R1501–R1509, 2011. doi: 10.1152/ajpregu.00775.2010. [DOI] [PubMed] [Google Scholar]
- 16.Holloszy JO. Biochemical adaptations in muscle. Effects of exercise on mitochondrial oxygen uptake and respiratory enzyme activity in skeletal muscle. J Biol Chem 242: 2278–2282, 1967. [PubMed] [Google Scholar]
- 17.Kajimura S, Spiegelman BM, Seale P. Brown and beige fat: physiological roles beyond heat generation. Cell Metab 22: 546–559, 2015. doi: 10.1016/j.cmet.2015.09.007. [DOI] [PMC free article] [PubMed] [Google Scholar]
- 18.Kalinovich AV, de Jong JM, Cannon B, Nedergaard J. UCP1 in adipose tissues: two steps to full browning. Biochimie 134: 127–137, 2017. doi: 10.1016/j.biochi.2017.01.007. [DOI] [PubMed] [Google Scholar]
- 19.Kazak L, Chouchani ET, Jedrychowski MP, Erickson BK, Shinoda K, Cohen P, Vetrivelan R, Lu GZ, Laznik-Bogoslavski D, Hasenfuss SC, Kajimura S, Gygi SP, Spiegelman BM. A creatine-driven substrate cycle enhances energy expenditure and thermogenesis in beige fat. Cell 163: 643–655, 2015. doi: 10.1016/j.cell.2015.09.035. [DOI] [PMC free article] [PubMed] [Google Scholar]
- 20.Kazak L, Chouchani ET, Stavrovskaya IG, Lu GZ, Jedrychowski MP, Egan DF, Kumari M, Kong X, Erickson BK, Szpyt J, Rosen ED, Murphy MP, Kristal BS, Gygi SP, Spiegelman BM. UCP1 deficiency causes brown fat respiratory chain depletion and sensitizes mitochondria to calcium overload-induced dysfunction. Proc Natl Acad Sci USA 114: 7981–7986, 2017. doi: 10.1073/pnas.1705406114. [DOI] [PMC free article] [PubMed] [Google Scholar]
- 21.Labbé SM, Caron A, Chechi K, Laplante M, Lecomte R, Richard D. Metabolic activity of brown, “beige,” and white adipose tissues in response to chronic adrenergic stimulation in male mice. Am J Physiol Endocrinol Metab 311: E260–E268, 2016. doi: 10.1152/ajpendo.00545.2015. [DOI] [PMC free article] [PubMed] [Google Scholar]
- 22.Leasure JL, Jones M. Forced and voluntary exercise differentially affect brain and behavior. Neuroscience 156: 456–465, 2008. doi: 10.1016/j.neuroscience.2008.07.041. [DOI] [PubMed] [Google Scholar]
- 23.Livak KJ, Schmittgen TD. Analysis of relative gene expression data using real-time quantitative PCR and the 2(-Delta Delta C(T)) Method. Methods 25: 402–408, 2001. doi: 10.1006/meth.2001.1262. [DOI] [PubMed] [Google Scholar]
- 24.Mottillo EP, Desjardins EM, Fritzen AM, Zou VZ, Crane JD, Yabut JM, Kiens B, Erion DM, Lanba A, Granneman JG, Talukdar S, Steinberg GR. FGF21 does not require adipocyte AMP-activated protein kinase (AMPK) or the phosphorylation of acetyl-CoA carboxylase (ACC) to mediate improvements in whole-body glucose homeostasis. Mol Metab 6: 471–481, 2017. doi: 10.1016/j.molmet.2017.04.001. [DOI] [PMC free article] [PubMed] [Google Scholar]
- 25.Nedergaard J, Cannon B. The browning of white adipose tissue: some burning issues. Cell Metab 20: 396–407, 2014. doi: 10.1016/j.cmet.2014.07.005. [DOI] [PubMed] [Google Scholar]
- 26.Park J, Kim M, Sun K, An YA, Gu X, Scherer PE. VEGF-A expressing adipose tissue shows rapid beiging, enhanced survival after transplantation and confers IL4-independent metabolic improvements. Diabetes 66: 1479–1490, 2017. doi: 10.2337/db16-1081. [DOI] [PMC free article] [PubMed] [Google Scholar]
- 27.Pendergast JS, Branecky KL, Huang R, Niswender KD, Yamazaki S. Wheel-running activity modulates circadian organization and the daily rhythm of eating behavior. Front Psychol 5: 177, 2014. doi: 10.3389/fpsyg.2014.00177. [DOI] [PMC free article] [PubMed] [Google Scholar]
- 28.Peppler WT, Anderson ZG, MacRae LM, MacPherson REK, Wright DC. Habitual physical activity protects against lipopolysaccharide-induced inflammation in mouse adipose tissue. Adipocyte 6: 1–11, 2017. doi: 10.1080/21623945.2016.1259778. [DOI] [PMC free article] [PubMed] [Google Scholar]
- 29.Peppler WT, Anderson ZG, Sutton CD, Rector RS, Wright DC. Voluntary wheel running attenuates lipopolysaccharide-induced liver inflammation in mice. Am J Physiol Regul Integr Comp Physiol 310: R934–R942, 2016. doi: 10.1152/ajpregu.00497.2015. [DOI] [PMC free article] [PubMed] [Google Scholar]
- 30.Peppler WT, Miotto PM, Holloway GP, Wright DC. CL 316, 243 mediated reductions in blood glucose are enhanced in RIP140−/− mice independent of alterations in lipolysis. Biochem Biophys Res Commun 486: 486–491, 2017. doi: 10.1016/j.bbrc.2017.03.067. [DOI] [PubMed] [Google Scholar]
- 31.Powers SK, Jackson MJ. Exercise-induced oxidative stress: cellular mechanisms and impact on muscle force production. Physiol Rev 88: 1243–1276, 2008. doi: 10.1152/physrev.00031.2007. [DOI] [PMC free article] [PubMed] [Google Scholar]
- 32.Richter EA, Hargreaves M. Exercise, GLUT4, and skeletal muscle glucose uptake. Physiol Rev 93: 993–1017, 2013. doi: 10.1152/physrev.00038.2012. [DOI] [PubMed] [Google Scholar]
- 33.Ringholm S, Grunnet Knudsen J, Leick L, Lundgaard A, Munk Nielsen M, Pilegaard H. PGC-1α is required for exercise- and exercise training-induced UCP1 up-regulation in mouse white adipose tissue. PLoS One 8: e64123, 2013. doi: 10.1371/journal.pone.0064123. [DOI] [PMC free article] [PubMed] [Google Scholar]
- 34.Romero-Calvo I, Ocón B, Martínez-Moya P, Suárez MD, Zarzuelo A, Martínez-Augustin O, de Medina FS. Reversible Ponceau staining as a loading control alternative to actin in Western blots. Anal Biochem 401: 318–320, 2010. doi: 10.1016/j.ab.2010.02.036. [DOI] [PubMed] [Google Scholar]
- 35.Schertzer JD, Tamrakar AK, Magalhães JG, Pereira S, Bilan PJ, Fullerton MD, Liu Z, Steinberg GR, Giacca A, Philpott DJ, Klip A. NOD1 activators link innate immunity to insulin resistance. Diabetes 60: 2206–2215, 2011. doi: 10.2337/db11-0004. [DOI] [PMC free article] [PubMed] [Google Scholar]
- 36.Schneider CA, Rasband WS, Eliceiri KW. NIH Image to ImageJ: 25 years of image analysis. Nat Methods 9: 671–675, 2012. doi: 10.1038/nmeth.2089. [DOI] [PMC free article] [PubMed] [Google Scholar]
- 37.Shabalina IG, Vrbacký M, Pecinová A, Kalinovich AV, Drahota Z, Houštěk J, Mráček T, Cannon B, Nedergaard J. ROS production in brown adipose tissue mitochondria: the question of UCP1-dependence. Biochim Biophys Acta 1837: 2017–2030, 2014. doi: 10.1016/j.bbabio.2014.04.005. [DOI] [PubMed] [Google Scholar]
- 38.Slocum N, Durrant JR, Bailey D, Yoon L, Jordan H, Barton J, Brown RH, Clifton L, Milliken T, Harrington W, Kimbrough C, Faber CA, Cariello N, Elangbam CS. Responses of brown adipose tissue to diet-induced obesity, exercise, dietary restriction and ephedrine treatment. Exp Toxicol Pathol 65: 549–557, 2013. doi: 10.1016/j.etp.2012.04.001. [DOI] [PubMed] [Google Scholar]
- 39.Smith PK, Krohn RI, Hermanson GT, Mallia AK, Gartner FH, Provenzano MD, Fujimoto EK, Goeke NM, Olson BJ, Klenk DC. Measurement of protein using bicinchoninic acid. Anal Biochem 150: 76–85, 1985. doi: 10.1016/0003-2697(85)90442-7. [DOI] [PubMed] [Google Scholar]
- 40.Snook LA, MacPherson RE, Monaco CM, Frendo-Cumbo S, Castellani L, Peppler WT, Anderson ZG, Buzelle SL, LeBlanc PJ, Holloway GP, Wright DC. Prior exercise training blunts short-term high-fat diet-induced weight gain. Am J Physiol Regul Integr Comp Physiol 311: R315–R324, 2016. doi: 10.1152/ajpregu.00072.2016. [DOI] [PMC free article] [PubMed] [Google Scholar]
- 41.Stallknecht B, Vinten J, Ploug T, Galbo H. Increased activities of mitochondrial enzymes in white adipose tissue in trained rats. Am J Physiol Endocrinol Metab 261: E410–E414, 1991. [DOI] [PubMed] [Google Scholar]
- 42.Stanford KI, Middelbeek RJ, Townsend KL, Lee MY, Takahashi H, So K, Hitchcox KM, Markan KR, Hellbach K, Hirshman MF, Tseng YH, Goodyear LJ. A novel role for subcutaneous adipose tissue in exercise-induced improvements in glucose homeostasis. Diabetes 64: 2002–2014, 2015. doi: 10.2337/db14-0704. [DOI] [PMC free article] [PubMed] [Google Scholar]
- 43.Sutherland LN, Bomhof MR, Capozzi LC, Basaraba SA, Wright DC. Exercise and adrenaline increase PGC-1alpha mRNA expression in rat adipose tissue. J Physiol 587: 1607–1617, 2009. doi: 10.1113/jphysiol.2008.165464. [DOI] [PMC free article] [PubMed] [Google Scholar]
- 44.Terblanche SE, Gohil K, Packer L, Henderson S, Brooks GA. The effects of endurance training and exhaustive exercise on mitochondrial enzymes in tissues of the rat (Rattus norvegicus). Comp Biochem Physiol A Mol Integr Physiol 128: 889–896, 2001. doi: 10.1016/S1095-6433(00)00344-5. [DOI] [PubMed] [Google Scholar]
- 45.Townsend KL, Tseng Y-H. Brown fat fuel utilization and thermogenesis. Trends Endocrinol Metab 25: 168–177, 2014. doi: 10.1016/j.tem.2013.12.004. [DOI] [PMC free article] [PubMed] [Google Scholar]
- 46.Tran TT, Yamamoto Y, Gesta S, Kahn CR. Beneficial effects of subcutaneous fat transplantation on metabolism. Cell Metab 7: 410–420, 2008. doi: 10.1016/j.cmet.2008.04.004. [DOI] [PMC free article] [PubMed] [Google Scholar]
- 47.Véniant Murielle M, Sivits G, Helmering J, Komorowski R, Lee J, Fan W, Moyer C, Lloyd David J. Pharmacologic effects of FGF21 are independent of the “browning” of white adipose tissue. Cell Metab 21: 731–738, 2015. doi: 10.1016/j.cmet.2015.04.019. [DOI] [PubMed] [Google Scholar]
- 48.Warburton DE, Nicol CW, Bredin SS. Health benefits of physical activity: the evidence. CMAJ 174: 801–809, 2006. doi: 10.1503/cmaj.051351. [DOI] [PMC free article] [PubMed] [Google Scholar]
- 49.Wu J, Cohen P, Spiegelman BM. Adaptive thermogenesis in adipocytes: is beige the new brown? Genes Dev 27: 234–250, 2013. doi: 10.1101/gad.211649.112. [DOI] [PMC free article] [PubMed] [Google Scholar]
- 50.Wu MV, Bikopoulos G, Hung S, Ceddia RB. Thermogenic capacity is antagonistically regulated in classical brown and white subcutaneous fat depots by high fat diet and endurance training in rats: impact on whole-body energy expenditure. J Biol Chem 289: 34129–34140, 2014. doi: 10.1074/jbc.M114.591008. [DOI] [PMC free article] [PubMed] [Google Scholar]


